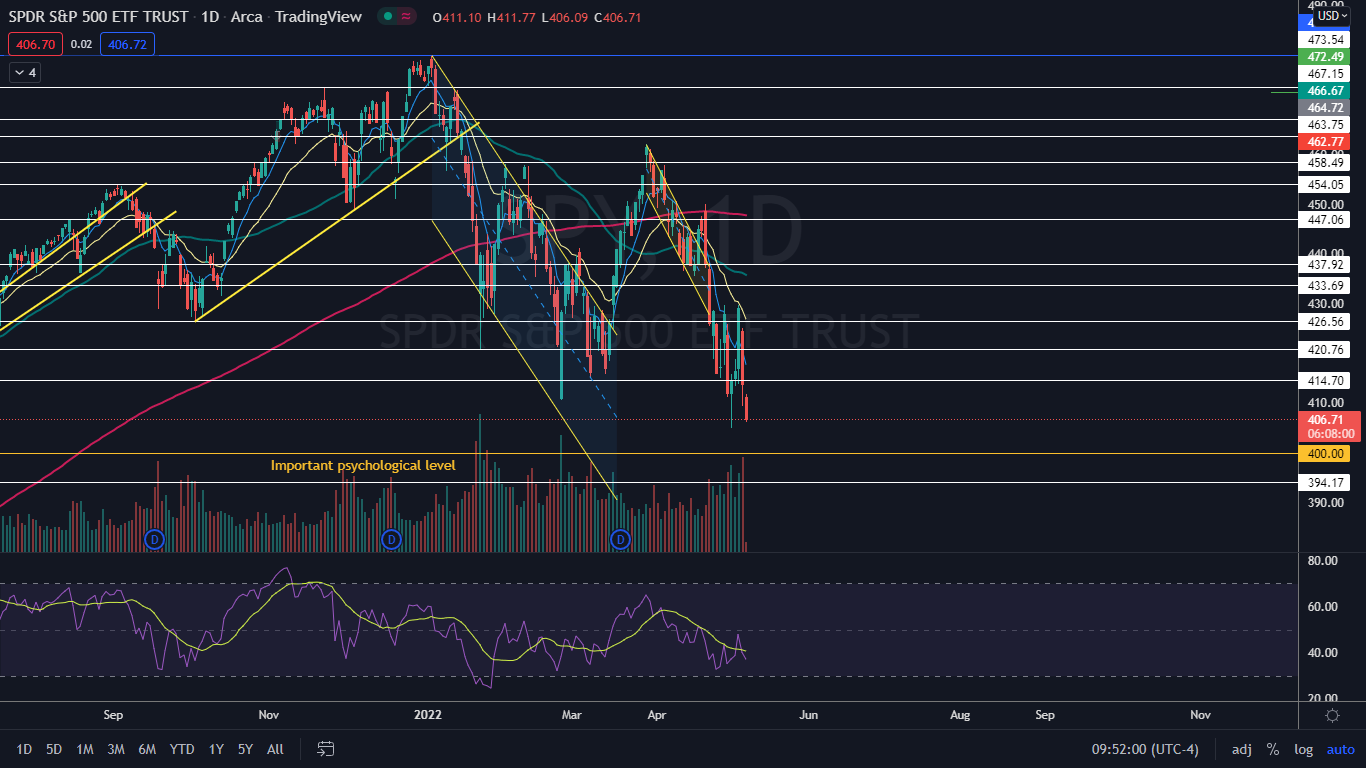
The SPDR S&P 500 (NYSE:SPY) plunged 3.55% on Thursday on higher-than-average volume, in the worst single-day sell-off since the pandemic began.
This indicates fear gripped the market, and its investors, following a volatile period that has made trading frustrating and undoubtably ripped capital from the retail investors’ pocket.
The sharp decline had some traders reminiscing back to March 2020, when fear over the effects of the COVID-19 pandemic clutched the market, which resulted in multiple circuit breaker halts due to the S&P 500 index dropping 7% within a single trading day.
On Friday, the SPY opened lower and continued to slide, losing Thursday’s low-of-day within the first 5 minutes of trading. The market is experiencing a solid bear cycle, where bearish traders and investors will feast and the bulls will need to muster up as much patience as possible to either aggressively play the small bounces that will come or patiently wait for the tides to turn.
Interesting Fact: Friday marks the 12-year anniversary of the 2010 flash crash, also known as the crash of 2:45, where the S&P 500, Dow Jones Industrial Average and Nasdaq Composite collapsed before mostly recovering.
The crash, which temporarily erased about $1 trillion in market value and lasted about 36 minutes, caused the Dow Jones to plummet about 9% within minutes.
In 2015, the U.S. Department of Justice laid 22 charges against 36-year old British trader Navinder Singh Sarao, who modified the code of trading software to manipulate the market.
Sarao used the software to place and then modify thousands of orders of E-mini S&P 500 stock index futures contracts before cancelling the orders, which spoofed the market algorithms and contributed to the crash.
Want direct analysis? Find me in the BZ Pro lounge! Click here for a free trial.
The SPY Chart: The SPY has been trading in a fairly consistent downtrend since March 29, when the ETF topped out at the $462.07 level. The most recent lower high was printed on Wednesday at $429.66, and the most recent confirmed lower low was formed at the $405.02 level on May 2.
- Technical traders may have identified that Thursday’s bullish price action was setting up a bearish reversal because on that day, the SPY printed a double top pattern near the $429 level when paired with the price action on April 28. Friday’s bearish price action may be a continuation of that pattern.
- Although the SPY looks grim for the bulls, the ETF has not back tested the psychologically important $400 level since crossing above it on April 1, 2021. If the SPY falls to the level, it’s likely to act as a trampoline at least for a short-term bounce.
- If the SPY closes the trading day near its low-of-day price, it will print a bearish Marubozu candlestick, which could indicate lower prices will come again on Monday. If the ETF bounces intraday to close flat or near its high-of-day price, it will print a doji or hammer candlestick, respectively, which could indicate a bounce is on the way.
- The SPY has resistance above at $414.70 and $420.76 and support at $400 and $394.17.


