Spotify Technology SA (NYSE:SPOT) shares are trading lower Thursday after the company reported fourth-quarter financial results and issued guidance.
Spotify reported quarterly revenue of 2.689 billion euros ($3.03 billion), representing an increase of 24% year-over-year. Spotify said it expects first-quarter revenue of 2.6 billion euros, which is below the current quarter's revenue and could be weighing on the stock.
Spotify was down 16.79% at $159.76 at time of publication Thursday afternoon.
See Related: Why Spotify Shares Are Falling Today
Spotify Daily Chart Analysis
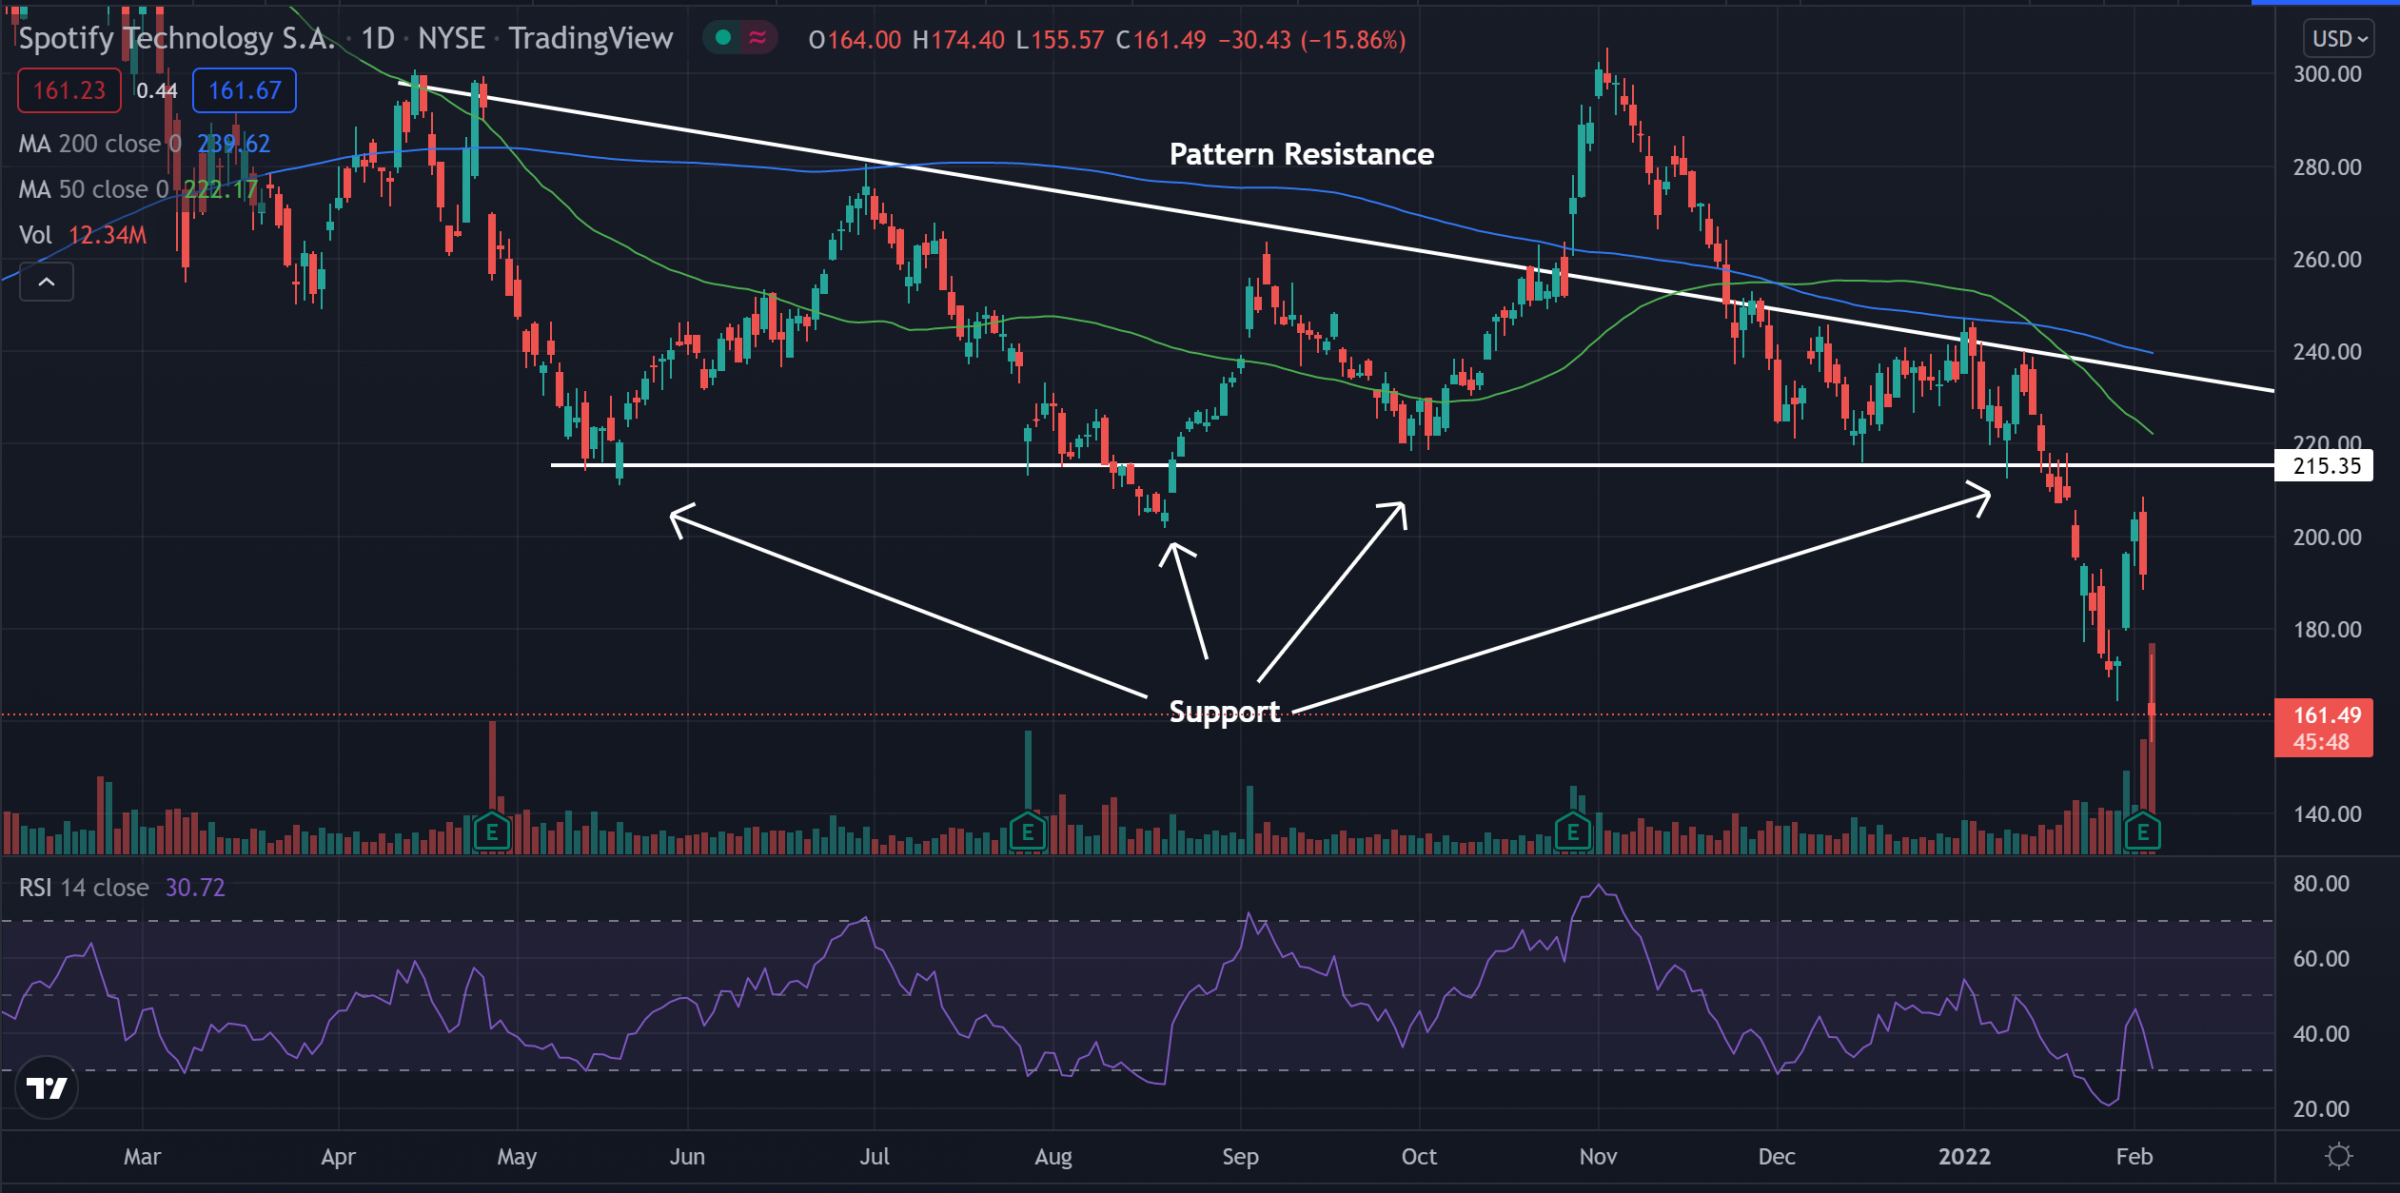
- The stock price has fallen below support in what traders call a descending triangle pattern. Support could be found near the $215 level before the break below support. Now, this level may act as an area of resistance for the stock.
- The stock trades below both the 50-day moving average (green) and the 200-day moving average (blue). This indicates bearish sentiment, and each of these moving averages may hold as an area of resistance in the future.
- The Relative Strength Index (RSI) has been steadily falling lower for the past few months and now sits at 30. This shows the RSI is on the border of being in the oversold territory where sellers heavily outweigh buyers in the stock. If the RSI continues to stay near the oversold area, the price of the stock may continue to fall lower.

What’s Next For Spotify?
Breaking below support in the pattern was the first bearish sign for the stock. Following the support break, the price went back up to the $215 level and began to hold it as resistance, another sign of bearish movement was coming. Bears are seeing what they like, hoping the stock continues a downward movement and an RSI that stays oversold. Bullish traders are looking for the stock to bounce back and begin to form higher lows. Bulls are then looking for the stock push back above the $215 level and back above the moving averages.
Photo by Alexander Shatov on Unsplash


.png?w=600)


