Solar stocks have been hit and miss — something that could be said over the past decade and over the past few quarters as well.
Enphase Energy (ENPH) was a big winner in the solar space, but it came under strong selling pressure before suffering a deep pullback after reporting earnings in late April, falling more than 26% in a single session.
Don't Miss: AMD Stock Drops After Earnings Report. Is It a Buying Opportunity?
First Solar (FSLR) had been one of the top-performing stocks on the year, up 48% at one point in 2023. But a few days after Enphase reported earnings, First Solar followed up with a bearish earnings reaction of its own.
While the shares were down about 15% at the low on April 28, the bulls were able to cut the losses to 9% by the close. Since then, First Solar stock has fallen in each session since that report.
Do these names have further to fall or is this a dip to buy?
Trading First Solar Stock
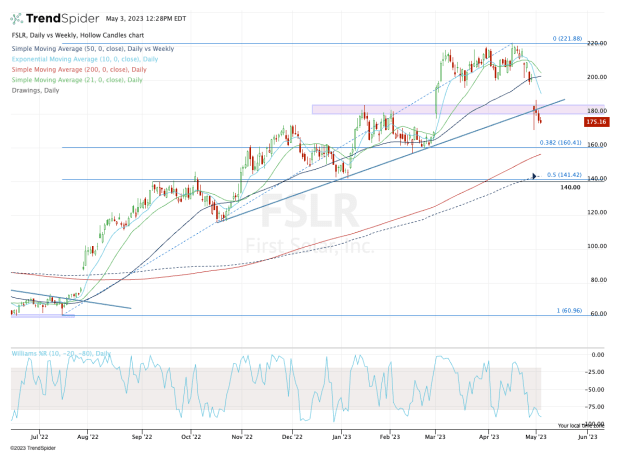
Chart courtesy of TrendSpider.com
When stocks like Chipotle Mexican Grill (CMG) are hitting all-time highs, it’s easy for traders to buy the dip in these trending names vs. trying to bottom-fish for a low in a group like solar stocks. In that respect, trend traders probably want to avoid First Solar and Enphase.
With the initial bounce off the post-earnings low, First Solar stock actually did a great job regaining its uptrend (blue line) and closing in the $180 to $185 zone, which bulls wanted to see hold as support.
A few days later, though, both measures have been lost. From here, it’s fairly straightforward.
If First Solar stock can clear the post-earnings high of $188.25 and the 10-day moving average (which is nearing this level now but continues to decline), it could open the door back up to the $198 to $200 zone.
Don't Miss: Regional Banks Tumble to 52-Week Lows. Here's the Chart View.
If, however, it closes below its post-earnings low around $170.50, it could put the 38.2% retracement near $160 in play, followed by the 200-day moving average currently at $156.
It’s worth mentioning that this area was solid support in February. If it fails as support, the $140 area could be in play.
Trading Enphase Energy Stock
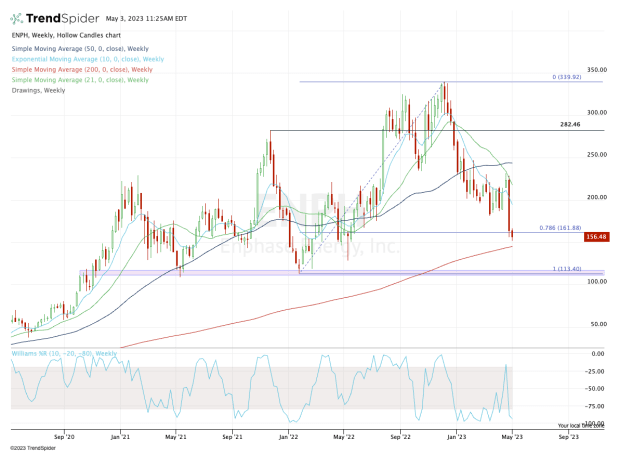
Chart courtesy of TrendSpider.com
There’s no question that First Solar has had more relative strength than Enphase — that’s true for its post-earnings reaction, as well as its price action leading up to the earnings report.
When we zoom out to the weekly chart, you’ll notice that Enphase has already dipped below its 78.6% retracement, measured from the 52-week high near $340 down to the low around $113.
Don't Miss: Zoom Video Stock Has Slumped; Is It Time to Buy?
The shares are now down more than 50% from the highs, and a slightly deeper dip could put the 200-week moving average in play near $145. If the shares close below this measure and continue lower, then the $115 support area could be next.
On a bounce, the $180s could very well be resistance. But above this area puts $200 in play.
Action Alerts PLUS offers expert portfolio guidance to help you make informed investing decisions. Sign up now.