
Getting accurate data from your Raspberry Pi is easy using the vcgencmd command but this project from SkatterBencher measures every aspect of our favorite single board computer and handily records it to a CSV file.
The project's creator noticed a lack of comprehensive telemetry tools, noting that others had created their own projects for specific data (just like our project.) Skatterbencher wanted a tool that worked more like HWiNFO, a tool to monitor and record telemetry data during a stress test. While this script doesn't (yet) perform a stress test, it does automatically record multiple datapoints for later analysis.
Written in Python, this script calls the vcgencmd command and provides real-time data on how our Raspberry Pi is performing. We took it for a spin on our Raspberry Pi 5 housed inside Sunfounder's Pironman 5 case.
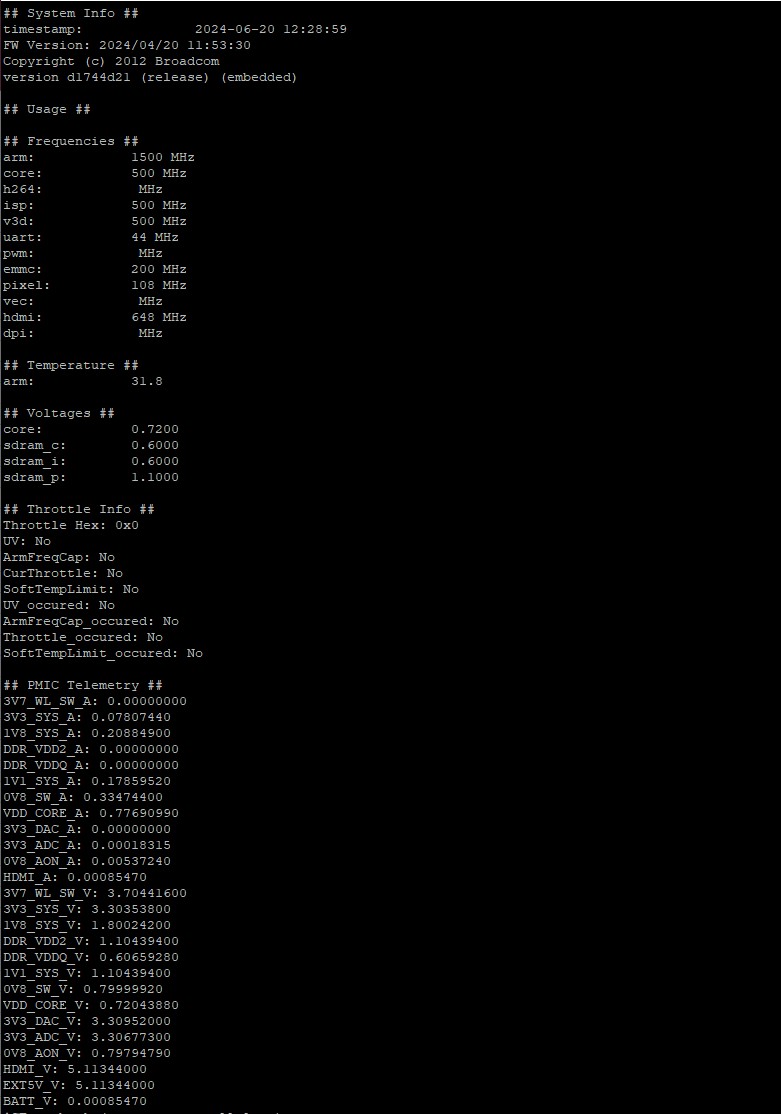
First of all, we get a plethora of Pi-data written to the Linux terminal. From the data, we know the clock speeds for our Arm CPU, GPU, UART, PWM, and many other interfaces. That Arm CPU temperature is displayed in its own section, just above the voltages for the CPU core and the onboard RAM. Next up we get data on CPU throttling which triggers once the CPU hits 82 degrees Celsius. Lastly, we get data on the PMIC (Power Management IC) which tells us about every aspect of the PMIC. This is especially useful for the new Raspberry Pi 5 which has a beefy PMIC compared to previous models.
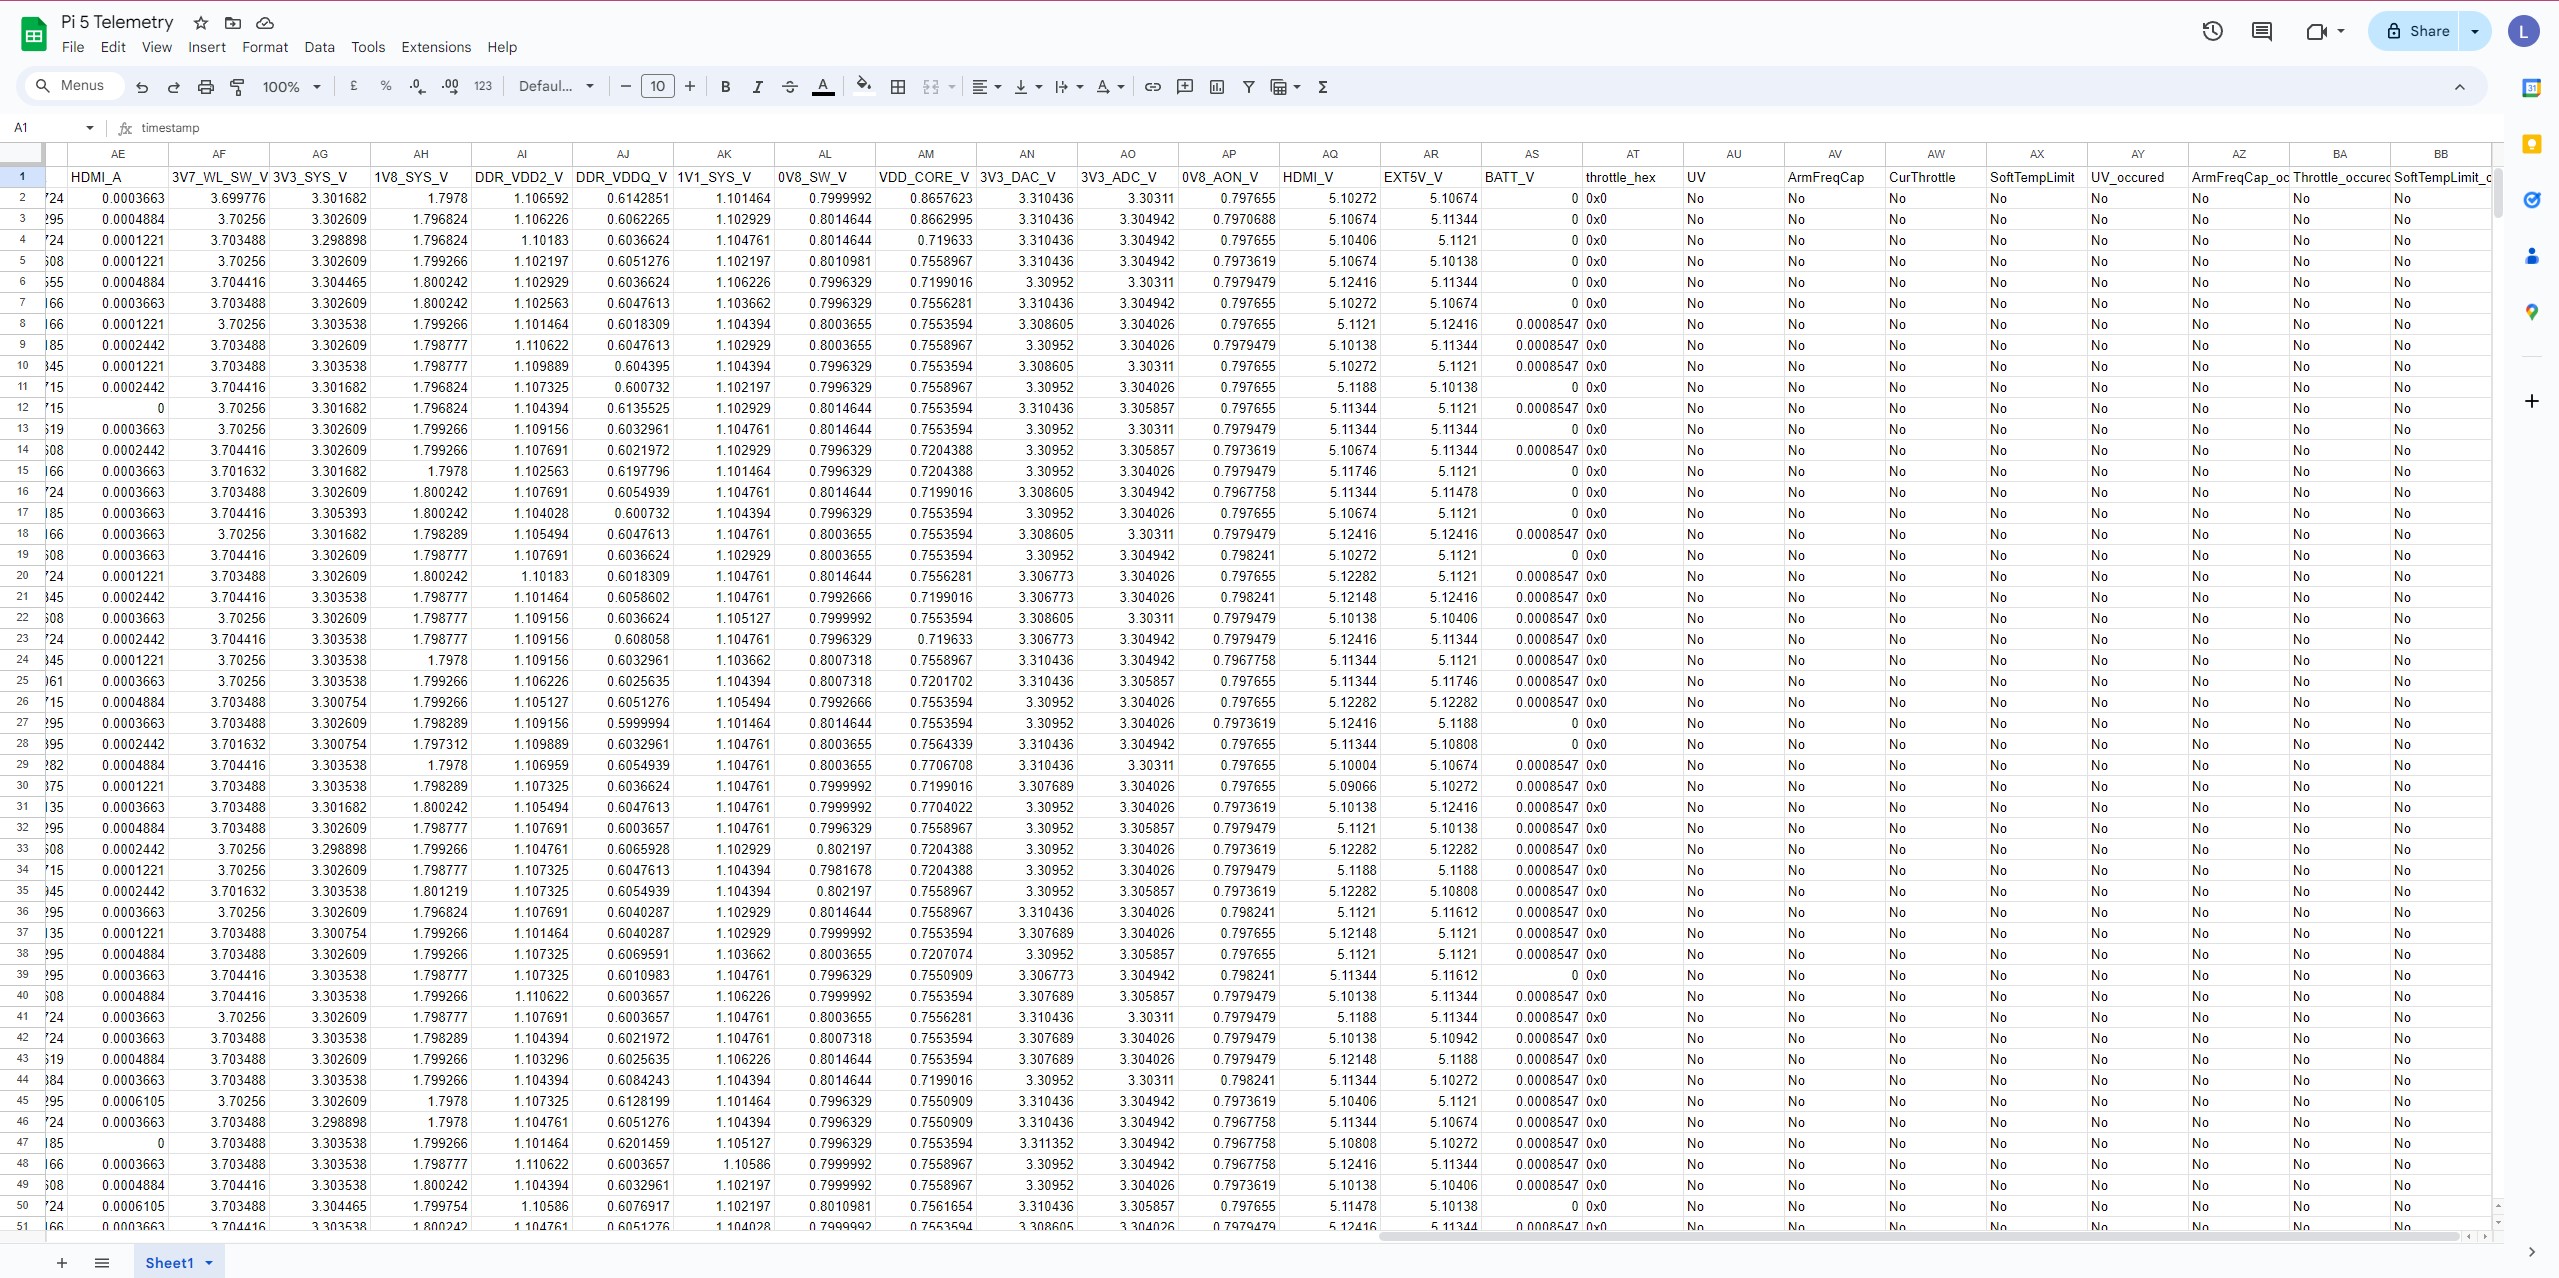
All of this data updates every second, so we get a constantly refreshed display. But for those of us who like to pore over the data in a spreadsheet, us included, then fear not, as the data is logged to a CSV file that can be easily imported into Microsoft Excel, LibreOffice, or even Google Sheets. The CSV output gives us granular-level data. We can see how our CPU is being used and its speed. We also get the data for PMIC, clocks, and temperature logged to the file every second.
Running the code is a simple matter of cloning the repository.
git clone https://github.com/SkatterBencher/rpi5-telemetry-python.gitChanging directory to the cloned repository, and we can then run the code using Python.
cd rpi5-telemetry-python
python telemetry_printCsvWorks_b.py
We get the real-time output and data logged to CSV for later use in a spreadsheet. All it needs now is a stress test option and we may have the perfect tool to stress and record our Raspberry Pis.
The project source can be found on the SkatterBencher GitHub page.