Ford (F), Rivian (RIVN) and other auto stocks were all booming higher on Tuesday and it was a good day to be an automotive investor. That's even if the most recent stretch of trading hasn’t been that good.
General Motors (GM) is up about 7% on the week, including an 8.9% rally on Tuesday after it announced its quarterly delivery results on Monday.
Ford reported its third-quarter delivery results Tuesday morning and climbed over 7% on the day as a result. It's up slightly today.
Finally, we have Rivian, which rallied more than 13% on Tuesday after it confirmed its production target for the year of 25,000 vehicles.
Despite supply constraints and rising inflation, Rivian is still on track. It produced more than 7,300 vehicles in the quarter and is now just 10,683 vehicles short of its goal.
Can that fix the stock price?
Trading Rivian Stock

Chart courtesy of TrendSpider.com
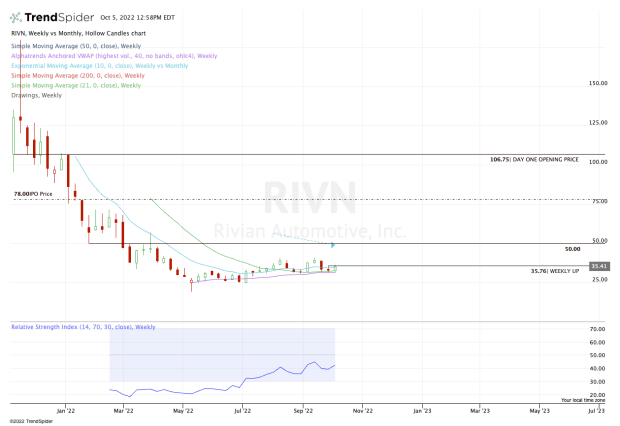
Above is a weekly chart, highlighting the pain that Rivian stock has gone through this year. Not only as a young automaker, but an unprofitable manufacturer and a growth stock.
As you know by now, growth stocks have paid the ultimate price amid this bear market.
Notice a few things about this chart, though.
First, the stock did not make new lows last week while many of the major US indices did. In fact, Rivian continues to hold many months worth of lows.
Second, it continues to hold the weekly VWAP measure and the 21-week moving average.
It almost had an inside week last week, but regardless, the stock is flirting with a weekly-up rotation over $35.76. It's down slightly on Wednesday, off about 2%, but the patterns remain intact.
Trading an upside rotation in a bear market can be tough, but it can also be profitable. If we close above last week’s high, we could see a push to the two-month high between $40.50 and $40.90.
Rivian stock put in a double-top in that zone, so it may very well serve as resistance. However, a push through this level opens the door to $50.
On the downside, it’s pretty simple: The two-week low is $31.86, while the September low is at $30.71.
To lose these marks will likely mean that Rivian stock also lost the weekly VWAP and the 21-week moving average. In that case, more downside could be in play and it’s a “no-touch” for bullish traders.


