
We have no idea how much Covid-19 is out there, but everyone agrees the official case numbers are vast undercounts, Marc Daalder reports
The Ministry of Health will launch a survey of random Covid-19 testing to determine the true community prevalence of the virus in the "coming weeks".
A spokesperson for the ministry confirmed to Newsroom the survey will seek community prevalence at any given point in time and also entail blood tests to scope the population's immunity to Covid-19. Seroprevalence testing will be able to differentiate between antibodies from Covid-19 infection, vaccination or a mix of the two.
"Infection surveys will include testing a statistically-appropriate sample of the population, in order to deduce the estimated true prevalence of Covid-19 infection irrespective of symptoms present or not. Design work is complete and we expect to have something in place over the coming weeks," the spokesperson said.
"The seroprevalence survey involves antibody testing and will be added a few weeks after the Infection Prevalence Survey commences."
A prevalence survey has long been called for by independent experts who say the daily case numbers are vast undercounts. Even Director-General of Health Ashley Bloomfield said on Thursday that we are only detecting half of the cases in the community. He said prevalence surveys are relied on heavily overseas when community transmission is so widespread.
In the United Kingdom, the Office for National Statistics has conducted a weekly prevalence survey since the original lockdown in 2020. As testing drops off and fewer people report positive results, the ONS figures are widely seen as the most accurate estimate of the spread of the virus.
Estimating prevalence
Without such a survey in New Zealand, we're left to cruder methods of estimating prevalence.
Comparing current hospitalisation rates in different age groups to a period where testing was higher - the start of the initial Omicron outbreak - indicates there may have been four times more cases in the last week of June than the 40,000 reported by the Ministry of Health.
Changes to methodologies for reporting hospitalisations makes it difficult to provide a more recent estimate of prevalence through this method.
There's also the WellKiwis survey, which randomly tests a cohort of adults and children in the Wellington region for influenza, Covid-19 and other viral illnesses. In the week ending July 3, more than 2.5 percent of the cohort tested positive for Covid-19. That's more than double what the public case numbers would suggest.
Other available data allows us to compare prevalence to previous stages of the Omicron outbreak.
Data from the Institute of Environmental Science and Research (ESR) also shows calls to Healthline about influenza-like illness have spiked nationwide since the end of May. In the week ending July 8, as many people called Healthline about flu-like symptoms as did in the second week of March, near the peak of our first Omicron wave. While some of this may relate to non-Covid-19 illness circulating in the community, it's still nearly double historical levels for this time of year.
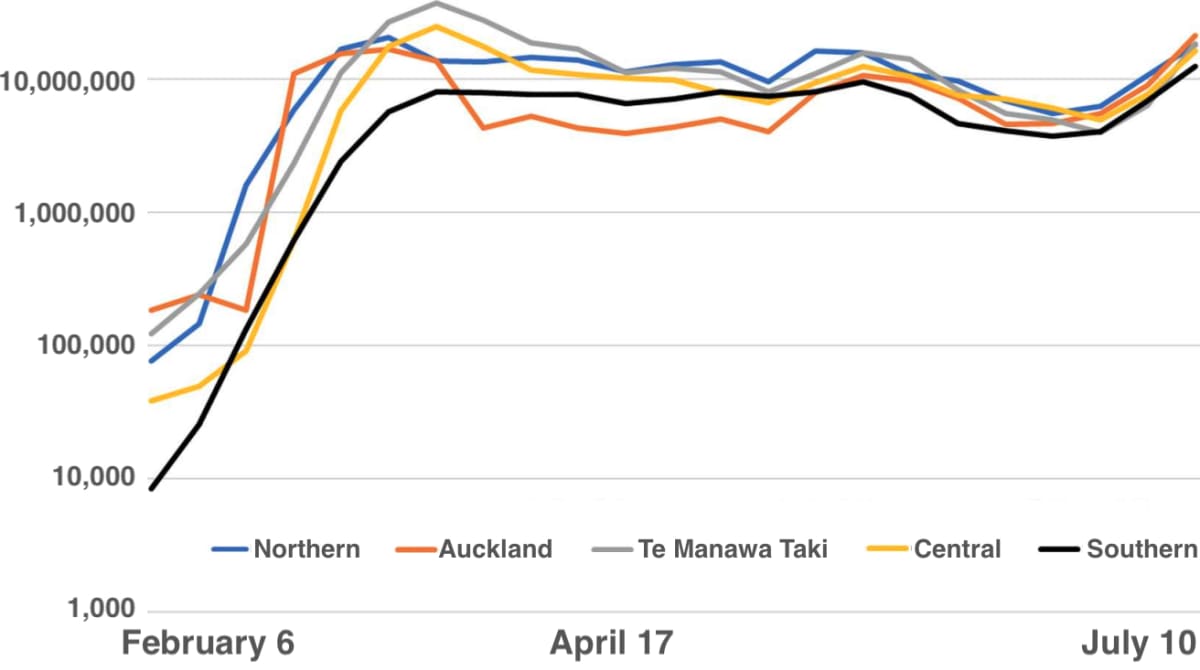
ESR also releases a weekly report on wastewater testing for Covid-19. The latest report, covering the week ending July 10, shows significantly more viral copies of Covid-19 were found in wastewater from the Auckland metro region and the South Island than at the peak of the first Omicron wave. Northland's wastewater prevalence was about equal to its previous peak, while the rest of the North Island had yet to reach those levels.
Regional wastewater samples indicate Covid rise (scale log10)
Knowing the prevalence of the virus is key to taking measures to protect yourself. Without accurate numbers, experts say, it's hard to make good judgments about whether you should attend a particular high-risk event, visit an elderly loved one or move a gathering outdoors to reduce the risk of spreading the virus.
Once the prevalence of Covid-19 is more widely available, it's even possible to calculate the likelihood of running into someone with the virus - if you make certain assumptions. Mathematical biologist Kit Yates provided the formula behind the following chart, which assumes half of all cases isolate and the virus is evenly distributed across the population.
BA.5 fuels rise in cases
The surge in cases is undoubtedly being driven by the BA.5 subvariant, which made up more than half of yesterday's cases.
It will take another few days to fully confirm that, but the latest variant sequencing data released by ESR shows that BA.5 was responsible for 46 percent of cases on July 8. That was up 13 percentage points from a week prior, meaning even two thirds of our cases could be the hyper-transmissible subvariant at this stage.
What we can say for certain is that BA.5 is now the dominant variant, with the BA.2 subvariant in second place with 41 percent of genomes.
The recent surge in cases will have been fuelled by BA.5 and the slightly slower rise of the similar BA.4 subvariant. If the ESR sequences are overlaid on New Zealand's total community case curve, we can see BA.2, which drove our original Omicron wave and was the dominant variant until early July, has roughly settled around a baseline of 3000 daily cases.