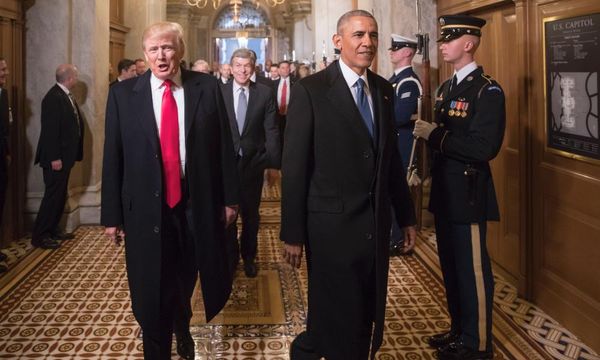
President Donald Trump marked his 50th day in office on Monday. So far, the stock market is off to its worst start since President Barack Obama's first term in 2009.
The Dow Jones Industrial Average is down 3.6% since Trump's second inauguration, with the S&P 500 index off 6.4% and the Nasdaq composite tumbling 11%. The small-cap Russell 2000 has slumped 11.3%. All of these indexes have also dropped below their closes on Nov. 5, Election Day. Trump's victory triggered a strong rally over the next several weeks.
But stocks have tumbled recently, especially since the S&P 500's all-time high on Feb. 19. Megacaps Tesla and Nvidia have been major losers, but declines have been sharp and widespread.
Presidential Stock Market Performance After 50 Days
| Year | President | Dow Jones | S&P 500 | Nasdaq composite | Russell 2000 |
|---|---|---|---|---|---|
| 1953 | Dwight Eisenhower (R) | -0.6% | -0.4% | ||
| 1957 | Dwight Eisenhower (R) | -1.2% | -1.3% | ||
| 1961 | John Kennedy (D) | 4.9% | 6.2% | ||
| 1965 | Lyndon Johnson (D) | -0.4% | -0.1% | ||
| 1969 | Richard Nixon (R) | -2.0% | -3.0% | ||
| 1973 | Richard Nixon (R) | -5.3% | -4.2% | -8.9% | |
| 1977 | Jimmy Carter (D) | -2.3% | -3.1% | -1.7% | |
| 1981 | Ronald Reagan (R) | 0.2% | -2.9% | -1.3% | |
| 1985 | Ronald Reagan (R) | 3.4% | 4.4% | 6.9% | |
| 1989 | George H.W. Bush (R) | 1.9% | 2.1% | 3.8% | 4.3% |
| 1993 | Bill Clinton (D) | 6.8% | 4.9% | -0.6% | 2.0% |
| 1997 | Bill Clinton (D) | 3.6% | 4.8% | -2.0% | -0.2% |
| 2001 | George W. Bush (R) | 0.5% | -8.1% | -25.9% | -3.0% |
| 2005 | George W. Bush (R) | 3.0% | 2.1% | -0.7% | 1.5% |
| 2009 | Barack Obama (D) | -16.4% | -15.4% | -11.2% | -21.2% |
| 2013 | Barack Obama (D) | 5.8% | 4.7% | 3.8% | 5.6% |
| 2017 | Donald Trump (R) | 5.9% | 4.8% | 5.8% | 1.5% |
| 2021 | Joseph Biden (D) | 4.4% | 2.6% | -1.0% | 6.3% |
| 2025 | Donald Trump (R) | -3.6% | -6.4% | -11.0% | -11.3% |
| Average | 0.5% | -0.4% | -3.1% | -1.5% |
Source: Dow Jones Market Data
Investors had been confident heading into President Trump's second term, with the economy running at a modest pace and inflation slowly normalizing. But President Trump quickly moved to impose several waves of tariffs, with tariff exemptions and related headlines adding to the uncertainty. Trump himself recently declined to rule out a recession, saying the economy was undergoing a "transition."
It's a big shift from the start of President Trump's first term in 2017. The Dow Jones had its best performance since Bill Clinton's first term in 1993. The Nasdaq had its best presidential start since Ronald Reagan's second term in 1985. In Trump's first term, he focused on sweeping tax cuts first. Trump tariffs didn't start until much later, and were mostly focused on China.
Along with Trump's 2025 tariff push, Nvidia and other artificial intelligence hardware stocks crashed Jan. 27 on fears related to Chinese AI startup DeepSeek. Nvidia stock and most other names have, after a brief rebound, continued to sell off, taking a big market toll.
Stock Market Declined Initially Under Obama, Bush
Back in 2009, the stock market suffered double-digit declines in Obama's first 50 days. The Dow Jones sank 16.4%, the S&P 500 fell 15.4%, the Nasdaq lost 11.2%, and the Russell 2000 shed 21.2%. The U.S. was in the grips of the Great Financial Crisis and a sharp bear market. In fact, the bear market bottomed right around the end of Obama's first 50 days.
Back in 2001, the Dow Jones edged up 0.5% in George W. Bush's first 50 days, while the Russell 200 fell 3%. But the S&P 500 lost 8.1% and the Nasdaq plunged 25.9%. Bush took office in the midst of the 2000-02 dot-com bust, with the U.S. economy in a mild recession.
On average, the stock market tends to have a mixed to slightly weak performance to start presidential terms. The Dow Jones has averaged a 0.5% gain while the S&P 500 has dipped 0.4%. With a shorter history, the Nasdaq has averaged a 3.1% decline with the Russell 2000 off 1.5%.
Please follow Ed Carson on Threads at @edcarson1971 and X/Twitter at @IBD_ECarson for stock market updates and more.