The world has recently seen a number of high-profile cross-border disease outbreaks and pandemics. The COVID pandemic and multi-country Mpox (monkeypox) outbreaks are just two examples.
But there is very little scientific evidence that would give a clear picture of how fast and how often infectious diseases spread across countries. A key challenge for creating global disease data is the scattering of information. Low-income countries have limited statistical capacity to keep track of disease outbreaks. And datasets from various countries are difficult to combine due to different reporting standards.
To get a better global picture of infectious disease patterns, our team of economists and statisticians set out to create a global dataset. We collected data from the World Health Organization’s “Disease Outbreak News” and Coronavirus Dashboard.
Disease Outbreak News contains information from health authorities and research networks about confirmed acute public health events or events of concern. They include any outbreak or rapidly evolving situation that may have negative consequences for human health and requires immediate assessment and action. Unfortunately, this information is mostly unstructured and is not produced for statistical purposes. It can’t be directly used for systematic analysis. To make such structured statistical information available, we relied on web-scraping techniques to extract when and where a particular infectious disease occurred.
Statistical restructuring of this data allowed us to paint a systematic picture of the spread of infectious diseases. Our findings are based on the statistical probabilities of disease outbreak, not the virulence. We found that most disease outbreaks were reported in African countries. High-income countries were significantly affected too – particularly during pandemics like the 2009 “swine flu” outbreak and COVID-19.
The presence of such pandemic events highlights the need for policy preparedness. By analysing how disease outbreaks spread across countries, health authorities can develop targeted measures to contain future outbreaks.
What the data shows
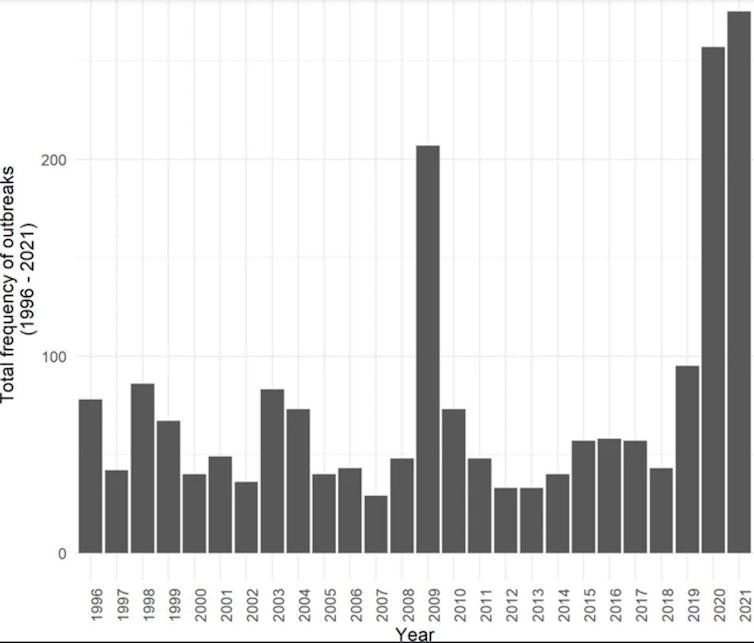
Our dataset contains information on over 2,000 public health events that have occurred in 233 countries and territories since 1996. These outbreaks involve 70 different infectious diseases. The figure below shows when those occurred.

No clear trend over time is visible: there are around 50 public health events that trigger a Disease Outbreak News announcement each year. Instead of an increase over time, temporary surges are visible in the context of the 2009 “swine flu” influenza A(H1N1) pandemic and COVID-19. These diseases were essentially global and accordingly triggered Disease Outbreak News in many countries.
Our data recorded only one disease outbreak announcement per country, year and disease. For example, COVID-19 in China is recorded once in 2019, once in 2020, and once in 2021. This means the data doesn’t show how serious a disease outbreak was, nor how many people were affected in one country. Instead, the data for each year reflects how many different diseases were recorded, and how many different countries were affected. This is useful from a policy perspective since all recorded outbreaks call for immediate action.
COVID-19 is the most prominent disease in the outbreak news announcements. Almost one third of the 2,227 health events recorded in our dataset concern COVID-19, closely followed by influenza cases of zoonotic nature. Cholera is the third-most recorded infectious disease, but much less frequent than COVID-19 or influenza (about 170 recorded outbreak news).
Countries with the highest records of infectious disease outbreaks are mostly large (in terms of size and population), close to the Equator, and have low or modest income levels. Africa accounts for almost 40% of recorded cases of outbreaks. And it’s home to the two most outbreak-prone countries: the Democratic Republic of Congo and Nigeria each recorded over 40 disease outbreaks since 1996.
High income levels don’t prevent outbreaks. Wealthier countries were affected despite their substantial financial means for public health measures. The US recorded the third highest number of disease outbreaks. France and the UK had over 20 unique disease outbreaks each.
How the data is useful
Our analysis shows that there is no clear global increase of infectious disease outbreaks over time. We rather observe temporary waves of single diseases that affect many countries. Public health systems hence need to quickly assess how threatening a disease outbreak in another country is and what measures should be taken to prevent their spreading across and within countries.
Effective public health responses will depend on how diseases usually spread geographically. And our dataset offers rich potential to analyse such spatial disease transmission.
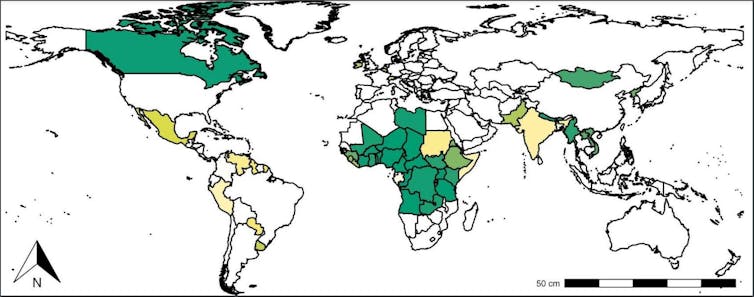
Disease outbreaks are geographically related. Our statisticians tested whether disease outbreaks are randomly scattered around the globe or not. The results are depicted in the map below. A country that is coloured in a darker shade of green is more likely to contribute to cross-country spreading of diseases. Outbreaks are clustered geographically. These clusters – Northern America, Africa and South-/East Asia – provide a first glimpse of international disease transmission patterns.
But more research will be needed to better understand pandemic contagion pathways, which likely differ by disease. Our dataset will be a valuable resource for such analysis.

Policy preparedness
A better understanding of how different infectious diseases spread across countries can help establish early warning mechanisms and response protocols. One could estimate how likely it is that an outbreak of a disease in one country will spread to another country and over what time period.
Policymakers could even put protocols in place where a certain disease transmission likelihood triggers a response measure (such as rolling out vaccines, or travel warnings).
Similarly, international organisations could use such spatial pandemic models to infer which other countries would most likely be affected by an outbreak, and focus resources accordingly. Chaotic health resource allocations, as was the case of the COVID-19 masks and vaccines, could thus be avoided.
Konstantin M. Wacker collaborates in a research group that received funding from the ENLIGHT network. His investment portfolio includes minor shares of health companies (details under "disclosure" on his private website).
Inmaculada Martínez-Zarzoso and Juan Armando Torres Munguía do not work for, consult, own shares in or receive funding from any company or organization that would benefit from this article, and have disclosed no relevant affiliations beyond their academic appointment.
This article was originally published on The Conversation. Read the original article.


