The Dec. 13 inflation report seems to have overshadowed Oracle (ORCL), which hit multimonth highs this morning following the software stalwart's better-than-expected earnings report.
Investors broadly are talking about the lower-than-expected inflation report for November.
That report helped kickstart a rally on Wall Street, although some of those morning gains have faded. We’re seeing similar action in Oracle stock, too.
At one point this morning, the shares were up more than 5%. At last check the stock was off 1%.
The rally came after the company beat on earnings and revenue expectations. Revenue grew 18.5% year over year.
With Tuesday’s rally, Oracle stock hit its highest level since January and helped keep the “old tech” trade in play.
That’s also as others like International Business Machines (IBM) — one of this year’s best tech trades — hit new 52-week highs on Tuesday.
Others, like Amazon (AMZN), continue to flounder.
Trading Oracle Stock on Earnings

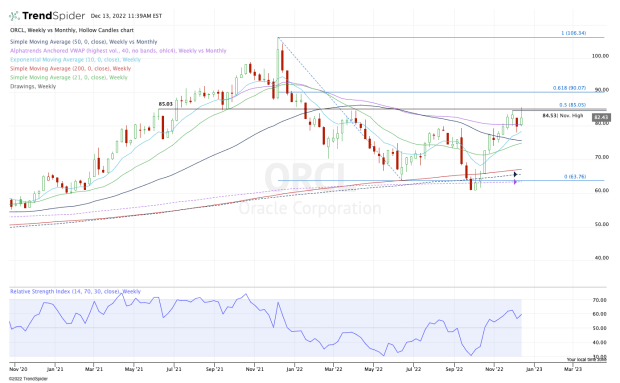
Chart courtesy of TrendSpider.com
Oracle stock is trending above all its daily and weekly measures, the latter of which is displayed above.
Today’s action is both inspiring and deflating at the same time. It’s inspiring because Oracle is hitting a multiquarter high. It’s deflating because the sellers are rejecting it at a key area.
The shares are trying to hurdle last month’s high, a key support/resistance pivot and the 50% retracement. All three levels come into play near $85.
If the bulls can muster enough strength to close Oracle stock above $85, the move opens the door up to the 61.8% retracement near $90. Above that and longer-term bulls will almost surely try to push for $100.
On the downside, closing below $85 keeps the rally contained.
More specifically, keep an eye on $80. A break of this level puts Oracle stock below this week’s low, as well as the weekly VWAP measure.
If it loses the 10-week moving average as support, it opens the door down to $75, then $73 and $70.
Despite today's anticlimactic reaction to earnings, Oracle’s chart reflects a lot of positives.
Keep $85 in mind on the upside. On the downside, as long as it remains above the 10-week moving average, the chart looks healthy.


