What a difference one quarter makes. After falling about 3% early in Friday's session, shares of Oracle (ORCL) are now up after the software major reported earnings.
The company reported in-line revenue and missed on profit forecasts. While the cloud outlook impressed, investors are having a hard time bidding up the stock.
It hasn’t been a very good run for Oracle. The stock was hitting new 52-week highs in December, but at last month’s low it was down about 34% from the highs.
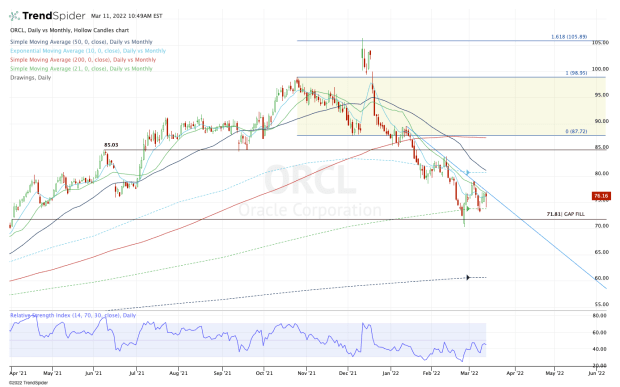
Currently, the shares are still down about 30% from that mark and are encroaching on this month’s low of $73.11.
While some of the large- and megacap tech stocks — particularly those considered value stocks — have held up much better than their growth-stock counterparts, it still hasn't been an easy ride.
Let’s look at the chart to see what key levels stand out here.
Trading Oracle Stock

Chart courtesy of TrendSpider.com
When Oracle stock rallied in December, it finally cleared the $100 mark and rallied to the 161.8% extension up near $106.
Once that price target was satisfied, the Oracle could hold $100. Instead, the shares gapped below this mark just a week after the big upside rally.
The stock climbed back to $100 and was harshly rejected. Oracle stock fell in 10 straight sessions.
It’s been quite the skid since, with Oracle falling in seven of the past 10 weeks. Two of those weekly gains were less than 0.4%.
From here, I want to see whether Oracle can avoid breaking this month’s low and can continue to hold the 21-month moving average.
If it can do that and build above $75, it opens the door for a potential weekly-up rotation and a move back over the 10-day and 21-day moving averages.
Perhaps more important, the stock would avoid making new lows after earnings and get back above downtrend resistance (blue line).
In this scenario, it would put the 10-week, 10-month and 50-day moving averages in play, near $80 to $81.
On the downside, a break and close below the March low would put the February low on the table near $70.
A move and close below $70 could ultimately open the door to the 200-week and 50-month moving averages. While they are rising, they currently come into play near $61 to $63.


