Nordstrom Inc. (NYSE:JWN) shares are trading higher Wednesday after the company reported better-than-expected fourth-quarter EPS and sales results. Nordstrom reported quarterly earnings of $1.23 per share, beating the analyst consensus estimate of $1.02. Nordstrom also reported quarterly sales of $4.38 billion, beating the analyst consensus estimate of $4.35 billion.
Nordstrom was up 37.83% at $26.94 Wednesday afternoon.
See Related: Why Nordstrom Shares Are Rising
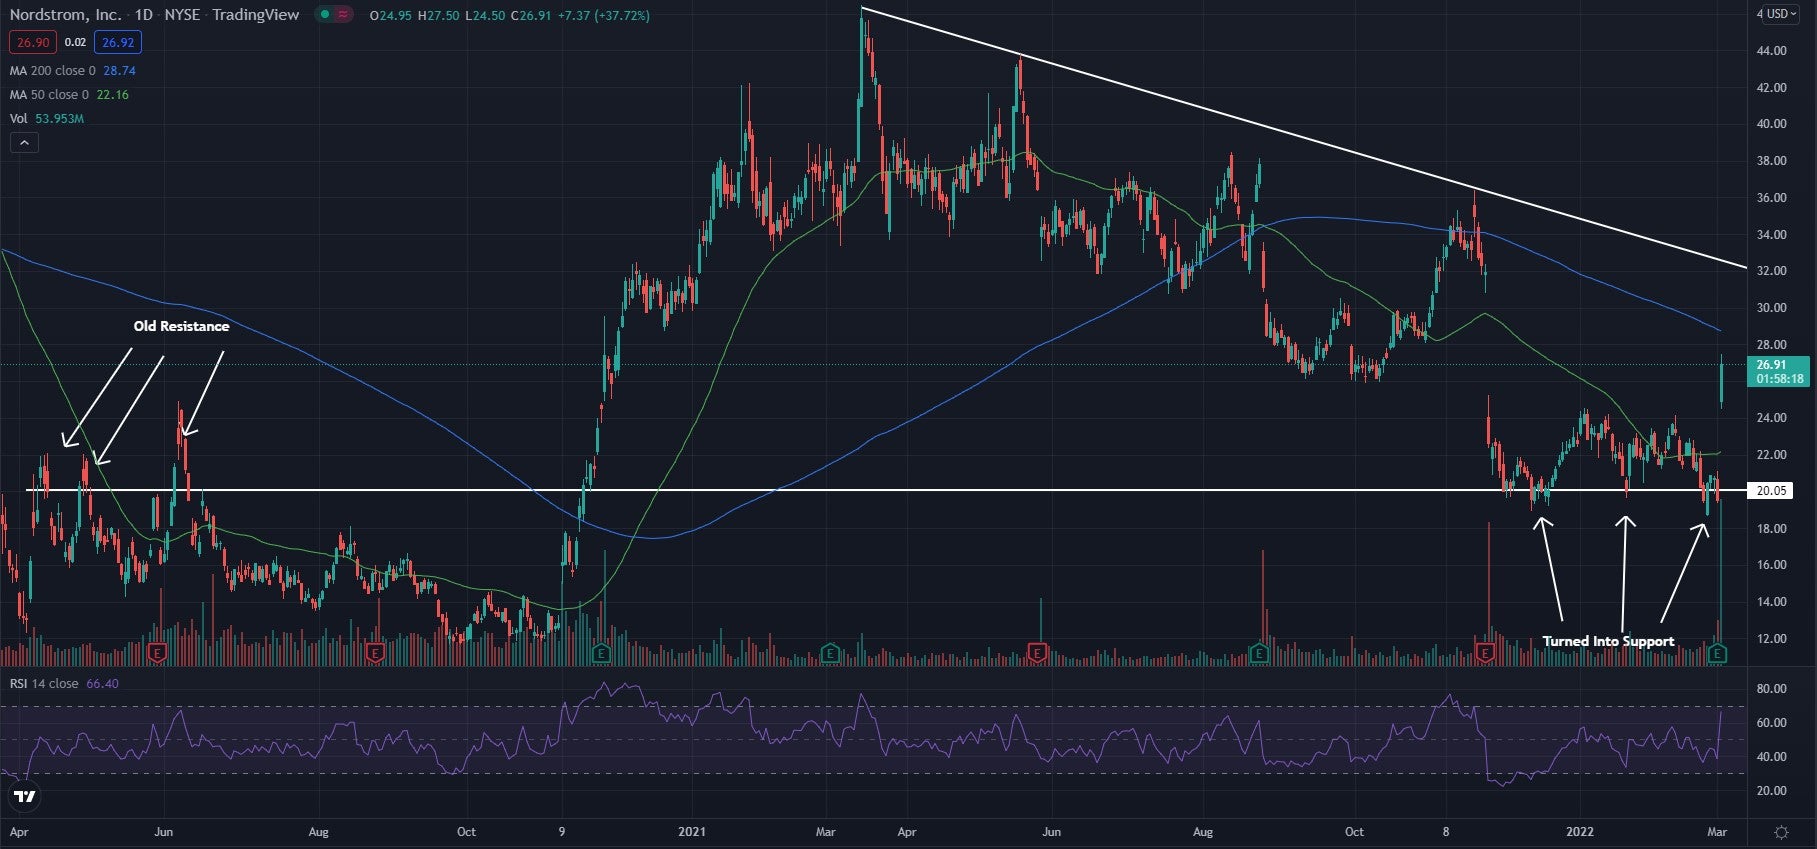
Nordstrom Daily Chart Analysis
- Shares were recently able to bounce off support in what traders call a descending triangle pattern and shot higher after the earnings announcement. Support was found near the $20 level and resistance can be found by connecting the highs on the chart.
- The stock is trading above the 50-day moving average (green) but below the 200-day moving average (blue), indicating the stock looks to be consolidating. The 50-day moving average may hold as an area of support while the 200-day moving average may act as an area of resistance.
- The Relative Strength Index (RSI) shot higher Wednesday and now sits at 66. This shows that a large amount of buyers moved into the market following the earnings announcement. If the RSI can hold above the middle line, the stock may start uptrending for a while.
What’s Next For Nordstrom?
The descending triangle pattern is considered to be a bearish pattern, but with solid earnings the stock looks like it could be on the rise. If the stock can continue to rise and break above the resistance level, the bearish pattern may be nullified.
Bullish traders are looking to see the RSI hold above the middle line and for the stock to begin to form higher lows. Bulls would like to see a break over the resistance level and hold above it.
Bearish traders are looking to see the price and the RSI start to fade back lower oce again. Bears are then looking for a break below the $20 level for the pattern to be confirmed and for the stock to likely see a strong bearish move.