MicroStrategy, Incorporated (NASDAQ:MSTR) was surging more than 10% higher on Thursday in tandem with Bitcoin (CRYPTO: BTC), which was trading almost 5% higher despite the S&P 500 struggling to trade flat.
The business intelligence and cloud-based services company, which holds about 129,218 Bitcoins according to its first-quarter earnings release, has been trading in a steep downtrend since March 29.
In an interview on Yahoo Finance Live on Thursday, MicroStrategy CEO Michael Saylor said he expects Bitcoin to reach more than a million dollars in the future and that he believes the crypto is the currency of the future.
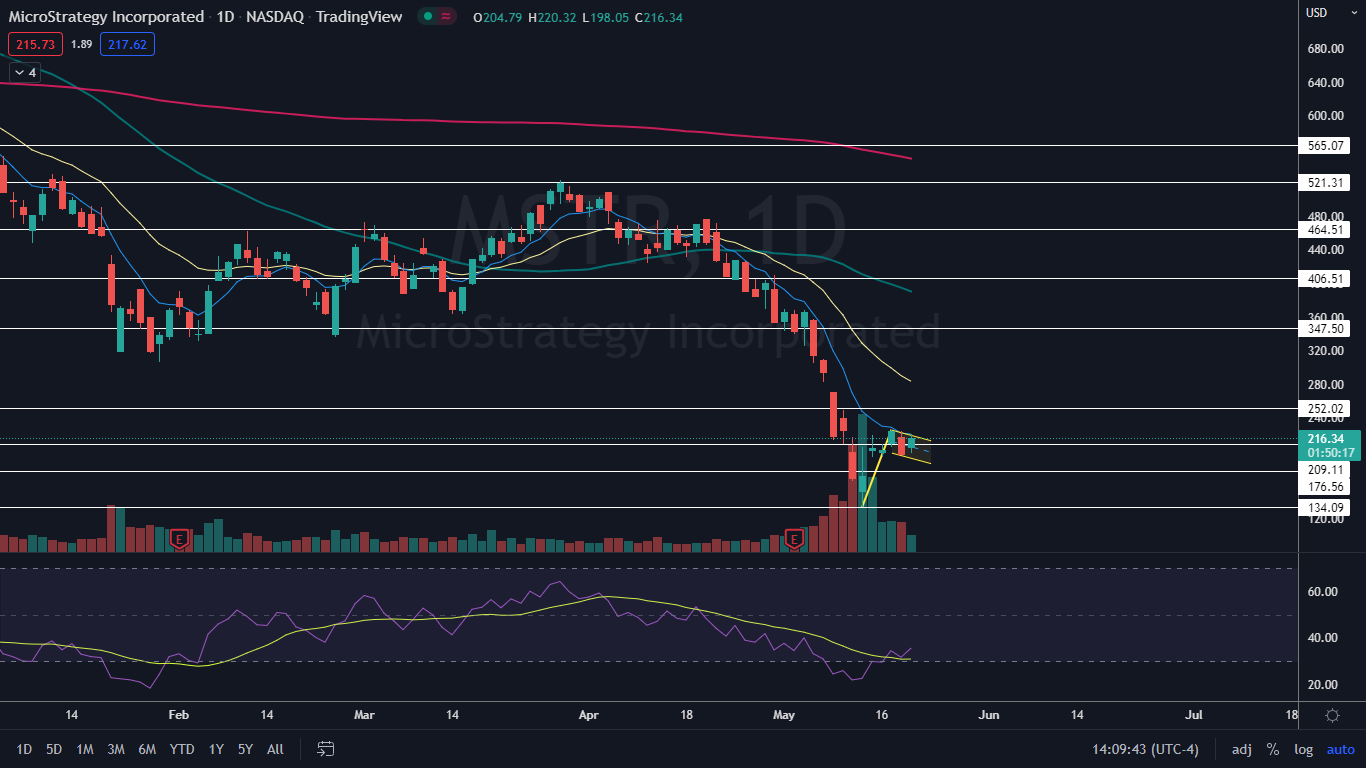
Bitcoin has a lot of work to do to reach its Nov. 10 all-time high of $69,000 and MicroStrategy is currently trading down more than 80% from its all-time high of $1,315 printed on Feb. 9, 2021. The stock has settled into a bull flag, however, and if the pattern is recognized, MicroStrategy could be in for a 70% move to the upside.
The bull flag pattern is created with a sharp rise higher forming the pole, which is then followed by a consolidation pattern that brings the stock lower between a channel with parallel lines or into a tightening triangle pattern.
For bearish traders, the "trend is your friend" (until it's not) and the stock may continue downwards within the following channel for a short period of time. Aggressive traders may decide to short the stock at the upper trendline and exit the trade at the lower trendline.
- Bullish traders will want to watch for a break up from the upper descending trendline of the flag formation, on high volume, for an entry. When a stock breaks up from a bull flag pattern, the measured move higher is equal to the length of the pole and should be added to the lowest price within the flag.
- A bull flag is negated when a stock closes a trading day below the lower trendline of the flag pattern or if the flag falls more than 50% down the length of the pole.
Want direct analysis? Find me in the BZ Pro lounge! Click here for a free trial.
The MicroStrategy Chart: MicroStrategy’s bull flag was formed between May 12 and Thursday, with the pole created on the first four days of that timeframe and the flag forming over the trading days since. The measured move, if the pattern is recognized, could cause MicroStrategy to soar up to the $335 level.
- MicroStrategy reversed course into a likely uptrend on May 18, when the stock printed a higher low at the $195.54 mark, which negated the downtrend. If MicroStrategy breaks up bullishly from the bull flag, the stock will print a higher high above $225.96 to confirm the new trend.
- Technical traders may have seen the bounce to the upside on the way because on May 12 MicroStrategy’s relative strength index (RSI) reached 22%. When a stock’s RSI falls below the 30% level it becomes oversold, which can be a buy signal for technical traders. The stock’s RSI is still relatively low at about 35%, indicating there is a lot of room to the upside.
- MicroStrategy has resistance above at $252.01 and $347.50 and support below at $209.11 and $176.56.

See Also: Imagine A World Where You Can Access Both Traditional Assets And Crypto Assets From The Same Account
Photo: phive via Shutterstock


