Microsoft (MSFT) stock is working on its sixth straight monthly rally.
In other words, after declining in three straight quarters in 2022, the stock has posted a gain every month so far this year.
But the shares have faded from the recent high, falling more than 6%. That leaves Microsoft stock up just 0.4% for June with just a handful of days left to the end of the month and quarter.
The stock's 37.5% rise this year is impressive, although it does lag Apple’s (AAPL) gain of 43%. (These are the only two companies with market caps exceeding $2 trillion.)
Further, Microsoft’s year-to-date performance lags all of FAANG, except for Alphabet (GOOGL) (GOOG).
Don't Miss: Alphabet Has Helped Drive the Nasdaq; Here's Where to Buy the Dip
That said, the stock recently logged an all-time high, so it’s not exactly a disappointment for the bulls.
Now that the stock is trying to avoid its fifth daily decline in the past six sessions, let’s take a closer look at Microsoft.
Trading Microsoft Stock

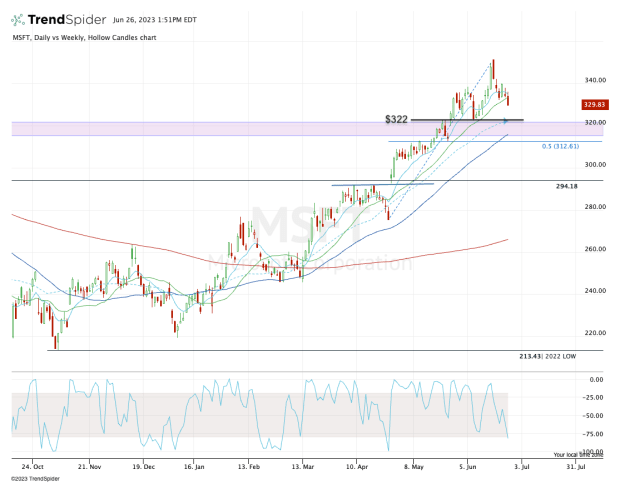
Chart courtesy of TrendSpider.com
Microsoft stock saw a three-day 6% correction last week, momentarily found support, and is now rolling over. In the process, the shares are breaking below the 10-day and 21-day moving averages.
These short-term moving averages tend to be support for stocks in a strong uptrend. Just because a stock loses these measures doesn’t mean it’s bearish, but it does mean the short-term trend is likely broken.
Notice how those two measures have guided Microsoft higher for months.
With the stock breaking below these marks now, the bulls need to see whether it can reclaim these measures or perhaps they need to wait for lower prices to buy a more attractive dip.
Don't Miss: Tesla Win Streak Might Snap; Here's 2 Buy-the-Dip Spots
If it’s the latter, keep a close on the low-$320s — specifically near $322.
That level was prior resistance and most recently served as support, while the 10-week moving average also comes into play at this mark.
If Microsoft continues to pull back, the $312 to $315 area is of interest, which marks the 50% retracement of the current rally and the rising 50-day moving average.
Should all these measures fail, the $295 to $300 zone could come into play.
So should investors buy the dip? Microsoft stock has been one of the strongest megacap stocks in the market. Until the trend fails, traders should continue to respect it.


