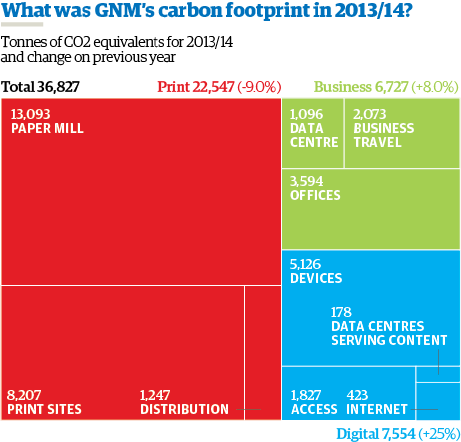
In the financial year to March 2014, our carbon footprint emissions were 36,800tCO2e – a reduction of less than 1% on the previous year (37,000tCO2e). Our digital carbon emissions now account for more than 21% of our overall footprint. This year, for the first time, they have overtaken emissions associated with business activities (18%). The paper mills are still our greatest single source of emissions, but print emissions have continued to fall and are down to 61% from 67% in 2012/13.
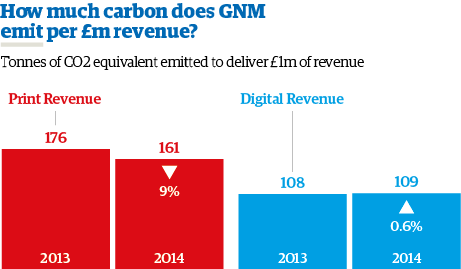
So that we can compare digital and print carbon efficiency, we monitor emissions per £1m of revenue. In the year from 1 April 2013 to 31 March 2014, carbon footprint was 109tCO2e per £1m digital revenue. Our paper carbon footprint was 160tCO2e per £1m of paper revenue. Print efficiency increased by 9% while digital carbon efficiency fell by half a per cent:
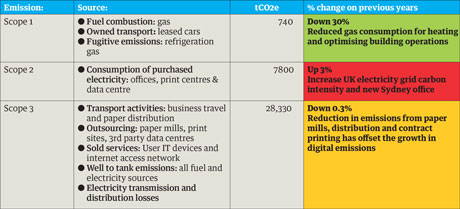
In line with UK mandatory carbon reporting, we have also calculated our emissions by GHG Protocol Scopes:
Digital carbon footprint: 7,554 tCO2 equivalent
Using the digital carbon model, designed through the Sympact project we have calculated that carbon emissions from our digital operations increased by 1510 tCO2e or 25% compared to the 2012/2013 figure. This is the result of our growing online audience.
Digital carbon efficiency fell by 0.6% per £1m of digital revenue (109 tCO2e per £1m) and emissions per page view increased by 7% to 0.106 gCO2e, which follows a similar rise in 2012/2013.
As more people access news on desktop computers and mobile devices, we have to send and receive considerably more data. People are spending more time engaging with and reading our content and there is a growing demand for video, so file sizes are larger. All of this drives demand for energy consumption through devices, data centres and the internet. And, as we now have a presence in Australia and the US, our carbon efficiency has fallen because of the higher carbon intensity of electricity generation in both countries. But, more people are choosing to access news on lower-energy devices such as tablets and smartphone. This shift, supported by our new, responsive mobile products, means that the growth in emissions has been reduced.
Emissions from our own data centres fell by 9% as we consolidated old disks and turned off a number of other devices. We are continuing to review our entire data centre and use cloud-based third party servers to improve energy efficiency. Our data centres account for 2% of our digital emissions. We still have work to do to improve our understanding of digital carbon efficiency and find new ways in which we can mitigate the emissions we produce.
Print carbon footprint: 22,547 tCO2 equivalent
Emissions from our paper operations reduced by 9% – over 2200CO2e- in the financial year ending March 2013. There was a 9% reduction in carbon emissions per £1m of paper revenue to 160tCO2e. We have also made improvements to the total emissions per paper copy, which fell by 10% to 8gCO2e. As a result, emissions per printed page reduced by 1% to 0.138 gCO2e per page, compared to 106 gCO2e per digital page.
We have improved energy efficiency at our print centres. The changes in London and Manchester include better management of lighting, heating, cooling and ventilation. We have also reduced the number of pages we print, which means that, last year, we consumed a lot less paper and reduced emissions at our paper mills by 11%. Polestar, who are contracted to print our magazines, have been making significant capital investment and this has resulted in emission reductions of 17% compared to the previous year.
Business and editorial carbon footprint: 6,727 tCO2 equivalent
Overall, we saw an increase of 8%, or 500 tCO2e, in our business and editorial carbon footprint. This is mostly due to an increase in international flights, the opening of our new office in Australia, and changes in UK electricity grid carbon intensity.
Emissions at our Kings Place head office rose, although we reduced the amount of energy we used as a result of weekly electricity reporting and improved maintenance and servicing of the building. The workplace team also improved monitoring of the data centre, to address failures and monitor impacts of initiatives such as air flow improvements, to reduce demands on cooling.
We made significant improvements to our IT hardware and systems. We shut down 11 old storage servers and migrated services to a new, more power-efficient set up. We also introduced a new digital network infrastructure in Kings Place, which is more reliable and energy efficient.