Yesterday after the close, Johnson & Johnson (JNJ) announced it would end talc-based baby-powder sales globally next year.
Given that the health-care giant stopped selling it in the U.S. and Canada in 2020, that news likely isn’t too surprising.
The shares have seen selling pressure over the two sessions; they were down about 3.2% at today’s low. While that's not exactly a harrowing decline, it is noteworthy that J&J hit its lowest stock price since early March.
While most stocks are enjoying a nice run to the upside, Johnson & Johnson has not.
Short of a powerful reversal this afternoon, the stock is set to lock in its sixth weekly decline in the past seven weeks.
A few weeks ago the shares moved lower when J&J beat earnings expectations but trimmed its full-year guidance. Although the stock initially bounced back from that decline, the rally was short-lived and it's moved lower.
Now that the stock is at its lowest price in months, let’s look at where it may be an outright steal.
Trading Johnson & Johnson Stock
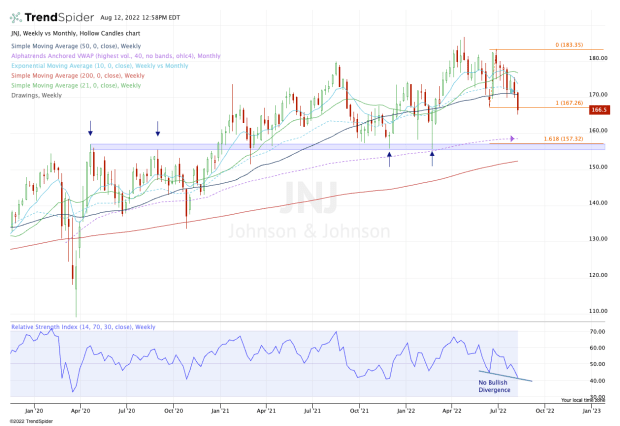
Chart courtesy of TrendSpider.com
Last week, J&J stock closed above the 50-week moving average and support near $170. But it broke below these measures this week and has tumbled through the second-quarter low at $167.26.
That’s a quarterly-down rotation -- and it probably has traders avoiding J&J on the long side as there’s been far more favorable price action in tech — like with Apple (AAPL) and Amazon (AMZN), among many others.
When we zoom out with the weekly chart, there’s a clear demand zone in the mid-$150s.
It’s not hard to see that this area was resistance in 2020, then support throughout 2021 and in the first quarter of 2022. It hasn’t been retested since February, but it was strong support at the time.
In this area, we begin to find other potential support levels as well.
That includes the monthly VWAP measure near $158, as well as the 200-week moving average down near $152.50. Around $157.30 is the 161.8% downside extension too, adding another level of interest in this zone.
Does this mean J&J will find support here? No! In fact, we may not even see this level tested.
But it’s an area of the charts with a lot of interest and plenty of prior demand. If the bulls like this name and it dips to this area, it’s a zone in which they may want to consider going long.
Further, the shares will yield almost 3% if they get to this area.
Lastly, keep an eye on $167.25 on the upside. A close back above that level could kickstart a rebound back to the $170 area, as well as the 50-week and 10-month moving averages.