Johnson & Johnson (NYSE:JNJ) shares are trading higher Friday after the company agreed to finalize a proposed $26 billion settlement resolving more than 3,000 lawsuits, mainly by state and local governments, seeking to hold it and three other companies responsible for the opioid abuse crisis. The other companies are distributors McKesson Corp (NYSE:MCK), AmerisourceBergen Corp (NYSE:ABC) and Cardinal Health Inc (NYSE:CAH).
Johnson & Johnson was up 4.97% at $166 Friday afternoon at publication.
See Also: Drug Distributors, JNJ Agree To Settle $26B Opioid Lawsuits
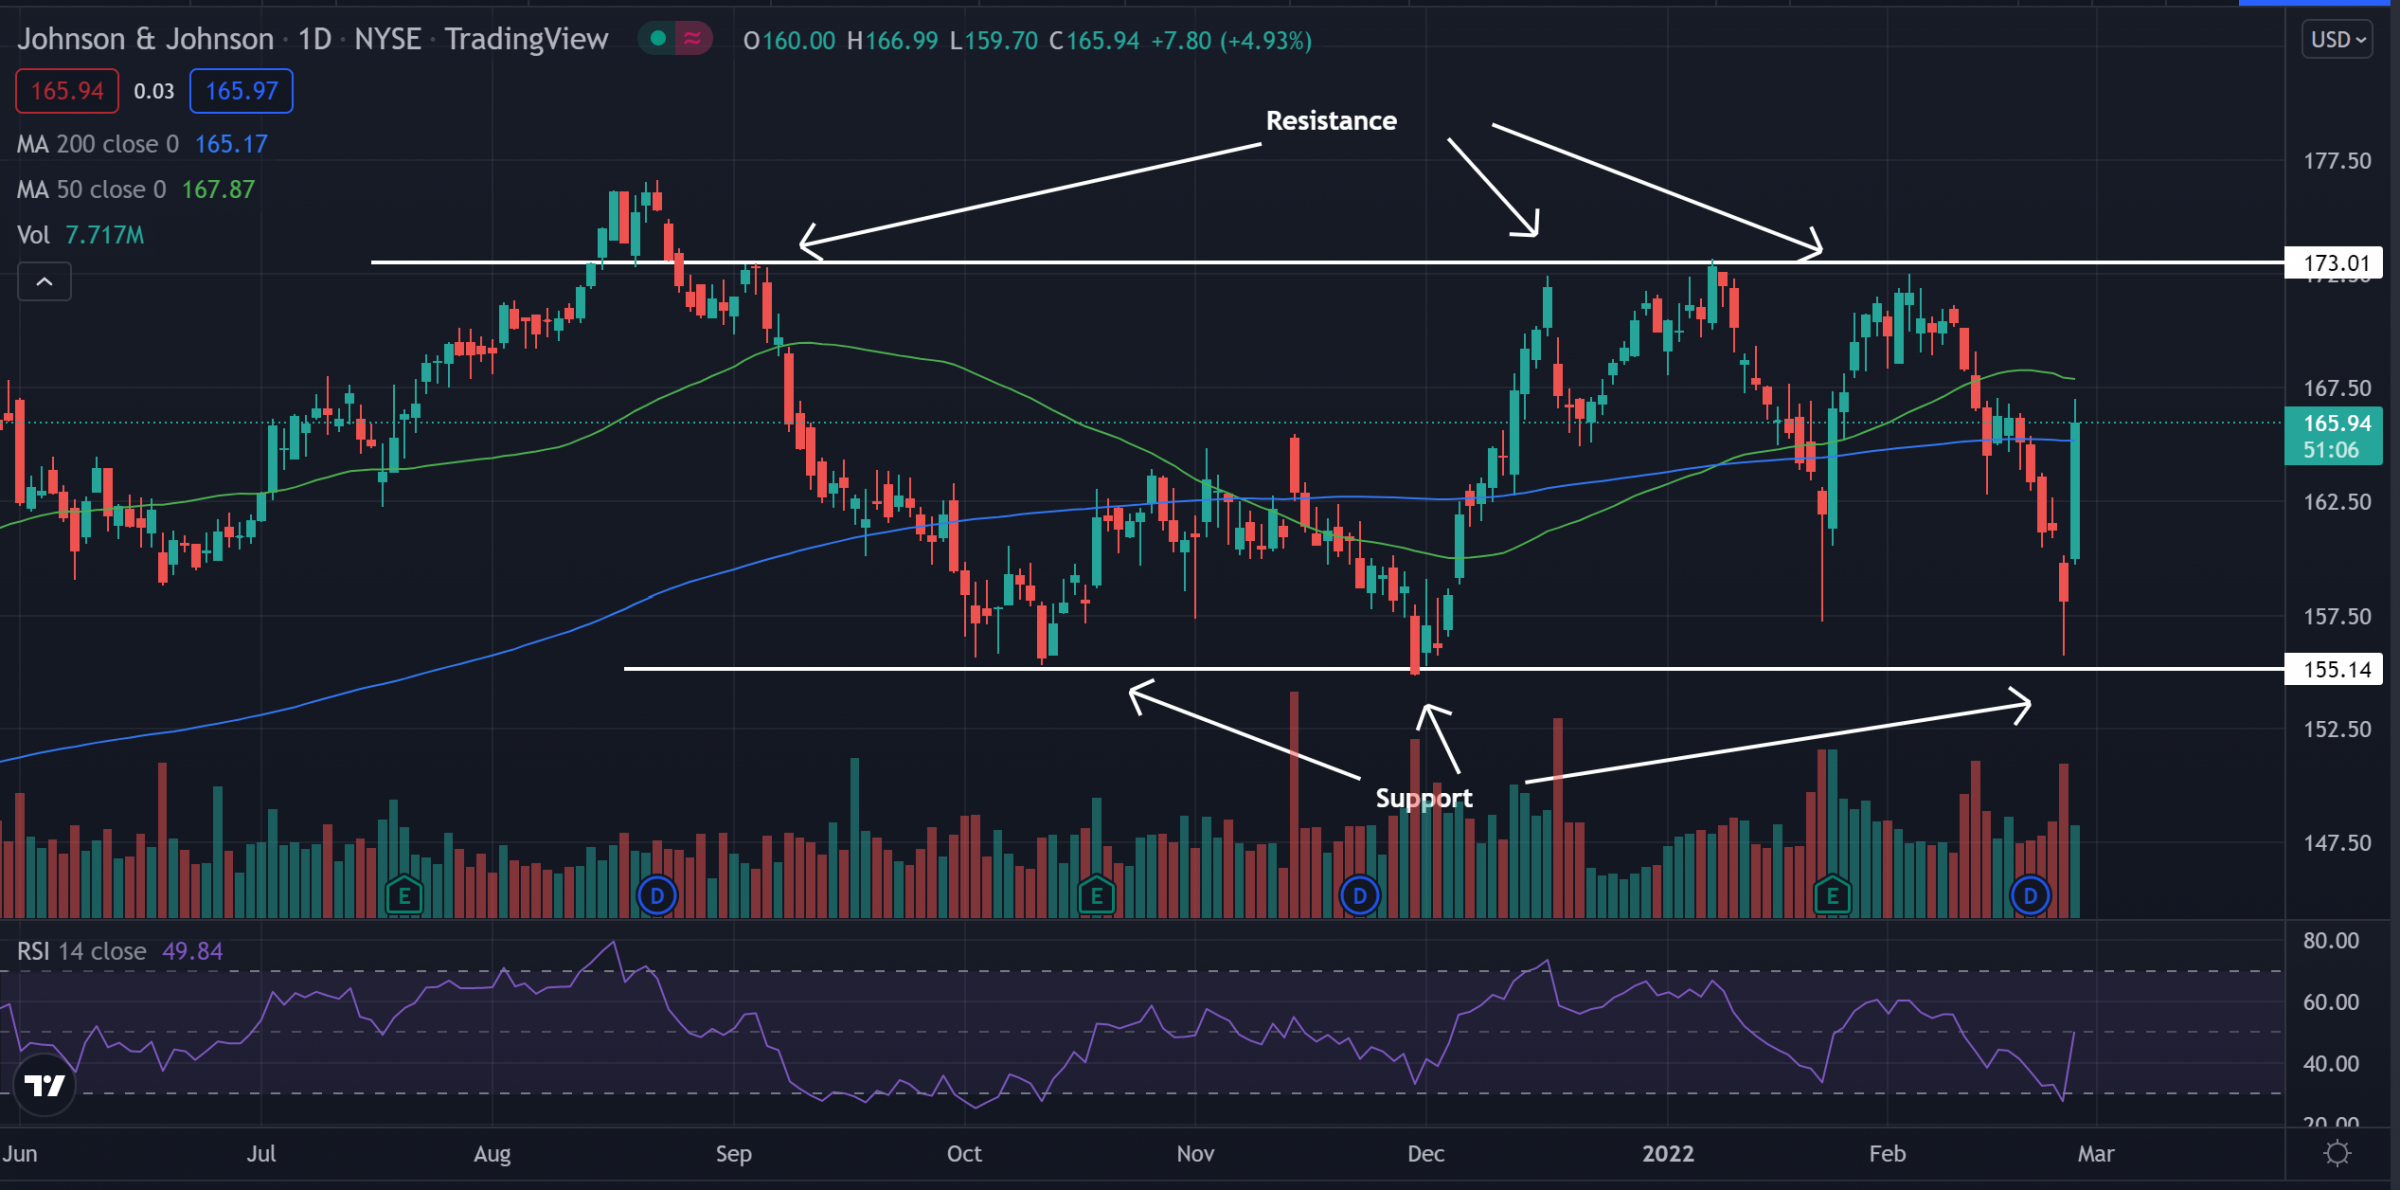
Johnson & Johnson Daily Chart Analysis
- The stock recently bounced off support in a sideways channel and has been pushing higher, now nearing the resistance level of the channel. Support was found near the $155 level as this has been an area where the stock has struggled to cross below in the past and has always bounced back. The $173 level has been an area where the stock has been unable to cross above, acting as an area of resistance. These areas will continue to hold until one is broken.
- The stock trades below the 50-day moving average (green) but trades above the 200-day moving average (blue), indicating the stock is in a period of consolidation. The 50-day moving average may act as a place of resistance, while the 200-day moving averages may hold as support.
- The Relative Strength Index (RSI) has been steeply falling the past couple of weeks and now sits at 30. This shows the RSI is on the border of the oversold region and the stock is seeing much more selling pressure than it is buying pressure.
What’s Next For Johnson & Johnson?
The stock has been pushing higher since it was able to bounce off the support level. If this bullish momentum continues, it may see a breakout above resistance and make a further bullish move in the future. Bullish traders want the stock to be able to cross above the 50-day moving average, form higher lows and cross the $173 level. Bulls want the stock to hold this as an area of support to potentially see another bullish move in the future. Bearish traders want the stock to start falling back toward the $155 level before crossing below and holding the area as a level of resistance.
Photo: Bob Williams from Pixabay