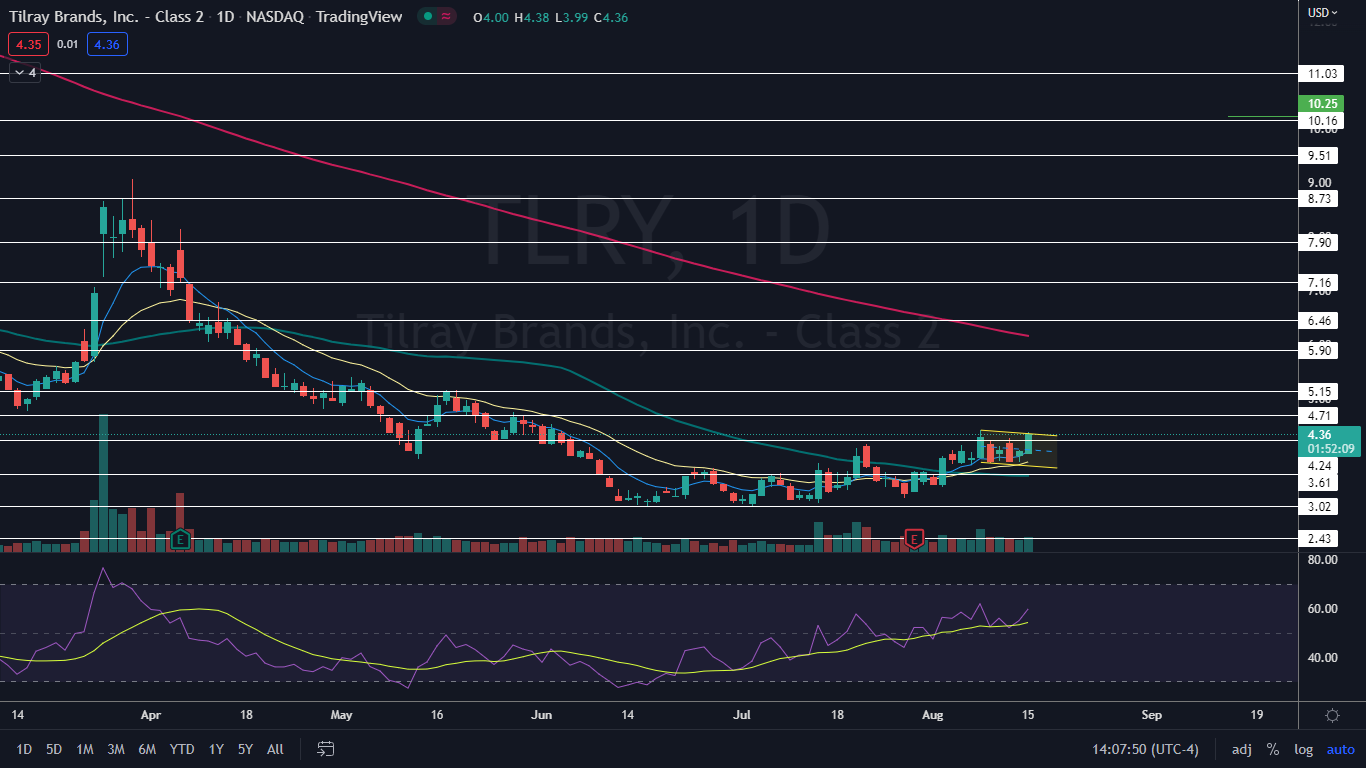
Tilray Brands, Inc (NASDAQ:TLRY) was spiking up over 6% on Monday, attempting to break up from a falling channel on the daily chart, which the stock began trading in on Aug. 8.
Within the falling channel pattern, Tilray has been making a series of lower high and lower lows in a downtrend on the daily chart. The pattern is bearish for the short term, but can be bullish down the road.
For bearish traders, the "trend is your friend" (until it's not) and the stock is likely to continue downwards. Aggressive traders may decide to short the stock at the upper trendline and exit the trade at the lower trendline.
Bullish traders will want to watch for a break up from the upper descending trendline, on high volume, for an entry. When a stock breaks up from a descending channel, it's a powerful reversal signal and indicates a rally is likely in the cards.
Want direct analysis? Find me in the BZ Pro lounge! Click here for a free trial.
The Tilray Chart: Although Tilray is trading in a slight downtrend within the falling channel on the daily chart, on the weekly chart, the stock has been trading in an uptrend since July 5. On the daily chart, Tilray formed its most recent lower high on Aug. 11 at $4.27 and the stock printed its most recent low at the $3.82 mark on Aug. 9.
- The move higher on Monday was taking place on higher-than-average volume, which indicates there’s currently a high level of interest in the stock. At press time, about 31.5 million shares of Tilray had exchanged hands, compared to the 10-day average of 29.85 million.
- If Tilray closes the trading day near its high-of-day price, the stock will print a bullish Marubozu candlestick, which could indicate higher prices will come on Tuesday. If that happens, Tilray will break up bullishly from the falling channel pattern. Traders will want to see higher-than-average volume come in on the break up from the upper descending trendline.
- If Tilray runs into a group of sellers and closes the trading day with an upper wick, the stock may trade lower and possibly form an inside bar pattern on Tuesday. If an inside bar is formed, traders can watch for a break up or down from Monday’s mother bar on Tuesday to gauge future direction.
- Tilray has resistance above at $4.71 and $5.15 and support below at $4.24 and $3.61.

See Also: Why Does This Undervalued Cannabis Stock Have An Encouraging Outlook?


