In May, the federal government formally declared an end to the COVID-19 public health emergency.
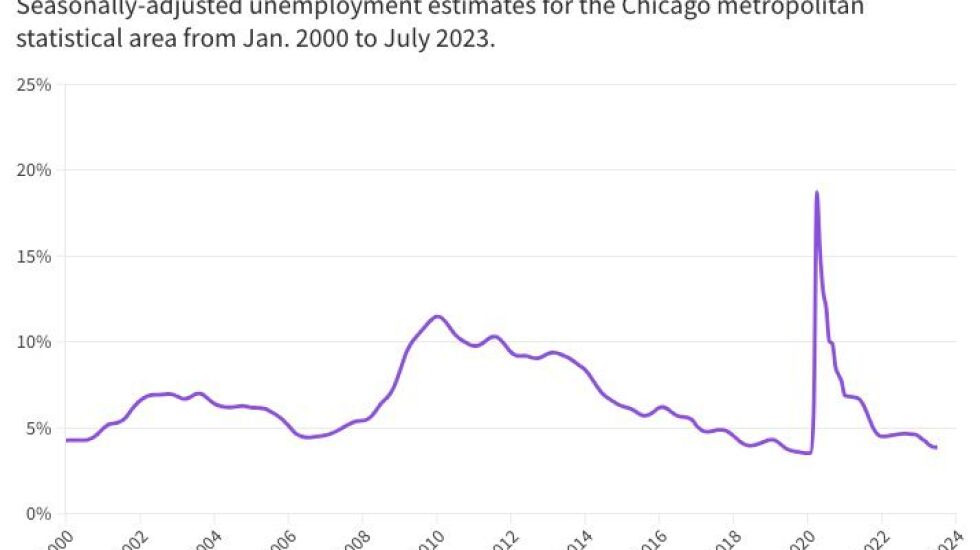
That same month, the Chicago metropolitan area registered an unemployment rate, seasonally adjusted, below 4%, according to federal government data. The last time that happened in metro Chicago was February 2020, a month before the city announced its first COVID-19 death.
The seasonally adjusted unemployment rate in metro Chicago — which includes a total of 14 counties in Illinois, Indiana and Wisconsin — remained below 4% again in both June and July.
While it might be premature to declare an end to the regional economic emergency resulting from the COVID-19 pandemic, the return of pre-pandemic unemployment levels for three consecutive months is, perhaps, a sign that the worst is behind us.
WBEZ analyzed more than 20 years of data from the U.S. Bureau of Labor Statistics and the Current Population Survey to get a closer look at the region’s elevated unemployment rates during the pandemic. We wanted to see how they compared with rates during earlier times of economic upheaval. Here’s what we learned.
Sharper spike and speedier recovery
In April 2020, metro Chicago’s unemployment rate jumped nearly 13 percentage points from the previous month to 18.72%. That’s the highest jump and the highest rate in a single month since at least 1990, the earliest date for which regional unemployment data was available on the bureau’s website.
By January 2021, the unemployment rate had dipped below 7%. By November 2021, it fell below 5%, and it dropped below 4% this May. While unemployment took more than three years to return to pre-pandemic levels, it was a shorter recovery period compared to the wake of the Great Recession.
The economic downturn resulting from the housing market crash is considered to have lasted from December 2007 to June 2009. During that window, the rise and fall of unemployment in metro Chicago was not nearly as dramatic as during the pandemic, and the higher rates dragged on for much longer. The region’s unemployment began its slow and steady ascent in August 2006, when it was 4.45%. That rate increased each month, reaching a peak of 11.49% in January 2010 — almost 3 1⁄2 years later. The rate slowly decreased over the next few years, but it didn’t dip below 5% until January 2017.

Unequal patterns among racial groups
No racial or ethnic group of workers, no age group and no gender in metro Chicago was immune to the sting of the pandemic.
But for some groups, unemployment spiked higher or lasted longer, according to a WBEZ analysis of raw data from the Current Population Survey, a monthly poll of the U.S. labor force sponsored by the U.S. Census Bureau and U.S. Bureau of Labor Statistics.
Once the rates came down, they settled into the same unequal patterns that existed before the pandemic, the analysis shows.
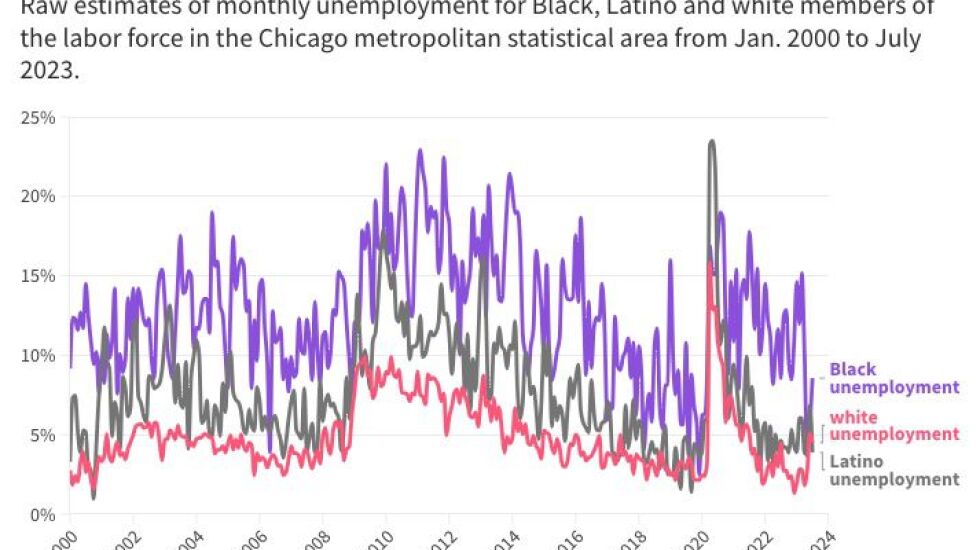
The estimated unemployment for Latinos in metro Chicago skyrocketed at the onset of the pandemic — growing in April 2020 from under 6% to more than 23%. It would top 20% again in both May and June of 2020.
Meanwhile, neither Black nor white workers saw rates top 20%. For white workers, unemployment also jumped dramatically from less than 4% to nearly 16% in April 2020. In that month, Black unemployment rose from under 9% to nearly 17%, a smaller increase than for the other groups. Black unemployment didn’t reach its peak of nearly 19% until August 2020, according to the WBEZ analysis.
However, overall unemployment estimates for white and Latino workers settled back to pre-pandemic rates much faster than they did for Black workers. White unemployment fell below 4% for three straight months by October 2021. Latino unemployment dipped below 6% for three consecutive months by November 2021. Unemployment for Black workers in metro Chicago didn’t drop below 9% for three consecutive months until July 2023.

In addition, for much of the past two decades, Black unemployment estimates in the region have typically remained at least twice as high as those for white unemployment. Since 2000, the average monthly unemployment estimate for Black workers in metro Chicago has been about 12.63%, which is comparable to the 13.19% average monthly unemployment estimate for white workers during the four months when it was at its peak — from April to July of 2020.
Since 2000, those were the only four months when white unemployment estimates topped 10% in metro Chicago. However, for Black workers, unemployment estimates have topped that mark in 209 months since 2000.
Essential workers meant lower pandemic unemployment
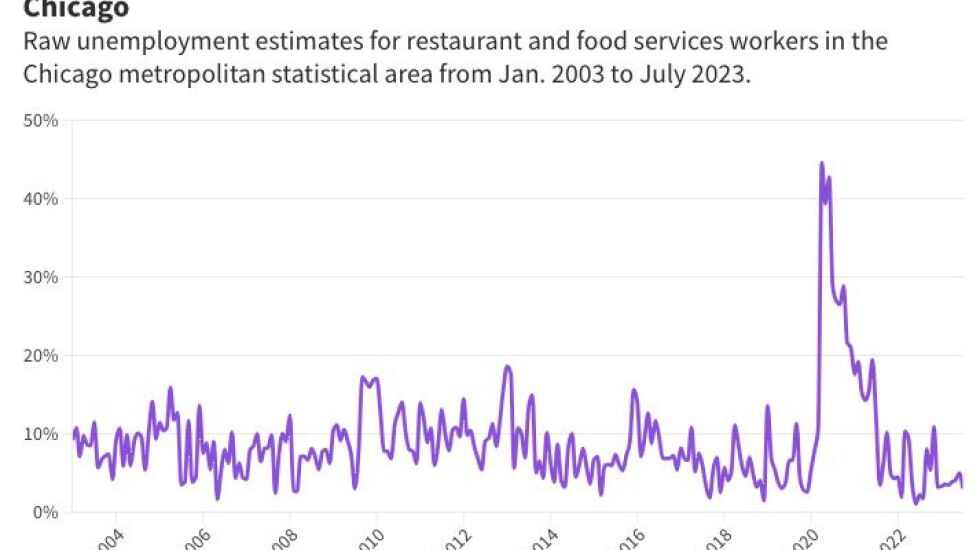
The surge in Latino unemployment may have been influenced by the large share of Latino workers in the restaurant and food services industry, one that was hit hard during the earliest months of the pandemic.
In 2020, restaurant and food services was the leading industry for Latino workers in metro Chicago. But by April 2020, unemployment for restaurant and food service workers was nearly 45%. It didn’t fall back to single digits until September 2021.
In recent months, however, the industry appears to have rebounded. Restaurant-related unemployment has been below 4% in six of the eight months between December 2022 and July 2023. And the region’s estimated number of workers in that industry topped 340,000 in July 2023, the highest such figure since June 2019.

As it might be expected in a public health crisis, unemployment for hospital workers has been much lower and far more stable. It was just 4% in April 2020. It climbed to 10% in May 2020 before falling below 7% in June 2020.
The leading industry for Black workers in 2020 was hospitals, the WBEZ analysis shows. That might have helped keep Black unemployment from growing as dramatically as it did for other groups during the first few months of the pandemic.
Alden Loury is the data projects editor for WBEZ. Follow him at @AldenLoury.


