
Moderna, Inc (NASDAQ:MRNA) spiked up almost 5% off Friday’s closing price at one point on Monday, before hitting a resistance level at the $179 level and running into a group of sellers.
The pharmaceutical company has been trading in a strong uptrend on the weekly chart since June 13, although on the daily chart the uptrend has been less consistent.
See Also: Why Is Moderna Stock Moving Higher Today?
The lack of consistency over the past two weeks has helped Moderna to form a double inside bar on the weekly chart and if the pattern is recognized, the stock could be headed for a large move higher over the coming weeks.
An inside bar pattern indicates a period of consolidation and is usually followed by a continuation move in the direction of the current trend.
An inside bar pattern has more validity on larger time frames (four-hour chart or larger). The pattern has a minimum of two candlesticks and consists of a mother bar (the first candlestick in the pattern) followed by one or more subsequent candles. The subsequent candle(s) must be completely inside the range of the mother bar and each is called an "inside bar."
A double, or triple, inside bar can be more powerful than a single inside bar. After the break of an inside bar pattern, traders want to watch for high volume for confirmation the pattern was recognized.
- Bullish traders will want to search for inside bar patterns on stocks that are in an uptrend. Some traders may take a position during the inside bar prior to the break while other aggressive traders will take a position after the break of the pattern.
- For bearish traders, finding an inside bar pattern on a stock that's in a downtrend will be key. Like bullish traders, bears have two options of where to take a position to play the break of the pattern. For bearish traders, the pattern is invalidated if the stock rises above the highest range of the mother candle.
Want direct analysis? Find me in the BZ Pro lounge! Click here for a free trial.
The Moderna Weekly Chart: Moderna formed a mother bar the week beginning Aug. 1 and spent last week and this week, so far, consolidating completely within the trading range of between $160 and $197, which has created a double inside bar pattern. The pattern leans bullish because Moderna was trading higher before forming the inside bars.
- On the daily and weekly charts, Moderna’s trading volume has been declining, which indicates consolidation. Low trading volume is often followed by a sharp influx in volume and traders can watch for Moderna to eventually break up or down from the mother bar on higher-than-average volume to indicate the pattern was recognized.
- Moderna’s eight-day exponential moving average (EMA) recently crossed above the 21-day EMA, which is bullish. The stock is currently trading about 20% below the weekly 50-day simple moving average, and if the stock can break bullishly from the double inside bar pattern and regain that level, longer-term sentiment will turn bullish.
- Moderna has resistance above on the daily chart at $179.54 and $197.72 and support below at $147.57 and $122.01.
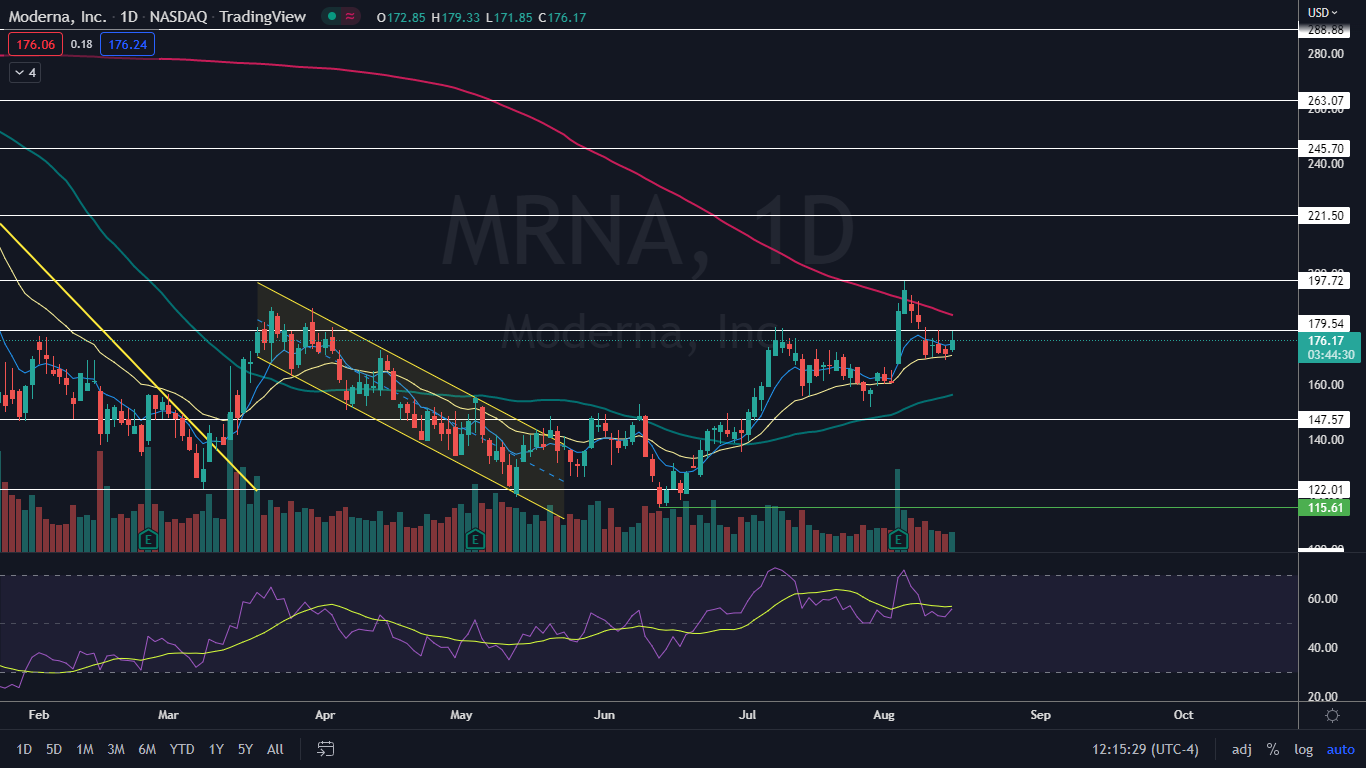
Photo: diy13 via Shutterstock