Lululemon Athletica, Inc (NASDAQ:LULU) was trading about 1.65% higher on Thursday, as the stock attempted to break up from a bull flag pattern on the daily chart.
The bull flag pattern is created with a sharp rise higher forming the pole, which is then followed by a consolidation pattern that brings the stock lower between a channel with parallel lines or into a tightening triangle formation.
For bearish traders, the "trend is your friend" (until it's not) and the stock may continue downwards within the following channel for a short period of time. Aggressive traders may decide to short the stock at the upper trendline and exit the trade at the lower trendline.
- Bullish traders will want to watch for a break up from the upper descending trendline of the flag formation, on high volume, for an entry. When a stock breaks up from a bull flag pattern, the measured move higher is equal to the length of the pole and should be added to the lowest price within the flag.
- A bull flag is negated when a stock closes a trading day below the lower trendline of the flag pattern or if the flag falls more than 50% down the length of the pole.
Want direct analysis? Find me in the BZ Pro lounge! Click here for a free trial.
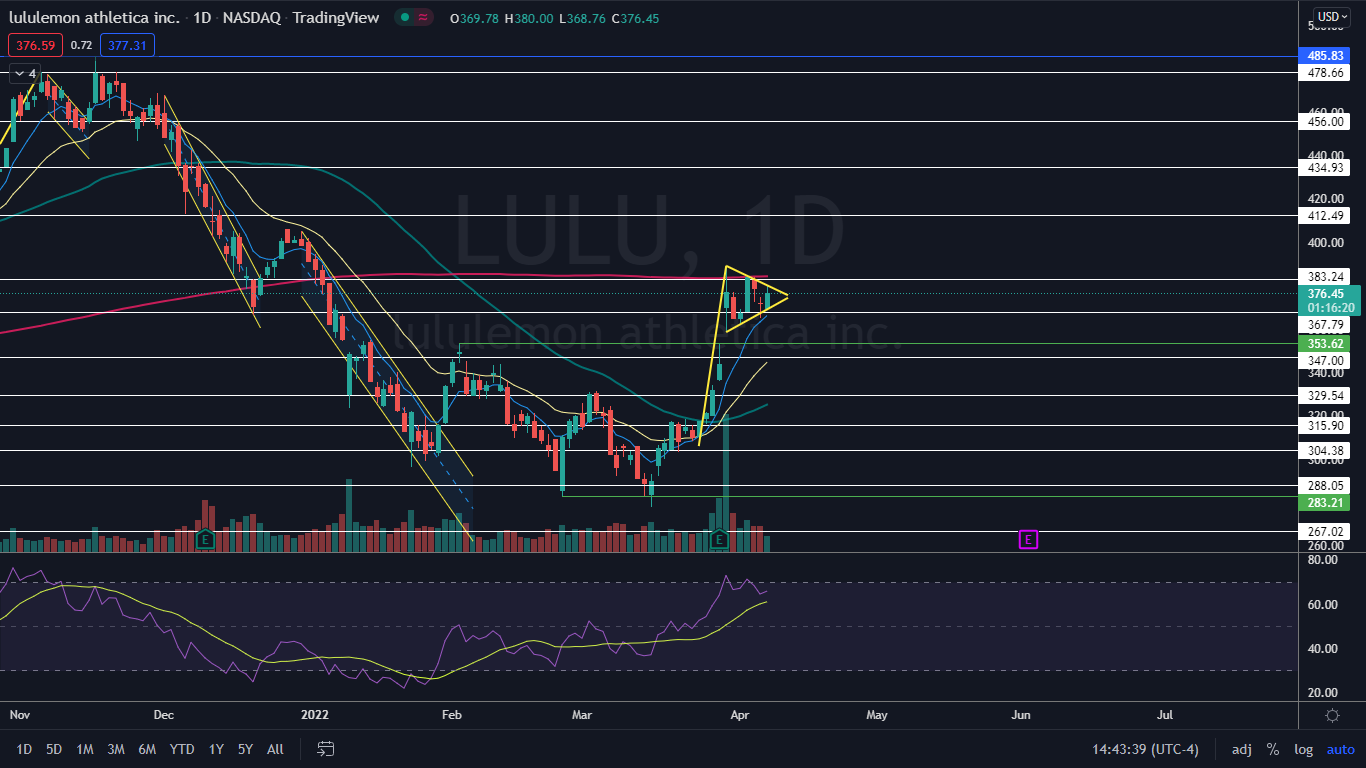
The Lululemon Chart: Between March 24 and March 30, Lululemon soared 27%, which created the pole of the bull flag pattern. Since then, the stock’s daily trading range has tightened into a triangle, which has formed the flag of the pattern.
- If Lululemon breaks up bullish from the upper descending trendline of the flag on higher-than-average volume, the measured move could see the stock trade up toward the $462 level, which is in range of the Nov. 16, 2021 all-time high of $485.83.
- The stock is set to hit the apex of the triangle on April 12 and traders and investors can watch for a break from the triangle pattern over the next three trading days to gauge future direction.
- If Lululemon breaks up from the flag formation, the stock will regain support at the 200-day simple moving average (SMA), which will indicate long-term sentiment has turned bullish.
- On Thursday, Lululemon was trading on lower-than-average volume, which indicates consolidation is taking place, which aligns with the theory that the bull flag pattern is in play. By late afternoon, only about 872,000 shares had exchanged hands compared to the 10-day average of 2.43 million.
- The consolidation within the bull flag pattern has helped to drop Lululemon’s relative strength index (RSI) to about 65% from the 73% level the stock’s RSI was measuring on March 30. The drop in RSI allows for Lululemon to trade higher if the stock breaks up from the bull flag.
- Lululemon has resistance above at $383.24 and $412.49 and support below at $367.79 and $347.