Zoom Video Communications, Inc (NASDAQ:ZM) was trading up about 5% at one point on Monday, as the company headed into its fourth-quarter earnings print after the market close.
When Zoom printed its third-quarter results on Nov. 22, the stock gapped down almost 10% the following day and continued in the steep downtrend, which has brought the stock down over 77% from its Oct. 19, 2020 all-time high of $588.84.
For that quarter, Zoom reported revenue of $1.05 billion, which beat the $1.02 billion consensus estimate. The company reported earnings per share of $1.11, beating a consensus estimate of $1.09.
Ahead of Zoom’s fourth-quarter print, a number of analysts weighed in on the stock. UBS maintained a Neutral rating and lowered the price target on Zoom to from $250 $130, Citi maintained its Neutral rating and lowered the price target from $250 to $147 from $250 and Mizuho maintained its Buy and lowered its price target to $190.
Regardless of how Zoom reacts to its earnings print, there’s a pattern with strong levels that has developed on the chart, which the stock is likely to react.
See Also: Is Now The Time To Buy Stock In Novavax, Zoom Or Workhorse?
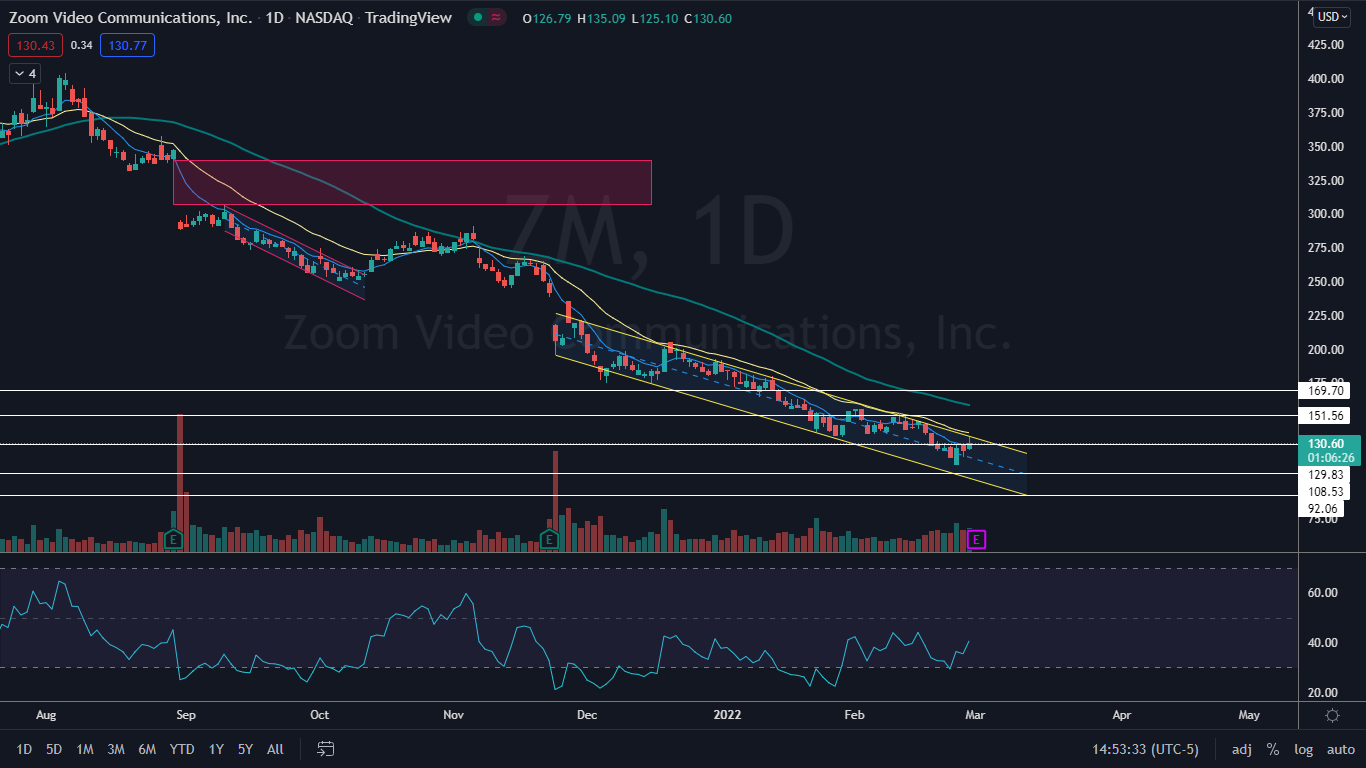
The Zoom Chart: On Nov. 3, Zoom began trading in a falling channel on the daily chart, and on Monday the stock attempted to break up bullishly from the pattern but rejected and wicked from the upper descending trendline of the pattern. A falling channel is considered a bearish pattern until the upper trendline of the pattern is reached, which can indicate a strong reversal to the upside is on the way.
- Zoom has regained the eight-day exponential moving average (EMA) as support but rejected the 21-day EMA on Monday, which aligns with the upper trendline of the channel. If Zoom reacts bullishly to its earnings print, traders will want to see the stock recapture the 21-day EMA on Tuesday.
- There is a gap above on Zoom’s chart between $306.26 and $339.65. Gaps on charts fill about 90% of the time, which makes it likely Zoom will trade back up into that range in the future although it could be an extended period of time before that happens.
- Zoom has resistance above at $151.66 and $169.70 and support below at $129.83 and $108.53.
Want direct analysis? Find me in the BZ Pro lounge! Click here for a free trial.


