Robinhood Markets, Inc (NASDAQ:HOOD) was trading slightly lower Wednesday as the company heads into its third-quarter earnings print after the close.
When Robinhood printed a second-quarter EPS beat Aug. 2, the stock surged almost 10% higher the following day before topping out at $11.35 on Aug. 4. Between that date and Wednesday, Robinhood has been trading in a slight uptrend on the weekly chart.
For the second quarter, Robinhood reported a loss of 34 cents per share, beating a consensus estimate of a loss of 37 cents per share.
For the third quarter, analysts, on average, estimate Robinhood will report a loss of 31 cents per share on revenues of $355.27 million.
On Oct. 12, Morgan Stanley analyst Michael Cyprys maintained an Equal-weight rating on Robinhood and raised the price target from $11 to $12.
Cathie Wood-led ARK Investment Management has been loading up on shares of Robinhood over the last week, most recently adding 30,000 shares across two different ETFs.
From a technical analysis perspective, Robinhood’s stock looks bullish heading into the event, having settled into a possible bull flag pattern near the upper trendline of a rising channel. It should be noted that holding stocks or options over an earnings print is akin to gambling because stocks can react bullishly to an earnings miss and bearishly to an earnings beat.
The Robinhood Chart: Robinhood started trading in a rising channel pattern on July 28. Over the last three trading days, the stock has attempted to break up bullishly from the pattern but has wicked and rejected from the upper ascending trendline.
- The rise that occurred between Oct. 21 and Oct. 31, paired with the slightly lower prices over the last two trading days, have settled Robinhood into a possible bull flag pattern, with the flag forming just under the upper trendline of the channel. The measured move of a break up from the flag is about 30%, which indicates Robinhood could soar toward $15.
- Although Robinhood negated its downtrend Oct. 26, by rising above the Oct. 14 lower high of $11.02, the stock hasn’t yet confirmed an uptrend is intact. If Robinhood receives a bullish post-earnings reaction, Wednesday’s low-of-day will mark a higher low and confirm an uptrend.
- If the stock suffers a bearish reaction to earnings and breaks down below the eight-day EMA, the bull flag pattern will be negated. If that happens and Robinhood continues to fall over the coming trading days, the stock may find support at the lower ascending trendline of the channel.
- Robinhood has resistance above at $12.77 and $13.95 and support below at $11.63 and $10.10.
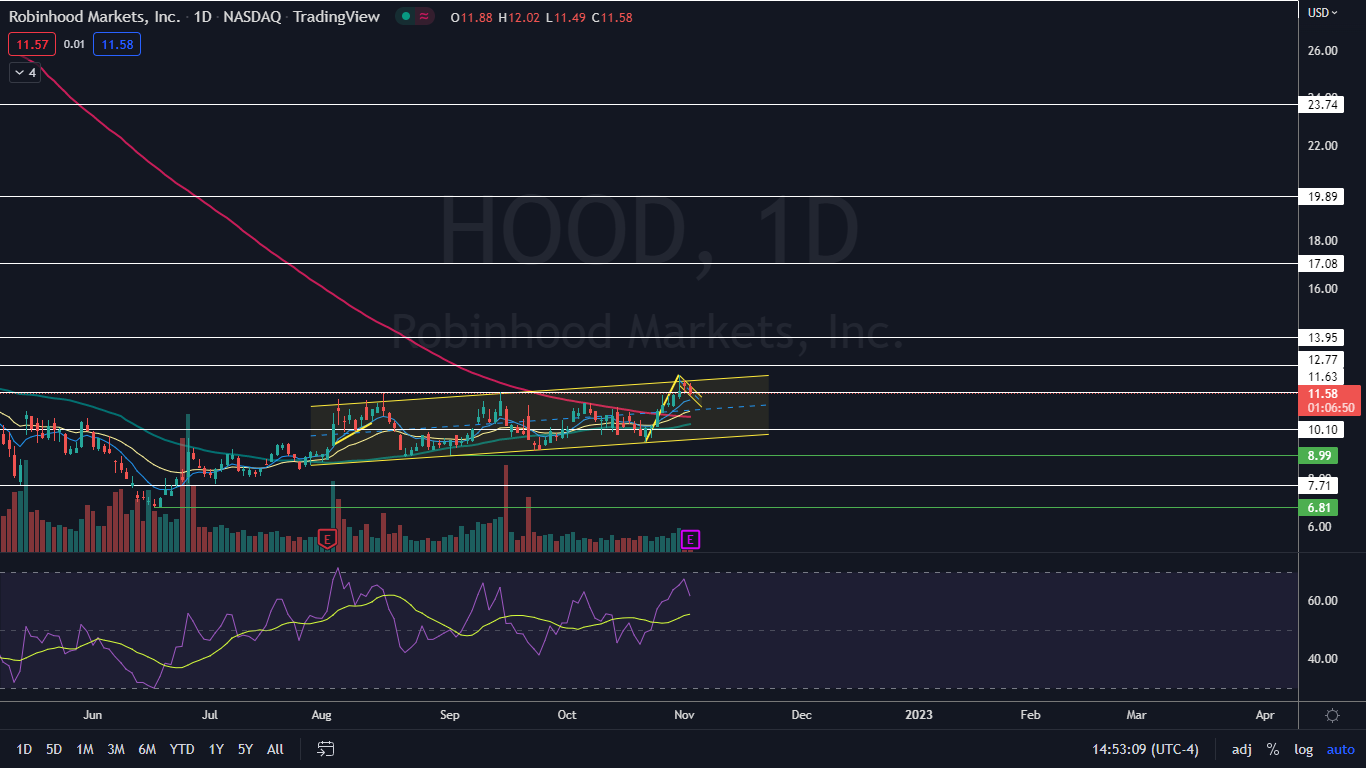
Photo via Shutterstock.