Technicians are a special breed of trader. Metrics like P/E ratio and free float are often seen as extraneous details to technical purists. They don’t rely on fundamental analysis. They don’t bet on the EPS and revenue of a stock outperforming earnings expectations. They simply read the charts, searching for patterns and signals that it’s time to enter or exit a trade. The more overlapping signals they can find, the better.
Market Rebellion’s Chief Technical Analyst AJ Monte uses a checklist to help pin down his trade set-ups. Included in the list are things like single-candle patterns — is it a hammer? A doji? When candles like these occur during a defined trend, it can signal investor indecision — leaving the door open for a potential reversal in trend. But if you tried to trade every doji candle you saw, you’d probably end up with a pretty spotty track record. Candle patterns are just one factor among many that technical analysts search for when planning their trades. Others include metrics like volume - is the volume decreasing as the trend continues? How do the moving averages look? Are they acting as a support? Are there gaps that need filling?
The list goes on. Not every single box needs to get checked, but the more factors that line-up with one another, the better. Last week, AJ spotted a convergence of these technical factors in the fast-paced ETF, BOIL.
The ProShares Ultra Bloomberg Natural Gas ETF (BOIL)
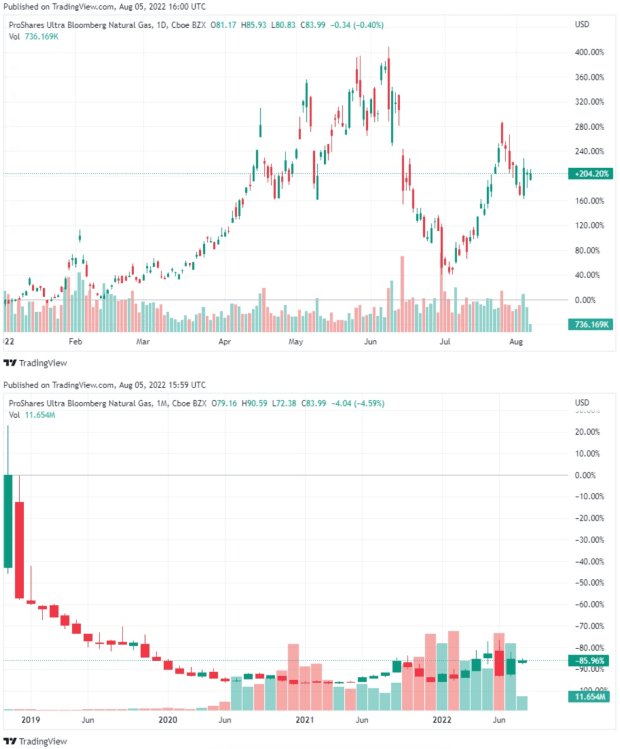
BOIL is a really interesting ETF, providing 2x the return of a futures-based natural gas index. Despite BOIL being up over 200% YTD, you want to be careful — this is a levered ETF. Any time you see the words “levered ETF”, you should immediately think: “This is more of a trading product than a buy-and-hold product”. Case-in-point: that 200% positive YTD return sounds impressive until you zoom out a couple years.

So it makes sense why this is a tool that can be powerful if you know how to pick your spots - that’s something that technical analysts like AJ Monte specialize in.
Start trading the technicals with Options Oracle. Led by Chartered Market Technician AJ Monte, Options Oracle combines technical analysis with advanced option strategies to set up powerful two-pronged swing trades.
When Technical Signals Converge: BOIL Breakout
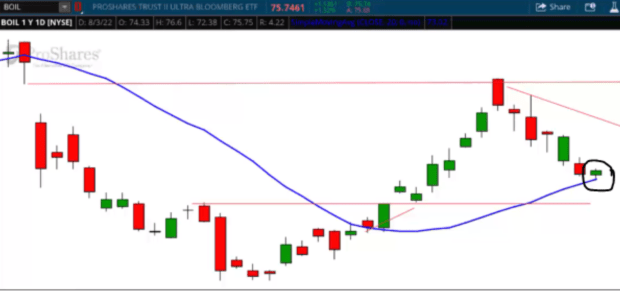
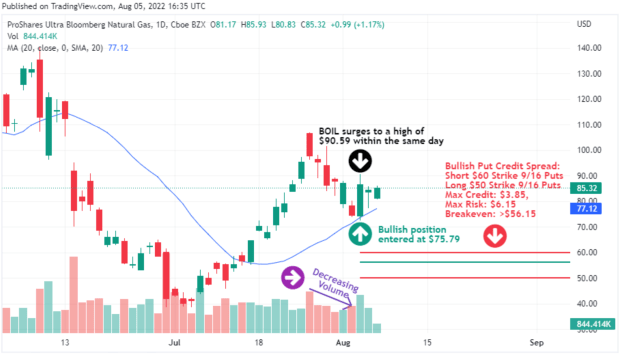
When AJ first set his eyes on BOIL, it was in a short-term downtrend. However, after taking a closer look, BOIL’s chart started to check off some of AJ’s technical analysis boxes. AJ first called out the spinning top (circled in black) at the bottom of the 6-day downtrend. Recall that single-candle patterns like this spinning top at the bottom of a downtrend indicate investor indecision and possible trend reversal. That spinning top occurred directly on top of the 20-day simple moving average (the blue line), and just above a nearby flat line (the lower red line).

Additionally, AJ noticed that with each passing day of the downtrend, volume was decreasing (see the purple annotation below). If a trend is to be believed, you want to see volume increasing. Decreasing volume is a sign that investors are starting to back off.

After identifying these convergent factors:
- A bullish spinning-top reversal candle
- Decreasing volume with each day of the downtrend
- Support from the 20-day simple moving average
AJ began crafting the trade idea. Due to the high volatility in BOIL, AJ opted to sell an out-of-the-money credit spread that lined up with the lower flat line support. That took shape in the form of a $60/$50 bullish put credit spread expiring 45 days out.
Using a credit spread during a period of high volatility, selling it out-of-the-money (meaning it was already fully within his range of max-profit), and aligning the strikes with a level of support are three ways that AJ put even more probability on the side of his trade.
But even though his trade expiration was more than a month out, it didn’t take anywhere near that long for this trade idea to work. AJ entered the trade early on August 3rd, with BOIL trading at $75.79. Before the end of the day, BOIL surged more than 19% to trade as high as $90.59.
Tap into AJ Monte’s technical expertise and learn to trade options like a pro. Oracle Essential teaches you how, with simple-to-follow weekly call-and-put trade ideas based on technical analysis from a licensed Chartered Market Technician.
The Bottom Line: How to Apply These Lessons Going Forward
While this BOIL trade has already played out, the principles are always going to be the same. Before you enter a trade, have a plan. What factors will you be searching for? Will you search for single-candle reversal patterns? Will you look at the 20-day SMA? Will you draw lines where the stock has seemed to find support or resistance in the past? Will you look for signs of investor indecision like decreasing volume falling in-line with a defined trend?
How about things we didn’t cover here, like RSI looking overbought or oversold? How many of your pre-planned technical factors will have to fall in line before you enter your trade? And moreover, will you use these same technical factors like levels of support and moving averages to craft your trade, if you’re using options? Will you consider factors like volatility in your trade structure?
These are all phrased like questions because, while these are all great suggestions, they aren’t set in stone. There are many, many more technical analysis metrics you could be searching for when creating a trade plan. The one thing that is set in stone is that you have a plan, and you stick to it. That’s what being a disciplined, consistent trader is all about.
Is this all going over your head? Want a little help getting started? Check out Oracle Essential. Each week, AJ will take you through the same process he used to find this BOIL breakout, providing you with easy-to-follow instructions for how to follow him into, and out of the trade idea using plain-old calls and puts.
Looking for something a little more advanced? Try Options Oracle. This is for people who want to take their technical option trading to the next level. Every week, AJ will take on advanced trade structures, building out a vast array of fluid positions. Whether you trade with AJ or trade by yourself, technical analysis is a powerful skill that every trader worth their salt should at least learn the basics of.


