Nike, Inc (NYSE:NKE) was sliding 4% lower Thursday as the company heads into its first-quarter earnings print after the close.
When Nike printed a fourth-quarter earnings beat on June 27, the stock closed almost 9% lower the following day. Although the company’s earnings came in ahead of estimates, revenue had declined 1% year-over-year.
For the fourth quarter, Nike reported revenue of $12.2 billion, which beat the $12.07 billion consensus estimate. The company reported earnings per share of 90 cents, beating a consensus estimate of 81 cents. Nike also announced an $18-billion share buyback plan to take place over the next four years
For the first quarter, analysts, on average, estimate Nike will report earnings per share of 92 cents on revenues of $12.27 billion.
Ahead of the event, Telsey Advisory Group analyst Cristina Fernandez maintained an Outperform rating on Nike and lowered the price target from $130 to $125.
From a technical analysis perspective, Nike’s stock looks bearish heading into the event, having broken down from a bear flag pattern on the daily chart.
It should be noted that holding stocks or options over an earnings print is akin to gambling because stocks can react bullishly to an earnings miss and bearishly to an earnings beat.
Want direct analysis? Find me in the BZ Pro lounge! Click here for a free trial.
The Nike Chart: Nike formed into a bear flag between Sept. 13 and Wednesday, with the pole created over the first 11 days of that time frame and the flag printing over the course of Tuesday and Wednesday.
On Thursday, Nike was breaking down bearishly from the pattern on high volume, indicating the pattern was recognized.
- The measured move of the bear flag is 12%, which indicates Nike could fall toward the $87 level. It should be noted that the stock is likely to experience brief bounces on the way down before Nike falls to that level.
- Nike is also trading in a confirmed and consistent downtrend, with the most recent lower high printed at the $99.43 mark on Wednesday and the most recent confirmed lower low formed at the $95 mark the day prior. On Thursday, Nike fell under the most recent lower low, confirming the trend is intact.
- Short-term bullish traders can watch for Nike to eventually form a bullish reversal candlestick, such as a doji or hammer candlestick, to indicate a bounce to the upside is on the horizon.
- Nike has resistance above at $95.11 and $99.53 and support below at $90.93 and $86.90.
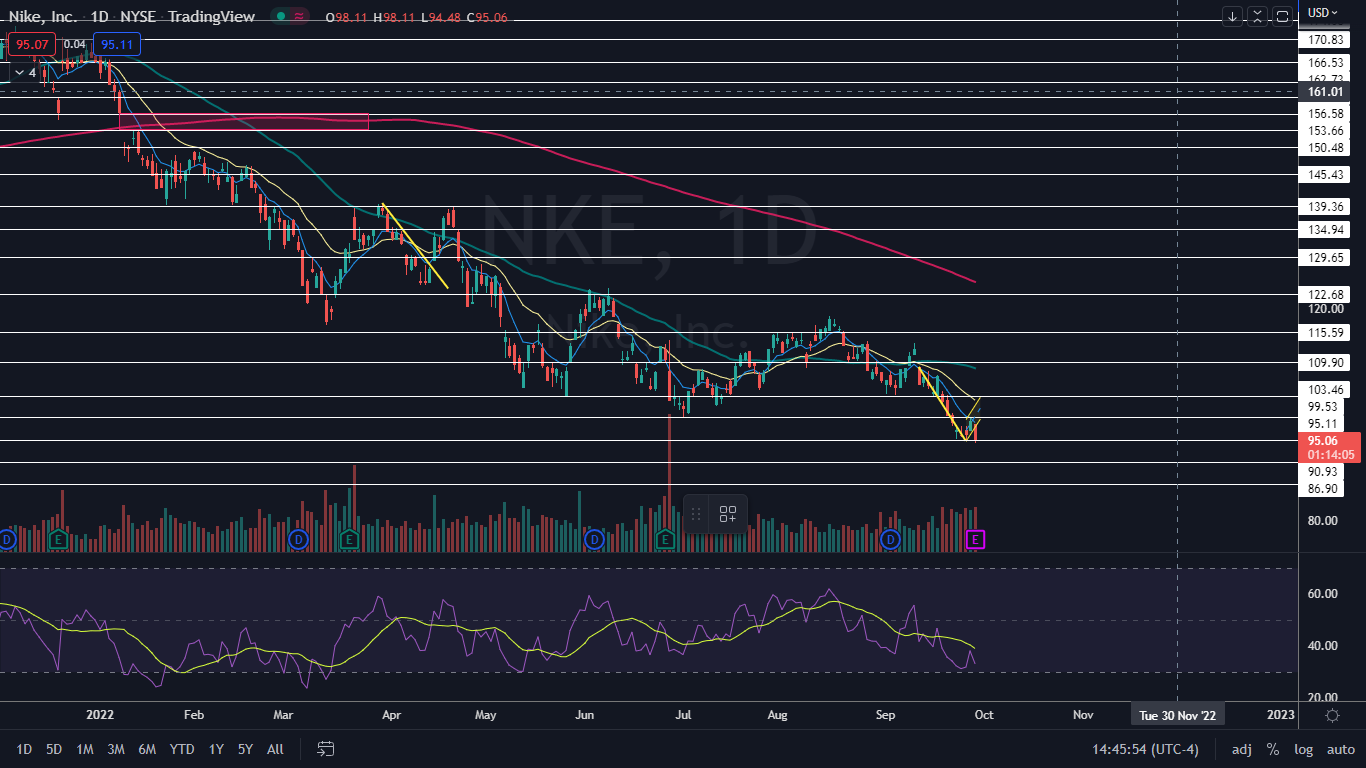
Photo via Shutterstock.