
Lucid Group, Inc (NASDAQ:LCID) is set to print its second-quarter financial results after the market closes on Wednesday. The stock was trading over 3% higher heading into the event.
When the American electric vehicle maker printed its first-quarter results on May 5, the stock gapped down 4.49% the following day. Over the course of that day and the following two trading days, Lucid slid an additional 20% lower.
For the first quarter, Lucid reported a loss of 5 cents per share on revenues of $57.68 million. The company beat the EPS estimate of a loss of 30 cents on revenues of $53.43 million. Lucid delivered 360 vehicles during that quarter and said it saw strong demand, with more than 30,000 customer reservations.
For the second quarter, analysts estimate Lucid will print a loss of 36 cents per on revenues of $145.49 million.
From a technical analysis perspective, Lucid’s stock looks set to trade higher over the long term due to several patterns that have developed on the stock’s daily chart. It should be noted that holding stocks or options over an earnings print is akin to gambling because stocks can react bullishly to an earnings miss and bearishly to an earnings beat.
The Lucid Chart: On July 28, Monday and Tuesday, Lucid printed a bullish triple bottom pattern at the $17.77 level and on Wednesday, the stock was reacting to the pattern. If Lucid closes the trading day near its high-of-day price, the stock will print a bullish hammer candlestick, which could indicate higher prices will come again on Thursday.
- Lucid is also trading in a fairly consistent uptrend, with the most recent higher lows formed at the $17.77 level. On Tuesday, Lucid printed a higher high above the high of $19.02 and on Wednesday, the stock was spiking higher and giving no indication the next high is in.
- The bullish price action on Wednesday caused Lucid’s eight-day exponential moving average (EMA) to cross above the 21-day EMA, which is bullish. The stock is also trading above the 50-day simple moving average, which indicates longer-term sentiment is bullish.
- If Lucid receives a bearish reaction to its earnings print and falls below the $17.77 level, the uptrend will be negated and a downtrend will be likely to confirm.
- Lucid has resistance above at $20.90 and $22.65 and support below at $18.54 and $17.25.
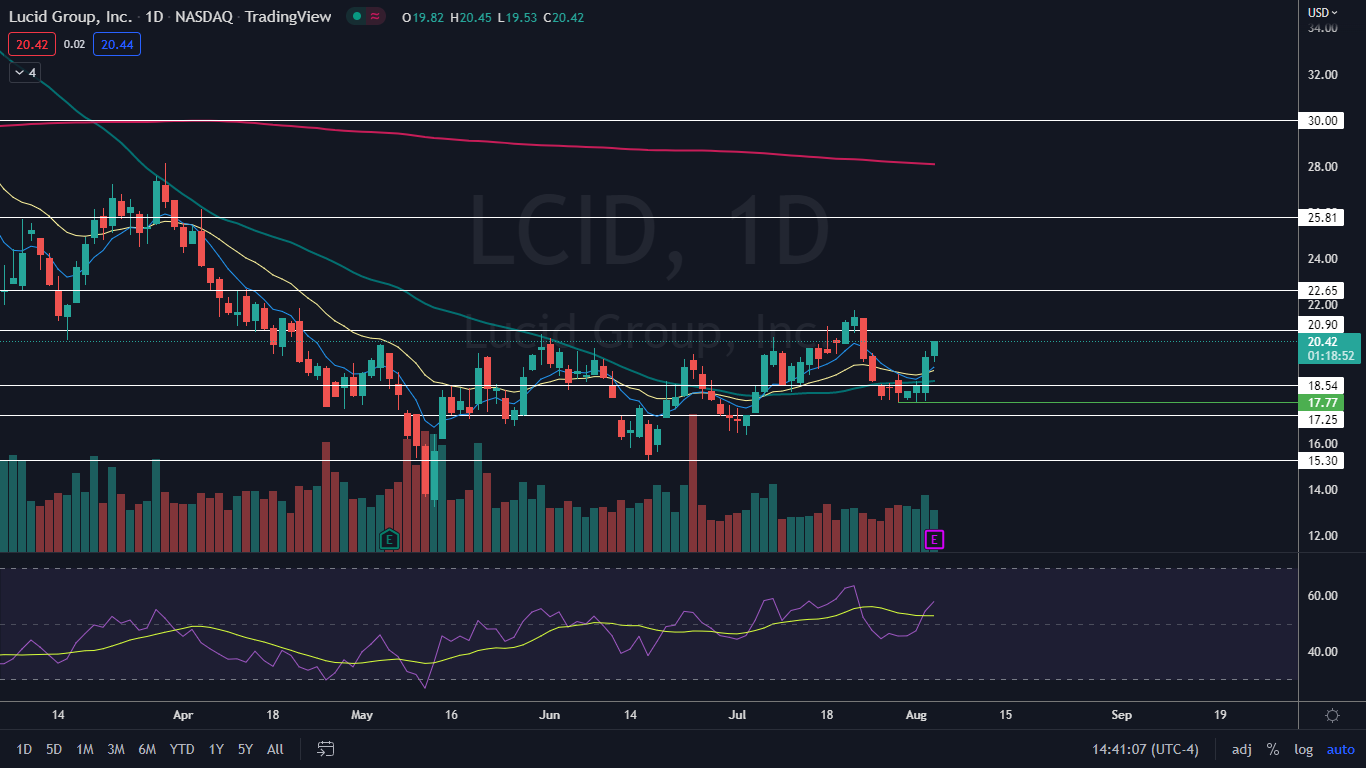
Photo courtesy of Lucid Motors.