Block, Inc (NASDAQ:SQ) is set to print its first-quarter financial results after the market close on Thursday. The stock was trading 12% lower heading into the event.
When the mobile payments and financial services company printed its fourth-quarter results on Feb. 24, the stock soared 39% higher over the two trading days that followed before topping out at the $131.95 level on Feb. 28, where Block entered into a downtrend.
For the fourth quarter, Block reported earnings per share of 27 cents on revenues of $4.079 billion, which beat the consensus estimate of 22 cents per share and revenues of $4.03 billion.
For the first quarter, analysts estimate Block will report EPS of 21 cents on revenues of $4.14 billion.
Heading into the event, Oppenheimer reinstated its Outperform rating on Block and announced a $150 price target. The price target suggests a 56% move to the upside.
Block has plummeted 66% from its all-time high of $289.23 (Aug. 5, 2021) and since March 29, the stock has been trading in a consistent downtrend, falling 35% from the high of $149.
From a technical standpoint, Block looks set to bounce following its earnings print but it should be noted holding stocks or options over an earnings print is akin to gambling because stocks can react bullishly to an earnings miss and bearishly to an earnings beat. Options traders particularly, those who are holding close dated calls or puts, take on extra risk because the intuitions writing the options increase premiums to account for implied volatility.
The implied move for options of Block expiring this week is 13.04%.
Want direct analysis? Find me in the BZ Pro lounge! Click here for a free trial.
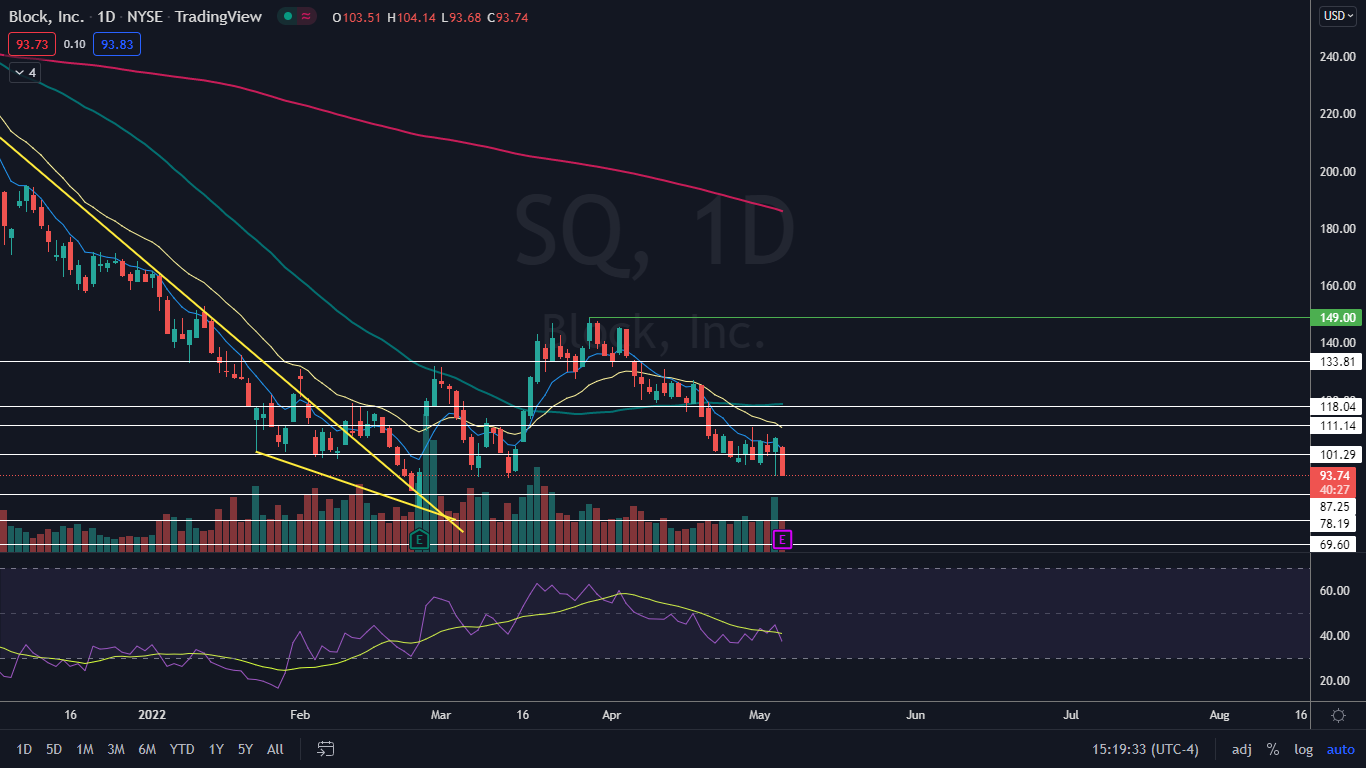
The Block Chart: Block entered into a downtrend on March 29 and has since made a consistent series of lower highs and lower lows. The most recent lower high was printed on Tuesday at the $108 level and the most recent confirmed lower low was printed at $97.27 the day prior.
- On Thursday, Block was holding above Wednesday’s low-of-day, which has settled the stock into an inside bar pattern on the daily chart. The inside bar is neutral in this case because although Block was trading higher before forming the pattern, the stock’s daily candle is a bearish Marubozu, which indicates lower prices may be on the horizon.
- Block looks set to bounce over the coming days, however, because bullish divergence has developed on the chart, which will eventually need to correct with higher prices. Bullish divergence occurs when a stock makes lower lows while the relative strength index makes higher lows.
- Block has resistance above at $101.29 and $111.14 and support below at $87.25 and $78.19.

See Also: Money Talks? The Link Between Congressional Stock Trading And Corporate Lobbying


