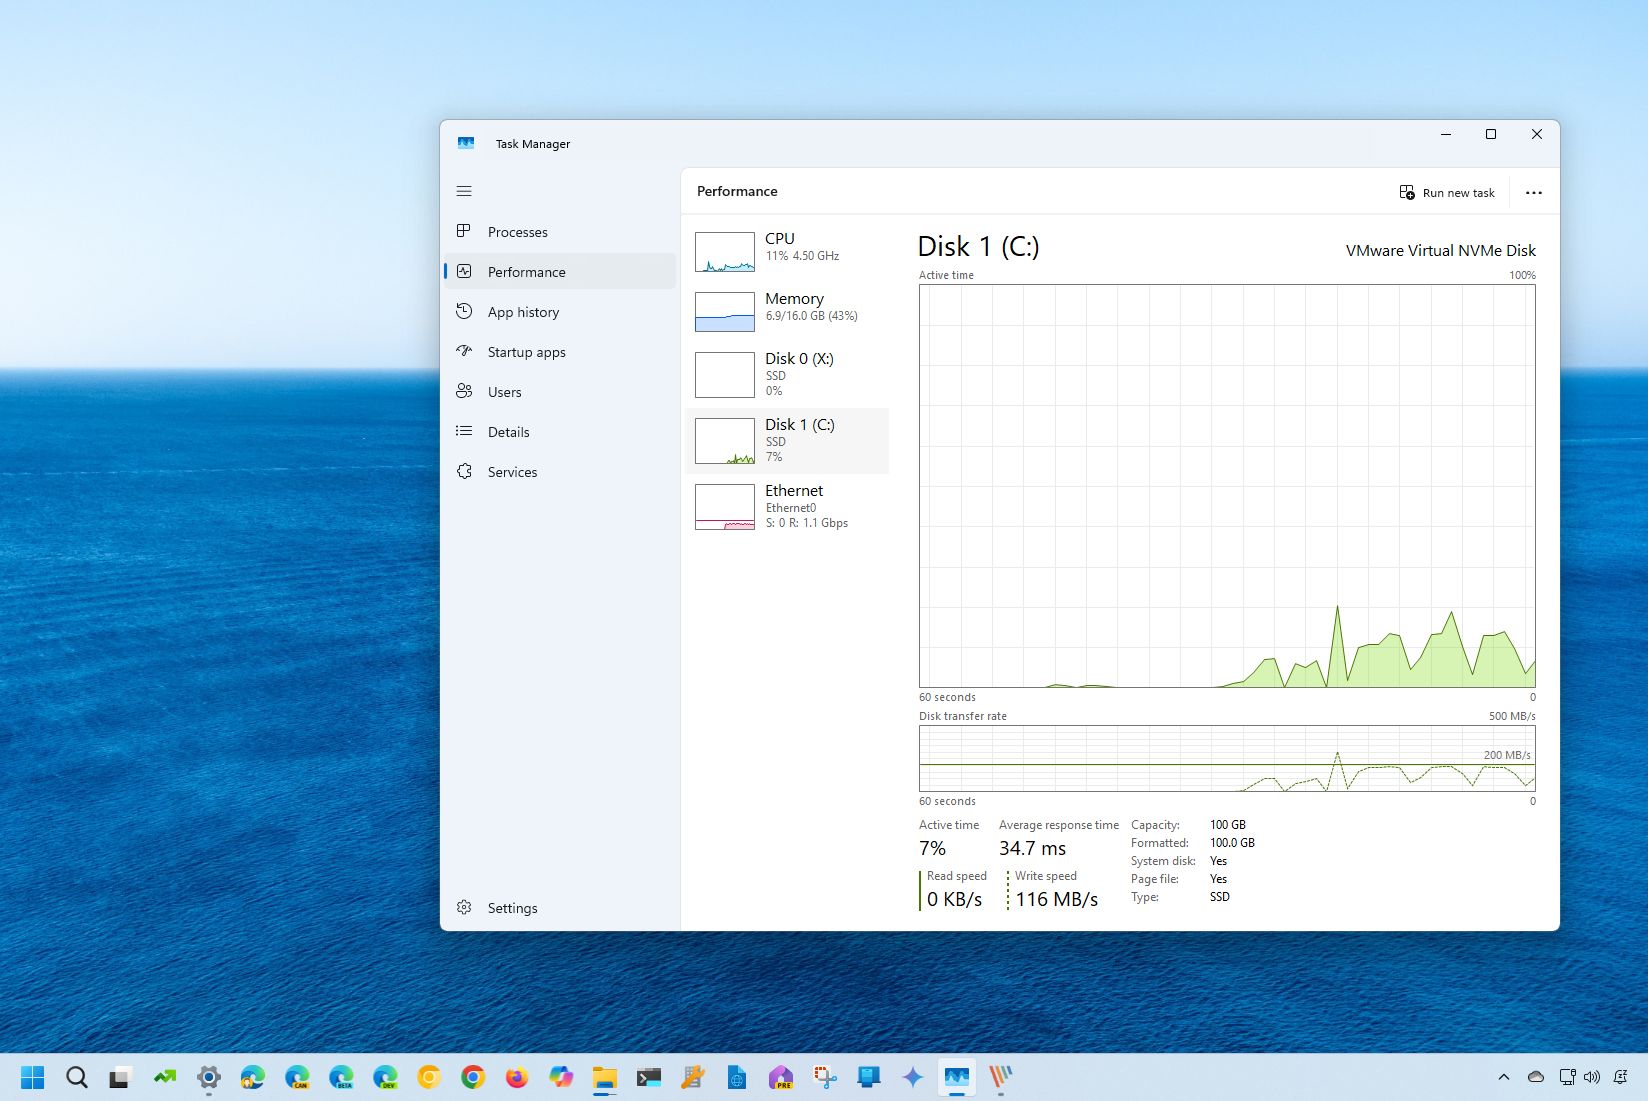
On Windows 11, you can monitor the system drive activity, such as transfer rates and response time, to understand the performance of the storage at a given time, and in this guide, I will explain two ways to complete this task without third-party software.
Although most laptops and desktop computers have switched to Solid-State Drives (SSDs), which are a lot faster than traditional Hard Disk Drives (HDDs), regardless of the storage technology, depending on the application and the task at hand, it will generate a number of reads and writes that can affect performance.
If you want to check the drive activity to understand the performance or if you have to troubleshoot storage-related issues on Windows 11, you can use the Task Manager and Performance Monitor to view transfer rates, response times, and other information in real-time.
In this how-to guide, I will explain the easy steps to check the drive activity on Windows 11. These instructions focus on two easy ways to check the drive performance at a given time. You can use these steps to test the drive performance, or I have also written another guide to help you determine the health of an SSD.
How to monitor drive activity from Task Manager
To check the drive activity through Task Manager, use these steps:
- Open Start.
- Search for Task Manager and click the top result to open the app.
- Click on Performance from the left pane.
- Select the drive from the left side.
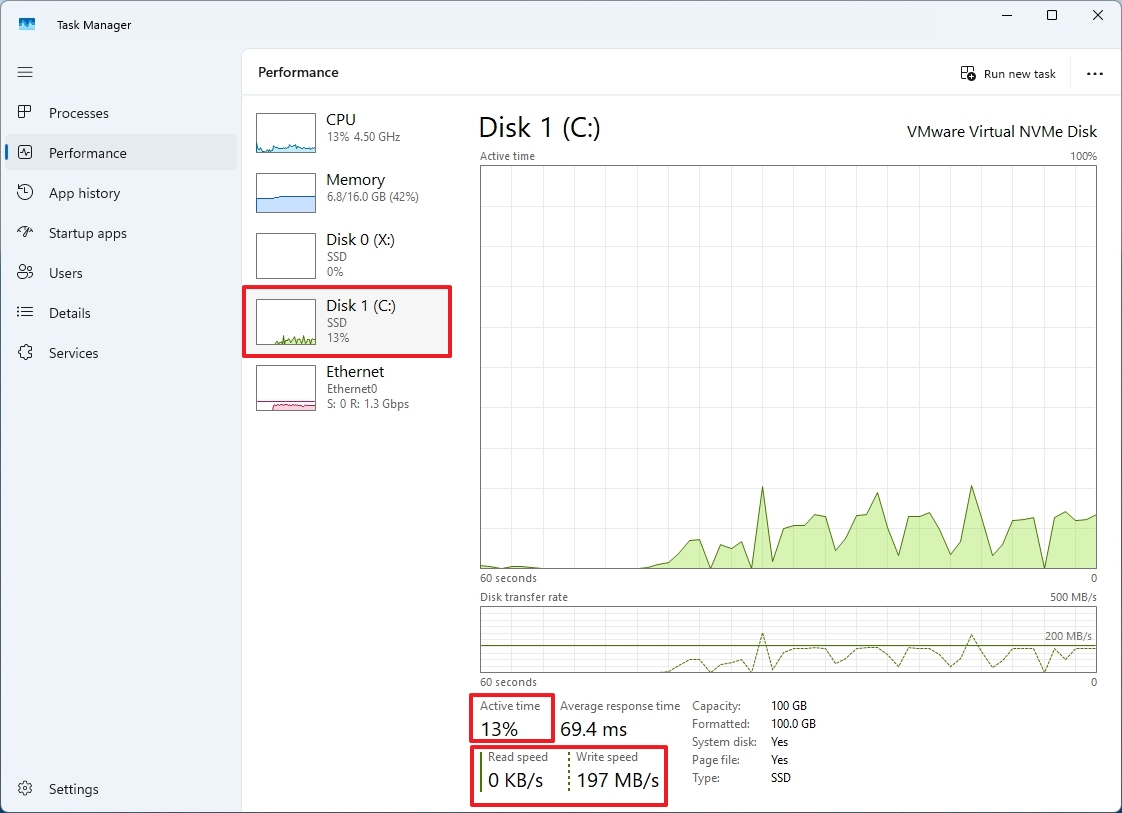
- Check the "Active time" section to review the percentage of reads and writes over time (every 60 seconds).

- Quick note: This information is also represented in the main "Active time" graph.
- Check the "Average response time" information, which is the amount of time it takes for a hard drive or solid-state drive to respond to a read or write request from the operating system.
- Check the "Read speed" and "Write speed" to determine the current speeds (Kilobytes or Megabytes per second) of the drive.
- Quick note: This information is also represented in the main "Disk transfer rate" graph.
Once you complete the steps, you will have an overview of the overall performance of the drive.
How to monitor drive activity from Performance Monitor
To monitor the drive activity with the legacy Performance Monitor app, use these steps:
- Open Start.
- Search for Resource Monitor and click the top result to open the app.
- Click the Disk tab.
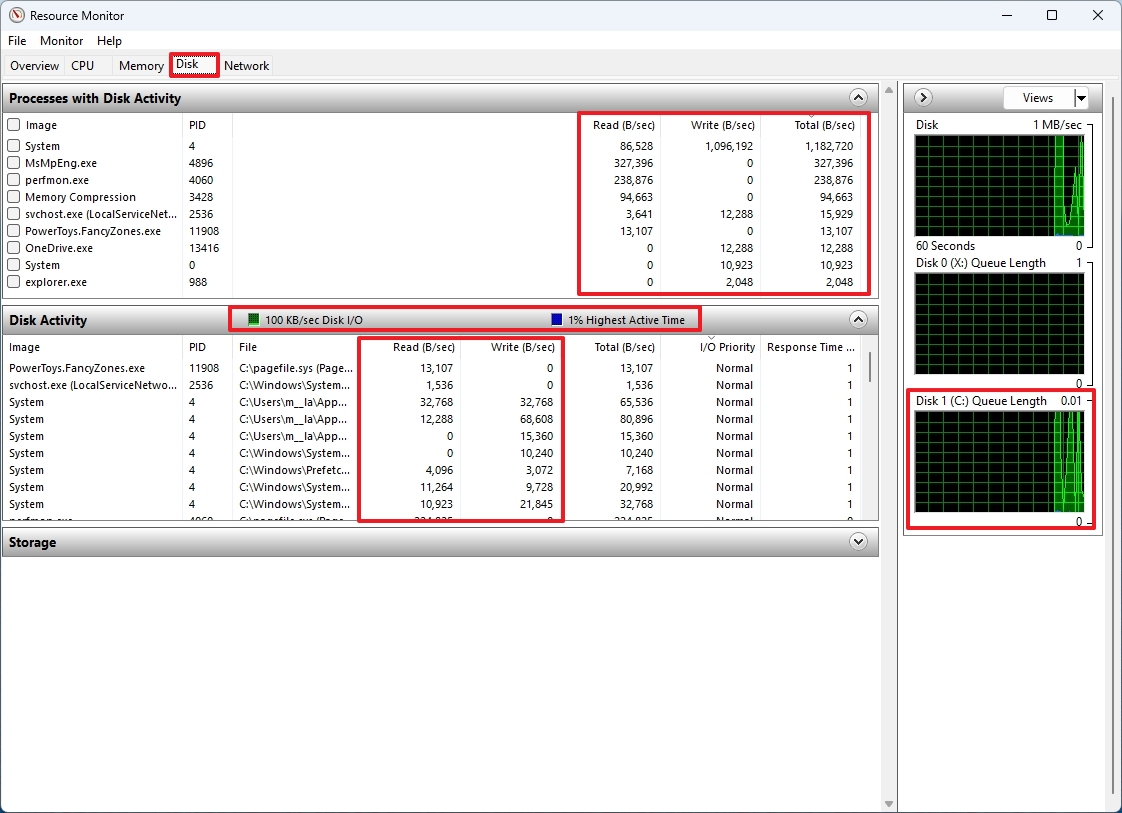
- Check the "Processes with Disk Activity" section to read and write speeds (Bytes per second) for processes that are currently using or have recently used disk resources.
- Click on Disk Activity.
- Check the read and write speeds for each of the system processes.
- Check the overall operations per second (IOPS) or bandwidth in the "Disk Activity" tab header.

On the right side, you will also find a graph of each of the drives available on your computer. The graph at the top shows IOPS for the drives, and the Queue Length graphs give you an indication of the drive performance.
For example, a high queue length suggests that the disk is overwhelmed and unable to keep up with the incoming read and write requests. This means many requests are waiting to be processed, leading to delays, which often correlates with slow drive performance.
On the other hand, a low queue length generally indicates that the disk is handling reads and writes requests efficiently. There are few, if any, requests waiting to be processed so programs can access data quickly. A low queue length usually indicates good drive performance.
It's worth mentioning that it's never recommended to use a computer with a full drive, since this can slow performance significantly. Typically, once the storage capacity reaches 70 percent, you want to start freeing up space or think about upgrading the drive with a larger capacity.
More resources
For more helpful articles, coverage, and answers to common questions about Windows 10 and Windows 11, visit the following resources:


