
Google Sheets enables you to monitor a selected list of publicly traded companies and to be able to track their latest share prices during the day. Google Finance allows such functionality via Google Sheets by picking stocks and defining their attributes, such as price, change, and high and low prices during the day. In this step-by step Tools tutorial, we will create a table to track a few stocks and specific attributes.
The spreadsheet version of the following tutorial can be downloaded here. Make a copy of the worksheet by selecting "Make a copy" from the drop-down in the File menu.
Related: How to track stocks from Google Finance in Google Sheets
How to create a table of stocks tracking trading activity
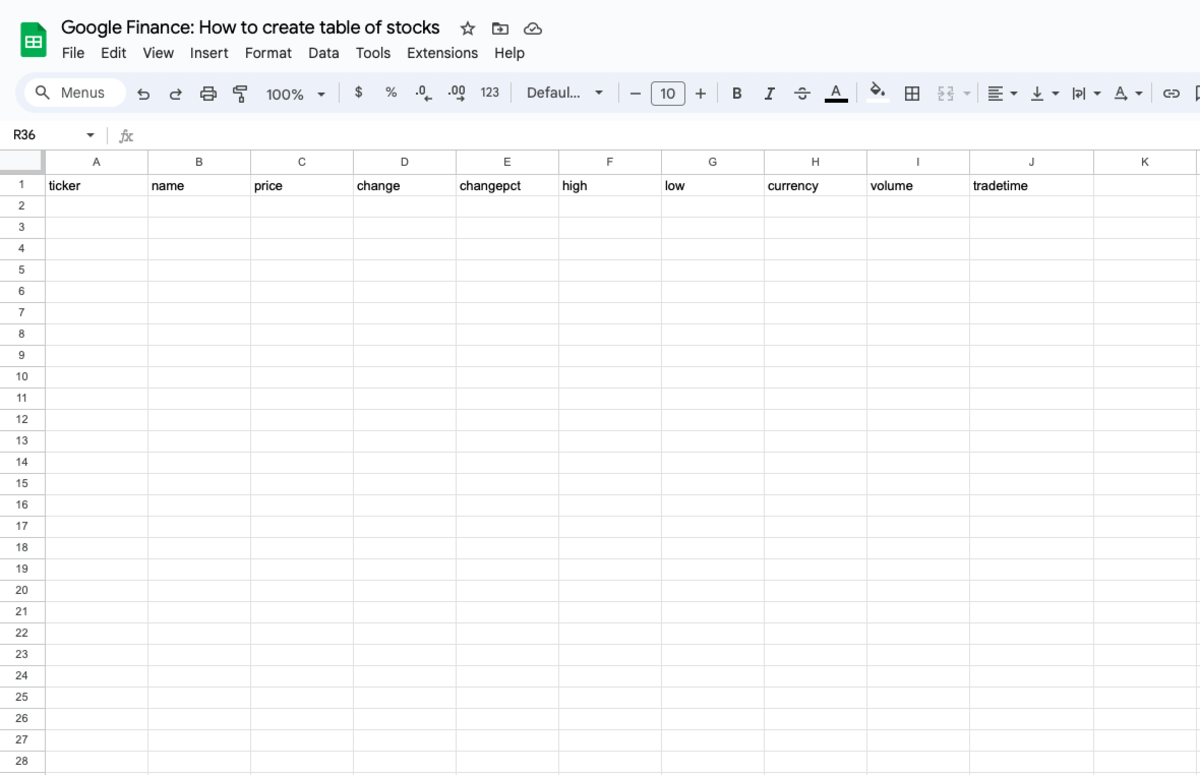
The first step is to create a new spreadsheet on Google Sheets by typing "sheets.new" in the URL bar of your browser. From the top row, going from left to right by column, attributes will be listed to define the requested data. In the example below, the list of attributes is as follows:
Attributes
- Ticker: This is the exchange name and ticker symbol of the listed company. Google Finance prefers providing the stock exchange where the company trades for specificity reasons. This most likely would avoid any conflict with a stock whose symbol appears on a different exchange if only the stock symbol were entered onto the spreadsheet's field.
- Name: This lists the name of the company.
- Price: This provides the latest available trading price of the stock. In Google Finance, there may be a slight delay, behind real-time, from some exchanges on prices for particular securities.
- Change: This provides the change in price from the closing price of the last trading day.
- Changepct: This calculates the change in price in percentage terms.
- High: This provides the highest price the stock traded at during the day’s session.
- Low: This provides the lowest price the stock traded at in the day’s session.
- Currency: This shows what currency the stock is trading in.
- Volume: This is the stock’s trading volume, or how many shares change hands from the start of the day’s trading.
- Tradetime: This provides the last time of trading for the stock.
Understanding Google Finance’s formula
Google Finance lays out a simple formula for displaying the data under each attribute that’s listed by column and row in the sample spreadsheet. In this case with the stock table via Google Sheets, the syntax would be in this general format:
=GOOGLEFINANCE(primary attribute, secondary attribute)
The primary attribute for creating the stock table will be the ticker, and the secondary attributes will include price, change, and so on.
In the example below, Row 1 lists attributes by column for ticker, name, price, change, percent change, high and low intraday prices, trading volume, trading time, and time delay of data.
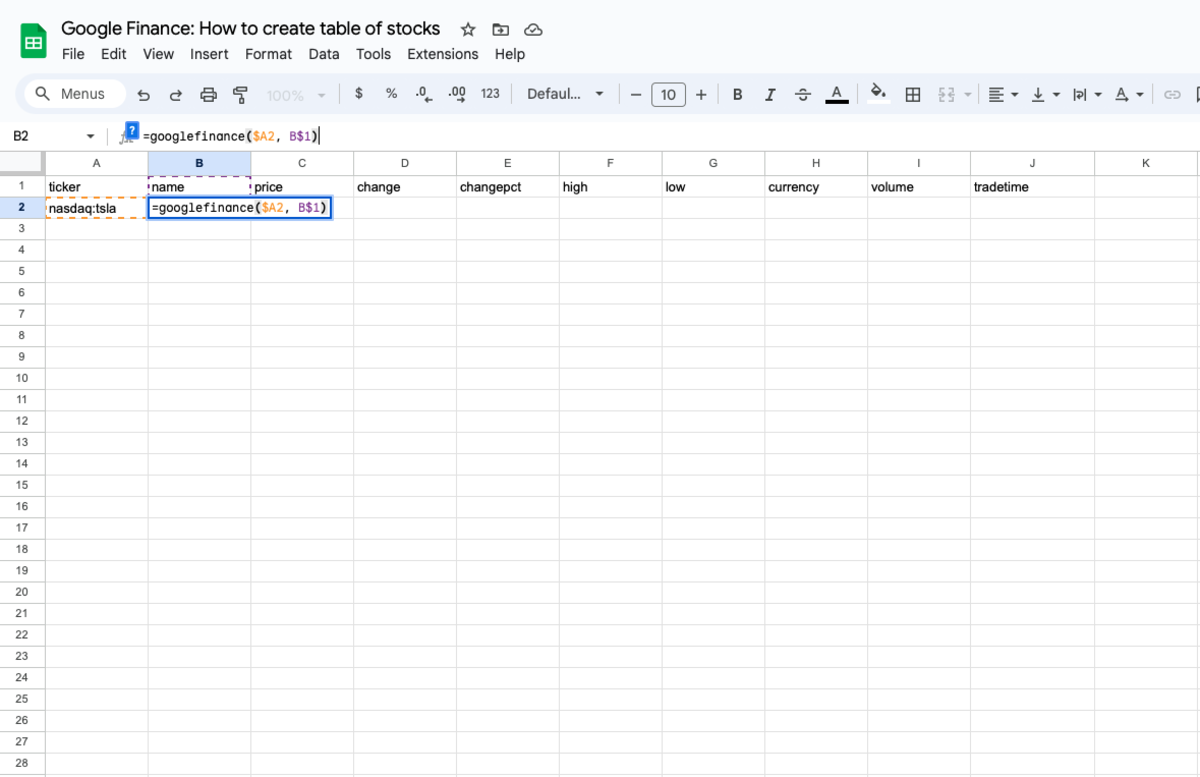
After entering the ticker symbol in Row 2 for Column A, a formula in the adjacent column (cell B2) will instruct Google Finance to pull the data based on the cells to the left of it and above it:
=GOOGLEFINANCE($A2, B$1)
In this syntax, copying the formula from this cell to other cells of the spreadsheet will automatically fill in the data of corresponding attributes. The formula in cell B2 instructs Google Finance where to pull information. Placing the dollar symbol ($) before the column helps with the copying and pasting of the formula and populating highlighted fields. In this example, $A2 means that Google Finance will use the ticker symbol entered under Column A to load data for the corresponding attribute by column. When the cell is copied onto other cells, the attribute for the ticker is fixed and will not change.
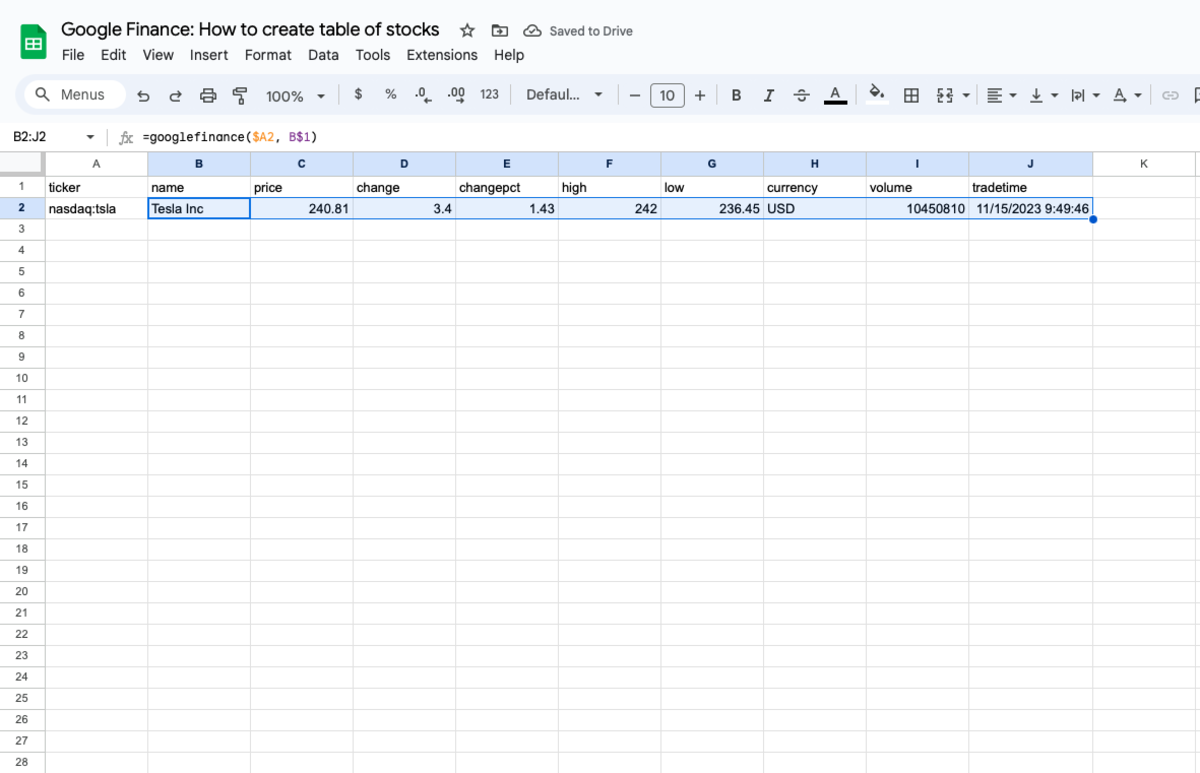
In the example above, only the ticker symbols need to be entered, and the ticker for Tesla (TSLA) -) is in cell A2. The second part of the formula, B$1, means that the field in cell B2 will fill in the name under column B based on the ticker in cell A2. After the formula in cell B2 is entered, Google Finance will fill in the entry, which in this case is Tesla’s name. When the cell is copied onto other cells from left to right, the attribute in each column under Row 1 is fixed and will not change, but is based on the primary attribute, which is the ticker expressed as a fixed cell in column A.
Note: While the above is an indirect way to pull data automatically based on the attributes set by specific cells, there is a direct way to download the data but would require writing the attributes in the syntax manually and repetitively. Using the sample spreadsheet above, for cell B2 instead of directing the formula to pull data based on other cells defined by attributes, the direct expression is: =GOOGLEFINANCE("NASDAQ:TSLA" ,"NAME"). For cell C2, the direct syntax will be =GOOGLEFINANCE("NASDAQ:TSLA" ,"PRICE"), for cell D2, it is =GOOGLEFINANCE("NASDAQ:TSLA" ,"CHANGE"), and so on.
Copying the formula from cell B2 to the cells under each corresponding column in Row 2 means that Google Finance will populate the data for name, price, change, and the other attributes listed for Tesla.
How to add other stocks
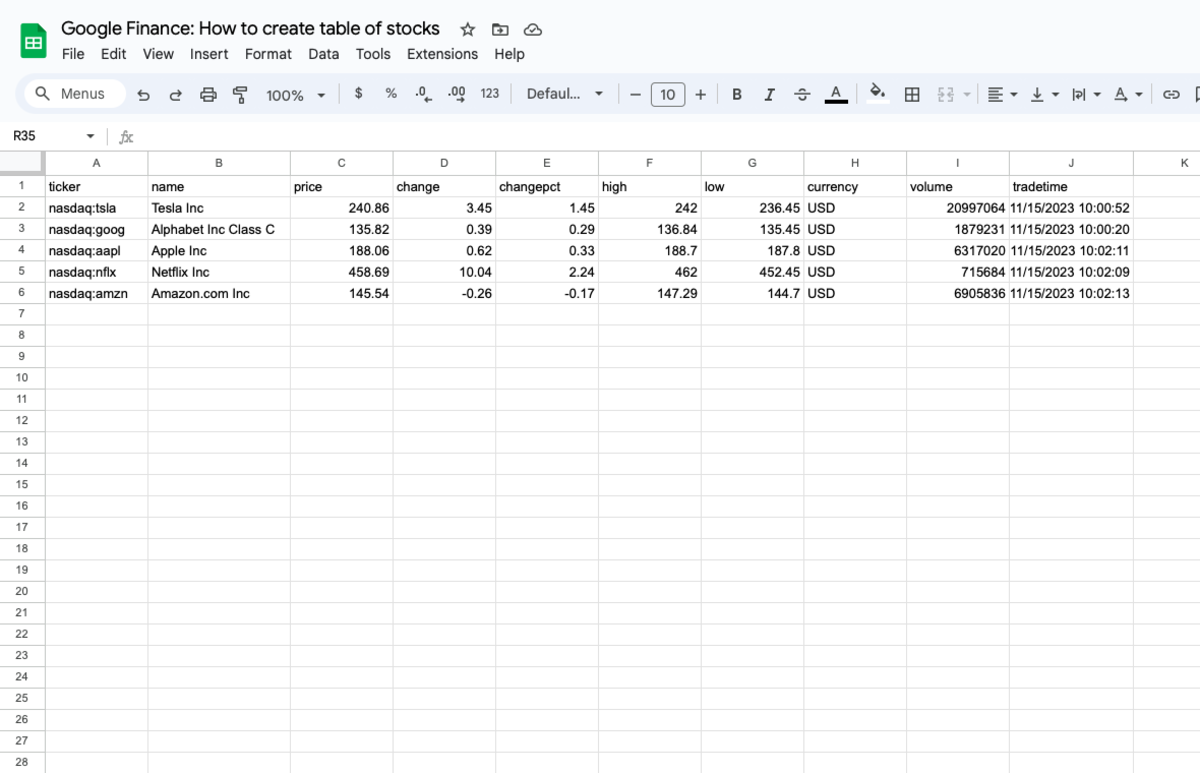
To gather data on other stocks, enter the ticker symbol for Apple (AAPL) -), Google’s parent company Alphabet (GOOG) -), Netflix (NFLX) -), and Amazon (AMZN) -) in the rows below Tesla under Column A. Copy and paste onto the empty cells by column, and Google Finance populates the fields.
Based on the time of trading, stocks will show the latest price, change in price as well as percent change, the highs and lows during the day's trading, and the number of shares being traded for the day.
You’re now ready to monitor the trading activity of these stocks on Google Sheets!
Again, the spreadsheet version of this tutorial can be downloaded here. Make a copy of the worksheet by selecting "Make a copy" from the drop-down in the File menu.
This is just the first of many articles about how to use tools in Google Sheets. Let us know what you'd like to see next. Email us here: tools@thearenagroup.net