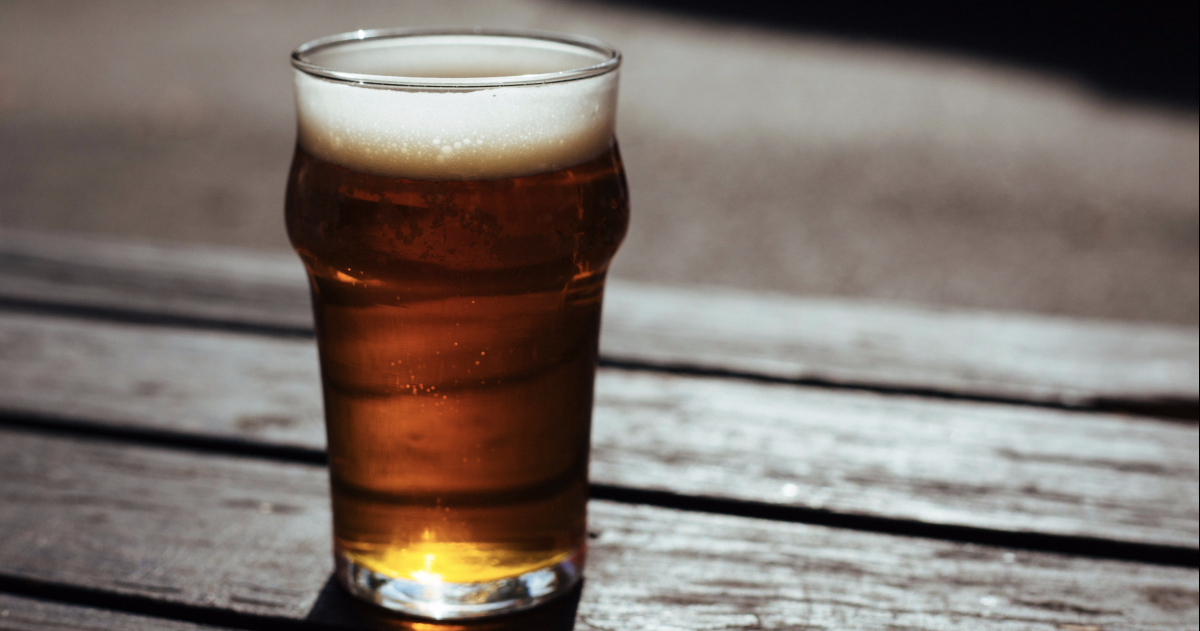
Anheuser-Busch InBev SA/NV (BUD) experienced a pronounced dip in U.S. revenue during the second quarter, primarily due to a social media-fueled boycott of its top-selling Bud Light beer. Moreover, in June, Bud Light relinquished its title of America’s top-selling beer, a position held for more than two decades, succumbing to Mexican lager Modelo Especial.
This sudden turn of events creates an uncertain near-term outlook for BUD, and I think this might not be the optimal entry point in the brewery’s stock.
The brewer’s second-quarter revenue in the U.S. saw a significant 10.5% drop. Concurrently, operating profits took a near 30% hit. Despite these setbacks, BUD managed a surge in global profits owing to price hikes and enhanced sales in markets outside the U.S.
However, the steep 28.1% year-over-year slump in Bud Light volumes in the week ending August 13 raises concerns. “Continued weakness begs the question of whether Anheuser-Busch InBev and/or its distributors will have to make significant structural changes to reduce their cost basis if trends don’t improve over the next few months,” Evercore ISI analyst Robert Ottenstein said.
The stock is currently trading below its 50-day and 200-day moving averages of $56.93 and $59.31, respectively.
Taking this into consideration, it is paramount that we delve deeper into BUD’s key financial trends to comprehend the broader picture.
Anheuser-Busch Inbev: Analyzing Financial Health and Earnings Performance (2020-2023)
The data represents the fluctuations and trends in the trailing-12-month net income of BUD. Over the observed period, there is a significant change in the company’s net income.
- At the start of the period on December 31, 2020, the reported net income was a loss of $650 million.
- By June 30, 2021, there was an impressive recovery as the net income increases dramatically to $5.76 billion.
- By the end of 2021, on December 31, the net income slightly declined to $4.67 billion.
- The net income continued to fluctuate, dropping to $3.90 billion by June 30, 2022.
- However, it proceeded to recover later that year, reaching $5.97 billion by December 31, 2022.
- The most recent figure from June 30, 2023, shows a continual rise to $6.25 billion, making it the highest figure in the observed period.
Due to this variation, the growth rate from the initial net income loss of $650 million at the end of 2020 to the most recent net income gain of $6.25 billion in mid-2023 represents a substantial increase. This indicates a significant improvement in the company’s financial performance, especially considering the turnaround from an initial net loss. However, there were fluctuations during the period.

The trailing-12-month revenue of BUD shows a steady upward trend over the observed period (2020-2023).
- At the end of 2020, BUD’s revenue stood at $46.88 billion.
- By mid-2021, the revenue had grown to $51.42 billion, marking an increase.
- The company closed 2021 with a reported revenue of $54.30 billion.
- Mid-2022 saw another significant increase in revenue, which reached $56.50 billion.
- The last recorded revenue value for 2022 was $57.79 billion.
- BUD’s revenue by mid-2023 was $59.09 billion.
Comparing the first recorded data point in December 2020 ($46.88 billion) with the last one in June 2023 ($59.09 billion), it can be calculated that the revenue has experienced a growth rate of approximately 26% over this period. This persistent upward trend and high growth rate suggest a positive financial trajectory for BUD.

Over the observed period, BUD’s gross margin showed a downward trend with some fluctuations.
- In December 2020, BUD’s reported gross margin was at 58.1%.
- The gross margin slightly rose by June 2021, recording a value of 58.2%. However, it eventually decreased to 57.5% in December 2021.
- In 2022, we see a further reduction in gross margin, with 55.9% recorded in June and a further drop to 54.5% by December.
- The trend continues into 2023, with the gross margin decreasing slightly to 54.2% by June.
It is evident that from December 2020 to June 2023, there is an overall decline in the gross margin. Calculating from the first to the last value, we observe an absolute decrease of about 3.9%, indicating a downward trend over this period. This emphasizes the need to closely watch the company’s gross margin performance in the future since it seems to be on a declining trajectory.

The Analyst Price Target for BUD has exhibited important fluctuations over the period. Here’s an overall summary based on the data provided:
- Beginning on November 12, 2021, the Analyst Price Target scored at $64.5 and largely stayed static through December 2021, with a minor rise to $64.56 during the first week of December 2021.
- There was a steady increase starting in January 2022, peaking at $65.75 by the third week of the month, which held consistent through mid-May of the same year.
- Following this plateau, a significant downtrend was experienced in late May, declining from $65.75 to $63.25 by mid-May and eventually bottoming to $60 by the end of July.
- This downward trend intensified from August 2022 through October 2022, when the Price Target plunged to $54.4 on October 7, 2022.
- From November 2022 onwards, there was a gradual recovery, reaching back to $65 by the end of January 2023.
- The Price Target then increased markedly to $70 by the third week of June 2023 before a slight decrease to $69.215 by the end of June. Emphasizing the most recent trends, in July 2023, the price target encountered another drop to $68.5, hovering around this value through August 24, 2023.

BUD Shares Experience Fluctuating Trends from March-August 2023
BUD’s share price seems to have experienced fluctuations, with both upward and downward movements from March 2023 till August 2023. By taking a closer look:
- As of March 3, 2023, the price was at $60.84.
- The lowest value in the same month, on March 17, was $59.92, but it rallied to end the month at $64.81.
- In April, the price began at a higher point, peaking at $66.57 on April 6, 2023, before falling slightly to $65.74 by the end of April.
- May witnessed a decrease in the share value. Starting at $64.51, it steadily declined throughout the month, reaching its lowest point on May 26, 2023, at $57.82.
- Despite some rise and fall, the price continued to decline in June, reaching another low point of $54.18 on June 2, 2023, before slightly rallying to end the month at $56.25.
- The majority of July saw a slight increase in the share value, reaching $58.58 towards the end of the month.
- By August 24, 2023, it had dipped again to stand at $56.44.
In summary, the trend over these months is rather mixed with peaks and troughs. The overall growth rate for the March-August 2023 period seems to be negative, indicating a general decline in the share price of BUD. Here is a chart of BUD’s price over the past 180 days.

Anheuser-Busch InBev: Examination of Sentiment, Stability, and Quality Metrics Through 2023
BUD has an overall C rating, translating to a Neutral in our POWR Ratings system. It is ranked #16 out of the 37 stocks in the Beverages category. Detailed historical performance includes:
- On March 4, 2023, BUD had a POWR grade of A, ranking 7 in its category.
- Over the following weeks until May 6, 2023, with slight fluctuations in category rank, BUD maintained an A grade before dropping to B in the week of May 13, 2023.
- BUD continued to hold a B grade from mid-May to early August 2023, experiencing a gradual increase in its category rank that reached 18 on July 8, 2023.
- Continuing with a B grade, BUD fluctuated within the ranks of 15 to 16 over subsequent weeks.
- The POWR grade of BUD was downgraded to C on August 9, 2023, and it held this grade through the most recent data point on August 24, 2023. During this period, BUD’s rank oscillated between 15 and 16 in its category.
It is important to note that lower numbers in rank in category indicate a superior rank.
For BUD, the three most noteworthy POWR Ratings dimensions focus on Sentiment, Stability, and Quality. Let’s dive into these over several months. February 2023:
- The Sentiment score was at the top, with a rating of 84.
- Stability also held a high rating, matching Sentiment at 84.
- Quality represented the third-highest dimension during this period, reaching a score of 51.
As we moved into March 2023:
- Sentiment marginally increased to 86, maintaining its high position.
- Even though the Stability score slightly decreased to 82, it stayed within the top three ratings.
- Quality took a notable leap, jumping to the second spot with a score of 78.
April 2023 saw some interesting developments in the top three dimensions:
- Sentiment bolstered its score to an impressive 92, showing an increasing trend.
- Quality further grew to reach a rating of 82, demonstrating a consistent growth pattern across the months.
- Despite a slight decrease to 81, Stability sustained its position as one of the top-performing dimensions.
The trends made a transposition in May and June 2023. During May, the Sentiment, Quality, and Stability scores were reduced to 75, 72, and 80, respectively. In June, all dimensions showed a decline, with Sentiment plunging to 53, Quality dropping to 64, and Stability marking a slight downshift to 77.
In July 2023, there was a marginal uptick in the Sentiment score, moving up to 60. However, Quality continued to decline, falling to 63, whereas Stability maintained its score of 77.
Finally, by August 2023, Sentiment had climbed back to a higher score of 77. Quality registered a mild growth to 70 while Stability, maintaining high ratings throughout, crept upward to 82.
The Sentiment dimension consecutively held the highest ratings for several months before experiencing a notable dip between May and July 2023. Afterwards, it made a robust comeback to regain a high score in August 2023. Stability showed a marginal but consistent decline until August when it bounced back slightly. Quality exhibited an intriguing pattern of sharp growth until April, followed by a steady drop from May to July and a slight recovery by August.

How does Anheuser-Busch InBev SA/NV (BUD) Stack Up Against its Peers?
Other stocks in the Beverages sector that may be worth considering are Primo Water Corporation (PRMW), Coca-Cola Consolidated, Inc. (COKE), and Suntory Beverage & Food Ltd (STBFY) -- they have better POWR Ratings.
What To Do Next?
Get your hands on this special report with 3 low priced companies with tremendous upside potential even in today’s volatile markets:
3 Stocks to DOUBLE This Year >
BUD shares rose $0.35 (+0.62%) in premarket trading Friday. Year-to-date, BUD has declined -5.09%, versus a 15.10% rise in the benchmark S&P 500 index during the same period.
About the Author: Subhasree Kar

Subhasree’s keen interest in financial instruments led her to pursue a career as an investment analyst. After earning a Master’s degree in Economics, she gained knowledge of equity research and portfolio management at Finlatics.
How is Anheuser-Busch InBev (BUD) Faring on Wall Street This Week? StockNews.com


