FedEx Corporation (NYSE:FDX) opened slightly higher on Thursday but bumped into the 200-day simple moving average (SMA), rejected the area as resistance and began to fall lower.
The transportation, e-commerce and services-based company is set to print fourth-quarter and full-year 2022 financial results after the market close.
When FedEx printed its third-quarter earnings on March 17, the stock gapped down the following day and closed the trading session 4% lower.
For the that quarter, FedEx reported earnings of $4.59 per share, which slightly missed the consensus estimate of earnings of $4.64 per share. The company beat on its top line, reporting revenues of $23.6 billion compared to the $23.44 billion consensus estimate.
For the fourth quarter, analysts expect FedEx to report earnings of $6.87 per share on revenues of $24.57 billion.
For the full year 2022, FedEx expects to report strong growth, with an adjusted EPS of $20.50 to $21.50 versus the $20.61 consensus estimate.
The reaction FedEx receives post-earnings is likely to be the deciding factor on whether the stock will trade in bullish or bearish territory for the time being. Although the stock is trading in an uptrend, Fedex looks to be printing a bearish daily candlestick.
Of course, holding stocks or options over an earnings print is akin to gambling because stocks can react bullishly to an earnings miss and bearishly to an earnings beat. Options traders particularly, those who are holding close dated calls or puts, take on extra risk because the intuitions writing the options increase premiums to account for implied volatility.
The implied move for options of FedEx expiring this week is 6.86%.
Want direct analysis? Find me in the BZ Pro lounge! Click here for a free trial.
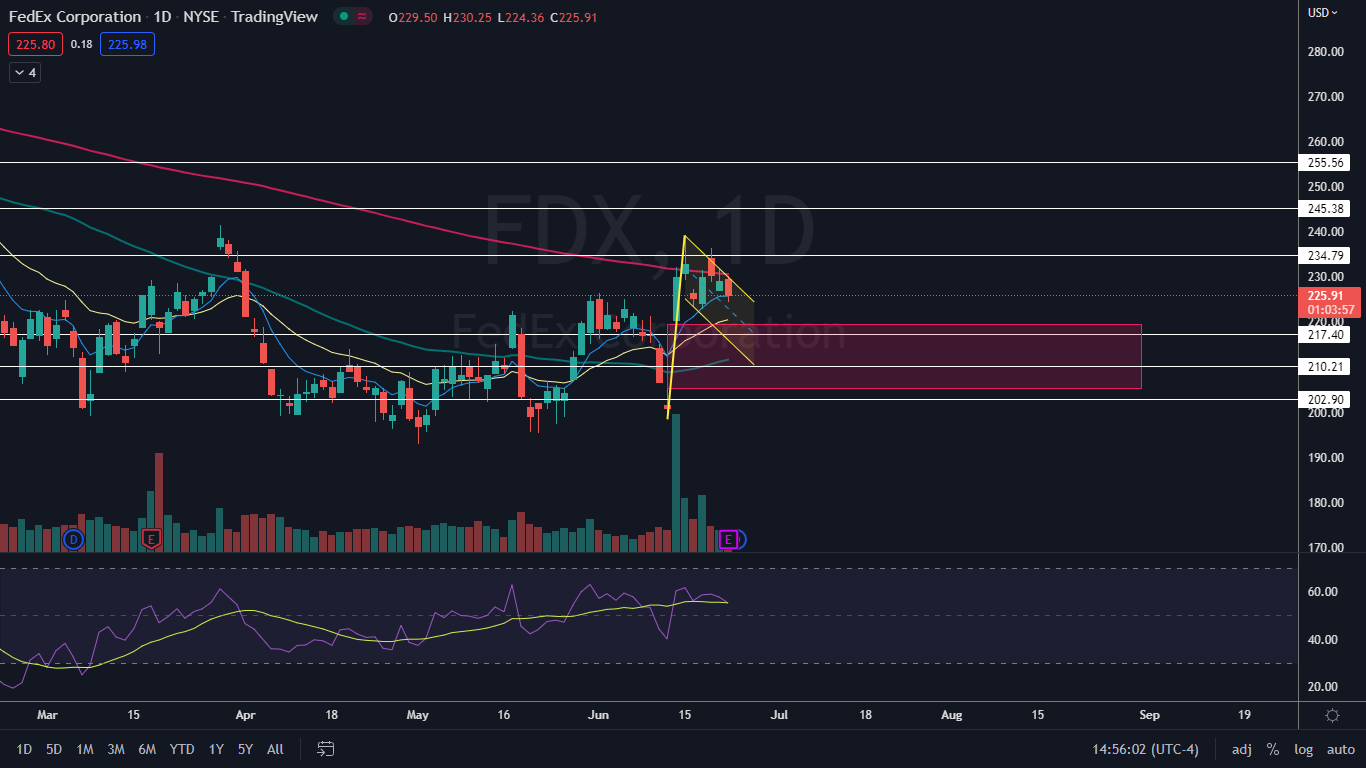
The FedEx Chart: FedEx soared 20% between June 13 and June 15 and has since been consolidating the sharp rise within a slight downtrend. The move higher paired with the downward consolidation may be forming the stock into a bull flag pattern on the daily chart. If the pattern is recognized, the measured move could take FedEx toward the $269 level.
- Traders can watch for a break from the upper descending trendline of the flag formation on higher-than-average volume to indicate if the pattern has been recognized. If FedEx suffers a bearish reaction to its earnings print, the downtrend is likely to become the dominant pattern, and traders can watch for the stock to print a lower low under the most recent low of $223.41, which was created on June 16.
- There is a gap below on FedEx’s chart between $205.05 and $219.58. Gaps on charts fill about 90% of the time, which makes it likely the stock will fall down to fill the empty trading range in the future.
- If FedEx is able to break up bullishly from the flag pattern, the stock will regain the 200-day SMA, which would set FedEx into a possible bull cycle from a technical analysis standpoint. If a bearish reaction occurs, FedEx is likely to lose support at the eight-day exponential moving average, which may guide the stock lower.
- FedEx has resistance above at $234.79 and $245.38 and support below at $217.40 and $210.21.