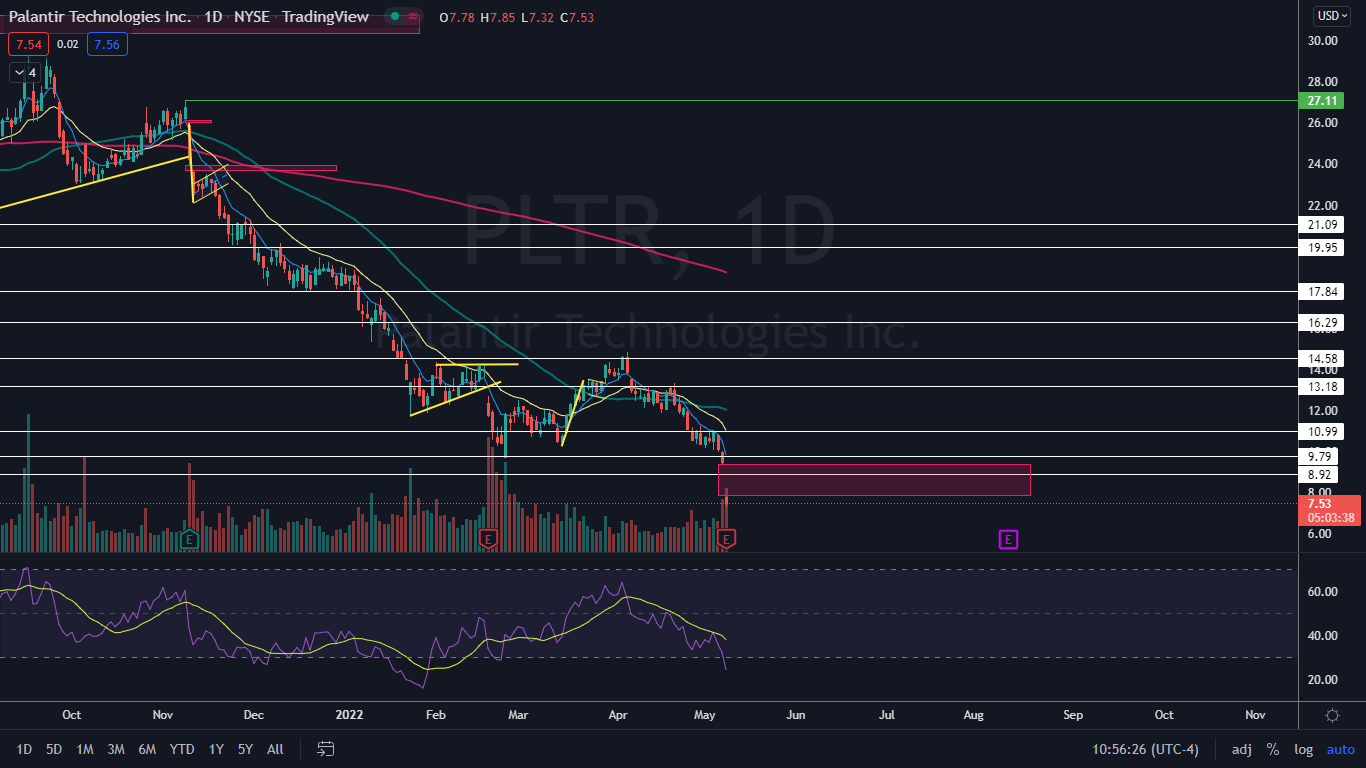
Palantir Technologies, Inc (NYSE:PLTR) fell to a new all-time low of $7.32 on Monday after printing mixed first-quarter financial results and guiding its second-quarter revenue below analyst estimates.
Palantir reported quarterly earnings of 2 cents per share, which missed the 4-cent analyst consensus estimate, but sales of $446.00 million, beating the consensus estimate of $443.42 million. For the second quarter, Palantir said it expects quarterly sales of $470 million, which is below the $483.84 million estimate.
The news accelerated Palantir’s downtrend, which the stock most recently fell into on April 5, losing 50% of its value since that date. Over the monthly timeframe, Palantir has been in a heavy downtrend since reaching an all-time high of $45 on Jan. 27, 2021, having plummeted about 83% over the time period.
At least a temporary bounce to the upside is likely to come over the next few days, because Palantir has developed signals on the chart that indicate a reversal will take place.
Want direct analysis? Find me in the BZ Pro lounge! Click here for a free trial.
The Palantir Chart: Palantir has developed three possible signals a bounce is likely to come, although taking trades that are anti-trend, especially in a bear market, is risky and patience is required.
First, Palantir is trading lower on higher-than-average volume. At press time, over 74 million Palantir shares had exchanged hands, compared to the 10-day average of 42.16 million. Traders can watch for a bearish volume climax to occur, indicating the bears have become exhausted, which is often followed by a bounce.
Second, Palantir’s relative strength index (RSI) has dropped to the 24% level, which has put the stock into oversold territory. When a stock’s RSI reaches or falls below the 30% mark, it can be a buy signal for technical traders, although it's important to note that an RSI can remain extended in both directions for long periods of time.
Third, Palantir has created a gap above between $7.85 and $9.42. Gaps on charts fill about 90% of the time, which makes it likely Palantir will trade up to fill the empty trading range in the future.
Of course, Palantir is currently in a downtrend and the bears are squarely in control. Bearish traders who aren’t already in a position can watch for Palantir to eventually spike upwards to print the next consecutive lower high in the pattern.
Palantir has resistance above at $8.92 and $9.79. There is no support below the all-time low.

See Also: How to Read Candlestick Charts for Beginners
Photo: Courtesy of Cory Doctorow on Flickr


