AMC Entertainment Holdings, Inc (NYSE:AMC) was down almost 4% Tuesday after a big bullish day on Monday saw the stock close up 13.31% higher.
"Top Gun: Maverick," has brought in more than $1 billion at the global box office since it was released on May 27, becoming the most successful film of Tom Cruise’s career, 36 years after the original “Top Gun” was released. AMC CEO Adam Aron took to Twitter on Sunday to revel in the film’s success and write, “who in the ---- can still say movie theatres are dead and have no future?”
AMC also received a boost on Monday due to being added to the Russell 1000 index after the markets closed on Friday. In order for a company to graduate from the Russell 2000 to the Russell 1000, it must have a market cap of at least $7.3 billion as of the cutoff date on May 6. Thanks largely to AMC’s massive retail following and promotion, the stock was promoted to the more exclusive ETF with a $7.5 billion market cap.
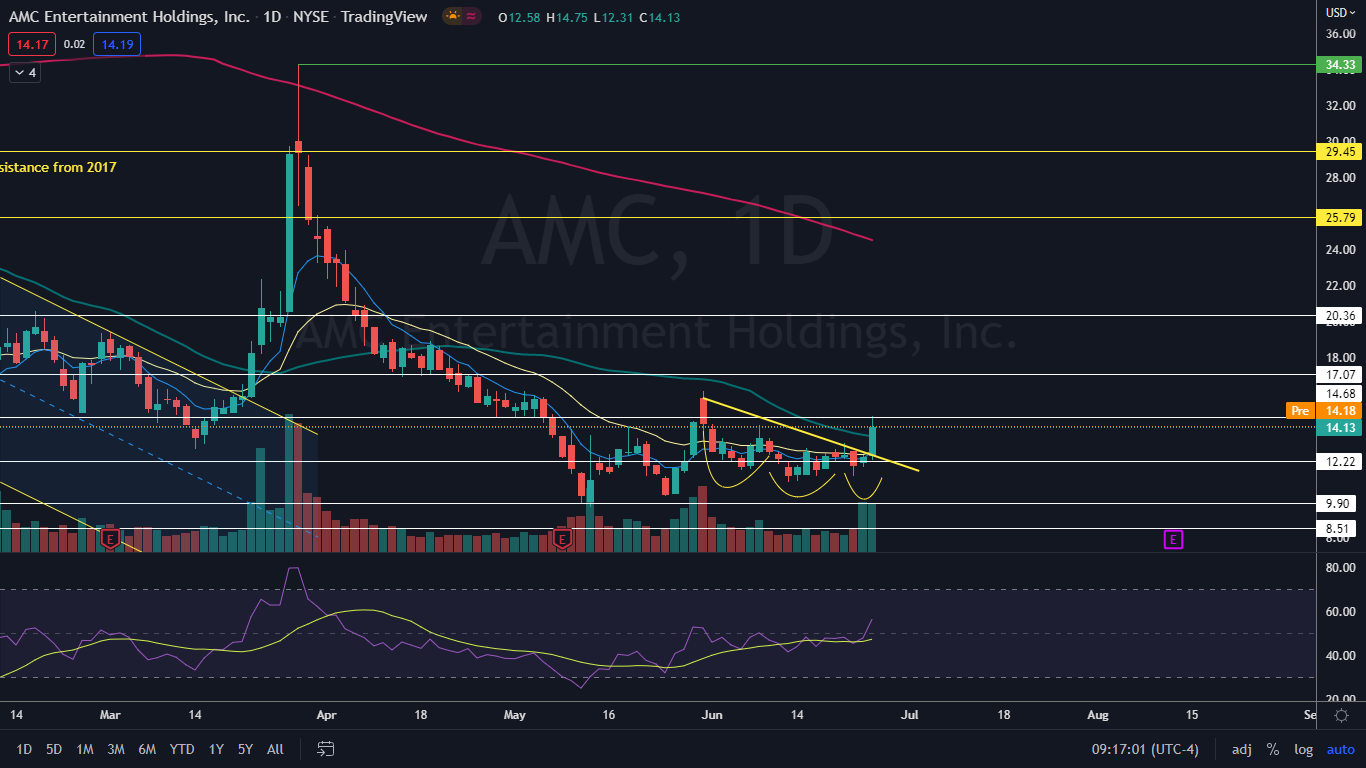
Adding to the fundamental reasons for AMC’s surge on Monday, the stock had technical reasons for a reversal to the upside, because between May 31 and Friday, AMC had settled itself into a head-and-shoulders pattern on the daily chart.
AMC looks set to trade higher still but traders and investors should note the S&P 500 remains in an official bear market, which can hamper bullish moves on individual stocks.
Want direct analysis? Find me in the BZ Pro lounge! Click here for a free trial.
The AMC Chart: AMC’s head-and-shoulders pattern developed with the left shoulder between the dates of May 31 and June 8, the head between June 9 and June 21 and the smaller right shoulder between Wednesday and Friday of last week. On Monday, AMC reacted to the pattern and broke up bullishly from the downward sloping neckline on higher-than-average volume, which indicates the pattern was recognized.
When AMC reached a low of $11.09 on June 13 and retested the level on the following trading day, the stock also printed a bullish double bottom pattern and reversed course into an uptrend. The most recent higher low within that pattern was printed on Thursday at $11.44 and the most recent confirmed higher high was formed at the $13.22 level the day prior.
On Monday, AMC rallied up above the most recent higher high and printed a big bullish Marubozu candlestick, which could indicate higher prices will come again on Tuesday. An equally likely scenario is that AMC will print an inside bar pattern to consolidate Monday’s big move.
Eventually, AMC will need to retrace lower to print its next higher low and traders and investors who aren’t already in a position will want to see the stock print a bullish reversal candlestick above $11.50. Bearish traders will want to see the stock drop below that level to negate the uptrend and push the stock down under the sloping neckline of the head-and-shoulders.
AMC has resistance above at $14.68 and $17.07 and support below at $12.22 and $9.80.

Photo: Created with an image from Valerie Reneé on flickr


