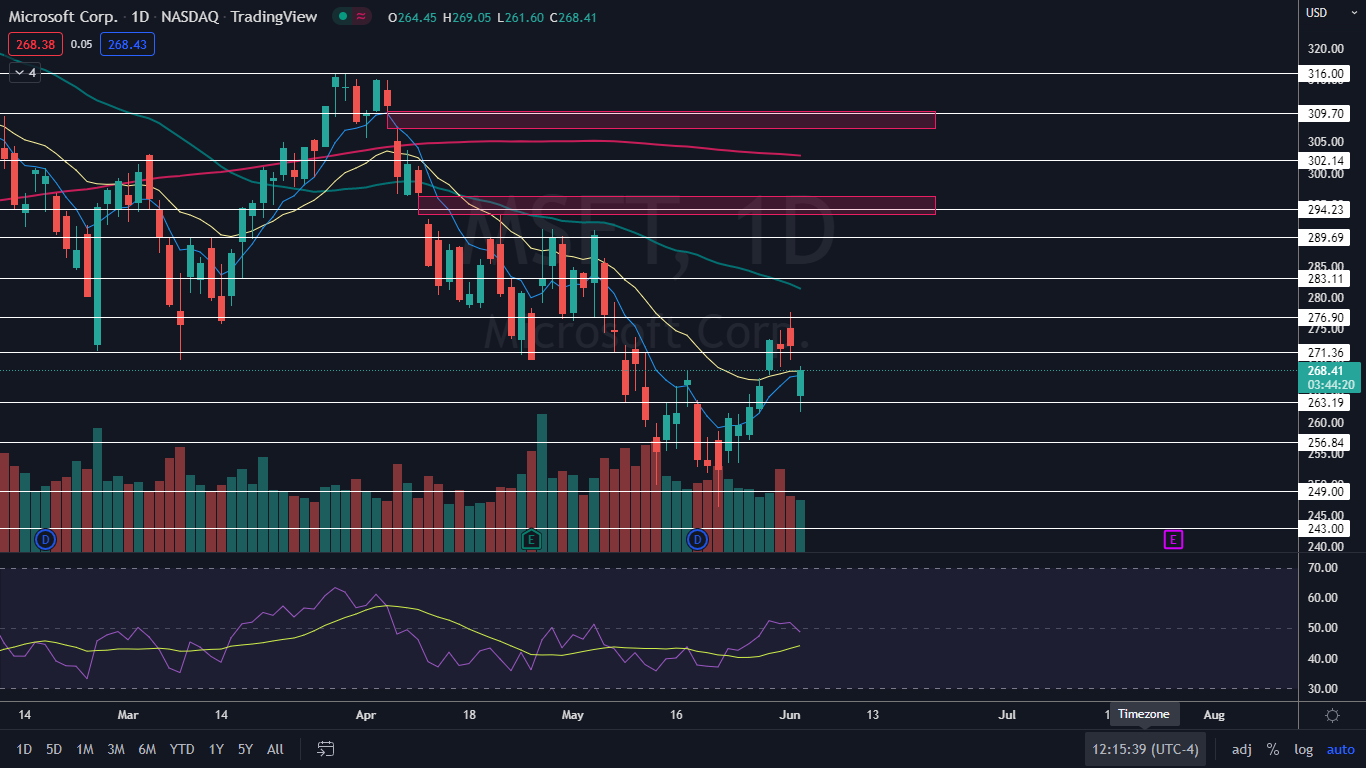
Microsoft Corporation (NASDAQ:MSFT) gapped down almost 3% lower on Thursday after lowering its fourth-quarter guidance down from an estimated EPS of between $2.28 and $2.35 to a new range of $2.24 and $2.32. Analyst estimates for the quarter came in at $2.33.
Intraday, Microsoft was working to erase the loss, trading up about 1.65% off the opening amid a reversal in the general markets, which saw the S&P 500 up about 0.8%.
Microsoft is the latest tech stock to lower its projected earnings. On May 24, Snap, Inc (NYSE:SNAP) lowered its estimated revenues for the second quarter, citing deteriorating macroeconomic factors that have negatively impacted its business; The stock plummeted 40% the following trading day.
Companies are feeling the effects of soaring inflation and rising interest rates and the Federal Reserve is currently walking a tight rope to lower inflation without throwing the U.S. into a recession, the latter of which could drop Microsoft's revenues substantially.
Investors are also unsure of whether the quantitative tightening that began on Wednesday is priced in and how that will affect the market. The gap down on Microsoft may just be a healthy corrective retracement in an uptrend, however, as the stock works to print a higher low.
Want direct analysis? Find me in the BZ Pro lounge! Click here for a free trial.
The Microsoft Chart: Microsoft negated its downtrend on May 27, when the stock shot up above the most recent lower high, which was printed on May 17 at $268.33. If Thursday’s low-of-day serves as a higher low, an uptrend will confirm, making a higher high above Wednesday’s high-of-day at the $277.69 level a possibility.
- If Microsoft closes the trading day near its high-of-day price or flat, the stock will print a hammer candlestick or doji candlestick, respectively, on the daily chart, which could indicate higher prices will come on Friday. If the stock closes the session near its low-of-day, the long upper wick could suggest the stock will trade lower over the coming trading days.
- Microsoft has two gaps above on its chart, with the first between $293.30 and $296.28 and the second gap between $307 and $309.87. Gaps on charts fill about 90% of the time, which makes it likely the stock will rise up to fill the empty trading ranges at some point in the future.
- Microsoft has resistance above at $271.36 and $276.90 and support below at $263.19 and $256.84.


