Microsoft Corporation (NASDAQ:MSFT) was trading about 2.5% lower in the premarket on Monday, in sympathy with the futures market, which was declining about 2.4%.
On Saturday, Benzinga reported that Barron’s Angela Palumbo wrote that the tech giant may make the decision to halt its advertising campaigns on television in order to cut costs.
The tech sector has begun to take the brunt of recession fears. When the Labor Department released the consumer price index (CPI) on Friday for the month of May, it showed the Federal Reserve is losing the fight against inflation. The CPI came in at 8.6% compared to the consensus estimate of 8.3%, which spooked investors, causing the S&P 500 to plunge almost 3%. The ETF dragged many stocks down with it, including Microsoft, which closed that trading day down 4.46%.
As recession fears loom and the cost of necessities sharply increases, consumers tighten their pocketbooks, spending less on luxury items such as new computers and software.
From a technical perspective, Microsoft looks headed for more downside, although a bounce up to at least form another lower high is likely to come over the next few days.
Want direct analysis? Find me in the BZ Pro lounge! Click here for a free trial.
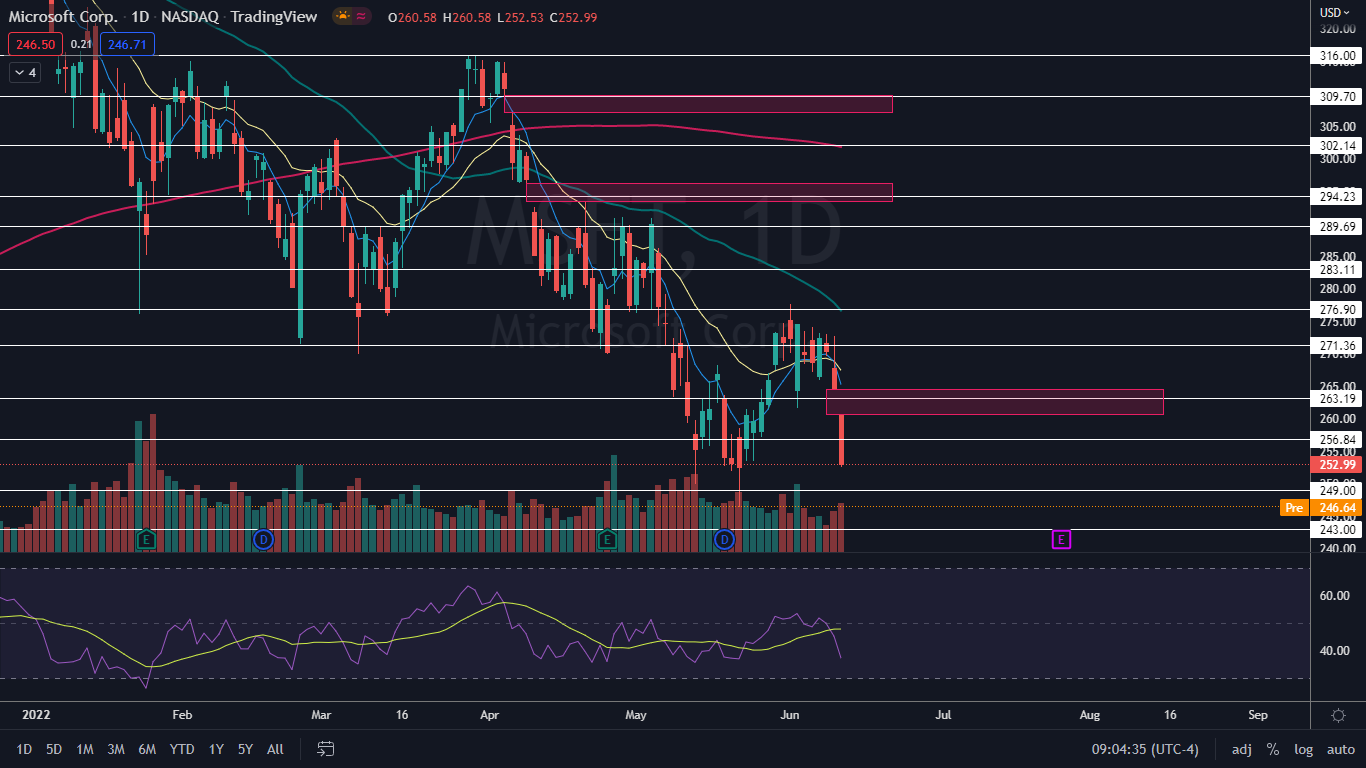
The Microsoft Chart: When Microsoft fell on Friday, the stock confirmed it’s trading in a downtrend, with the most recent lower high printed on June 8 at $273 and the most recent confirmed lower low formed at the $265.94 mark the day prior. On Friday, Microsoft printed a lower low, but Monday’s candlestick will need to print in order to confirm whether the next low has been formed and a lower high is in the cards.
- When Microsoft gapped down on Friday and then closed the trading day near its low-of-day price, the stock printed a bearish Marubozu candlestick, which indicates lower prices are likely to come on Monday. The second most likely scenario is that an inside bar pattern will form and consolidation will take place, which would lean bearish because the stock was trading lower before forming the pattern.
- Microsoft gapped down on Monday, and the stock’s relative strength index is likely to reach toward the 30% level, which could indicate a relief bounce is in the cards. When a stock’s RSI reaches or nears that level, it becomes oversold, which can be a buy signal for technical traders.
- Aggressive bullish traders may choose to watch for a reversal candlestick on smaller timeframes to indicate a bounce is on the way and then watch for another reversal candlestick to form at the top of the bounce, which is most likely to occur below the most recent lower high.
- Bearish traders will want to see continued high bearish volume push the stock down below the $250 level, which is important psychological support.
- Microsoft has resistance above at $256.84 and $263.19 and support below at $249 and $243.


