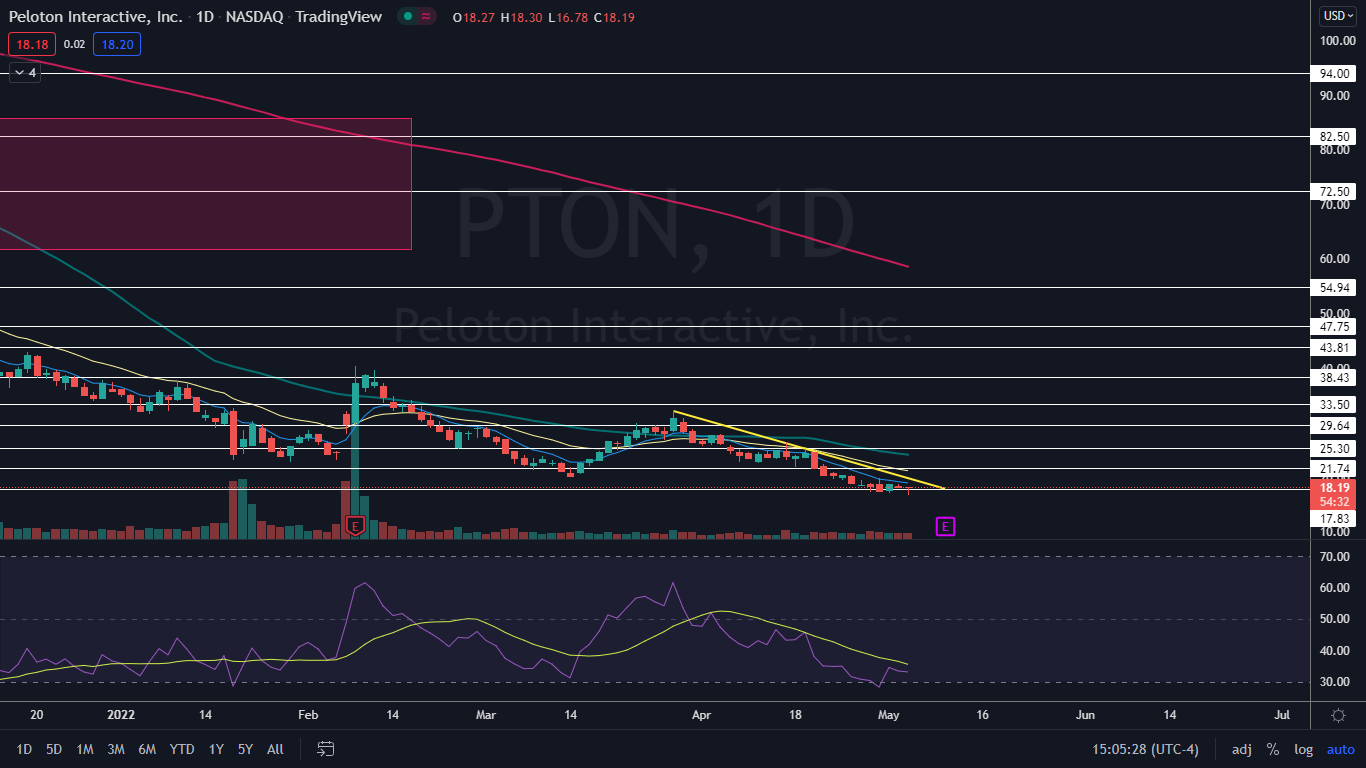
Peloton Interactive, Inc (NASDAQ:PTON) reached a new all-time low on Wednesday, falling to the $16.78 mark before bouncing up slightly from the level.
The exercise equipment company has been heavily beaten down, plunging almost 90% from the Jan. 14 all-time high of 171.09 to Wednesday’s low-of-day.
Peloton’s most recent downtrend has developed under a descending trendline on the daily chart. A descending trendline acts as a resistance level and indicates there are more sellers than buyers even though the price continues to fall.
In order for a trendline to be considered valid, the stock or crypto must touch the line on at least three occasions. After that, the more times the trendline is touched the weaker it becomes.
- Bullish traders can watch for a stock or crypto to break up from the descending trendline and, if the break happens on high volume, can indicate the downtrend is over and a rally may be on the horizon. It's possible the stock or crypto may fall down to back-test the descending trendline as support before heading higher again.
- For bearish traders “the trend is your friend” (until it’s not) and a touch and rejection of the descending trendline can offer a good short entry. A bearish trader would stop out of this type of trade if the stock or crypto broke above the trendline.
See Also: How to Read Candlestick Charts for Beginners
The Bull Case for Peloton: Under the descending trendline, Peloton may be working to print a triple bottom pattern near the $17 mark, when Wednesday’s price action is compared with the price action on Friday and Monday at that level. If the triple bottom pattern is recognized, Peloton may gain enough power to break up from the descending trendline and enter into a new uptrend.
- At least a bounce is likely to occur over the coming days because Peloton’s relative strength index (RSI) is measuring in at the 30% level. When a stock’s RSI reaches that level, or falls below the area, it becomes oversold, which can be a buy signal for technical traders.
- Peloton has resistance above at $17.83 and $21.74.
Want direct analysis? Find me in the BZ Pro lounge! Click here for a free trial.
The Bear Case for Peloton: If the potential triple bottom pattern isn’t recognized and Peloton is unable to bring in the buyers required to break the stock up from the descending trendline, the resistance at that level will continue to push the stock lower.
- Peloton is trading below the eight-day and 21-day exponential moving averages, with the eight-day EMA trending below the 21-day, both of which are bearish indicators. The moving averages have been acting as strong resistance since March 31, guiding the stock lower, which is likely to continue if volume remains low.
- Peloton doesn’t have support below in terms of price history but there is psychological support at $15 and $10.


