Over the weekend, I wanted to go through dozens of charts. I wanted a lay of the land and to get an idea of just what sort of technical damage was done to the markets on Friday.
Aside from the usual starting points — like the S&P 500 and Nasdaq — I wanted to home in on individual stocks as well. Naturally, the market leaders and FAANG stocks were among the first.
After going through all the FAANG charts, Apple (AAPL) clearly had the strongest chart of the bunch (even when we added Microsoft (MSFT) to the mix as well).
Apple’s rally sent the stock to within 3.7% of its all-time high from January and within a stone’s throw of major resistance.
The rally was apparent in both Apple and Amazon (AMZN), as the two “A's” of FAANG helped power the market higher.
Confidence in iPhone demand helped power the move, while the company’s recently announced iPhone event for Sept. 7 also triggered more buying in the stock (here’s what to expect from that event).
As for the charts, this is how the best-looking FAANG stock is shaping up right now.
Buy the Dip in Apple Stock?
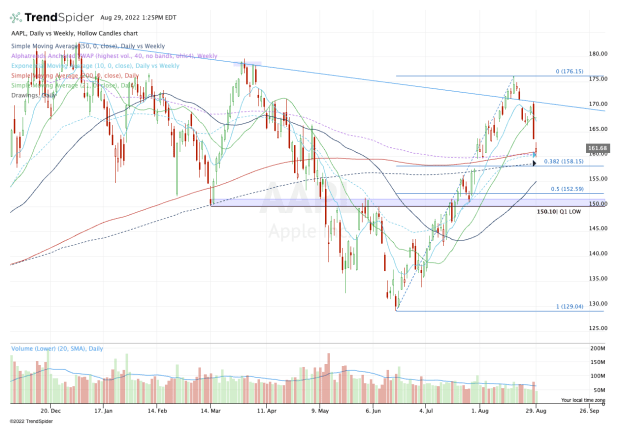
Chart courtesy of TrendSpider.com
What a herculean effort Apple stock gave in its rally off the June low!
The shares burst higher, rallying for six straight weeks and in seven out of eight weeks off the low. In all, the shares put together a total rally of 36.5%.
Not too shabby for a multitrillion-dollar enterprise.
In any regard, Apple stock is starting this week off with a loss as it gaps into a key area on the chart. Around $161, the stock finds its weekly VWAP measure, as well as the 10-week and 200-day moving averages. So far, Apple is bouncing from this area.
Should the stock take out Monday’s low and push lower, the $158 area is in play. There we find the 38.2% retracement of the current rally, as well as the 50-week moving average.
I can’t help but notice how Apple stock has, for the lack of a better word, “danced” around downtrend resistance this month (blue line). Since the stock was most recently rejected from this area, current support is even more critical.
While a break of this area may not immediately crush the stock, it does create rather obvious bearish observations. The 50-day is notable, but a break from this current support area would have me watching the $150 to $152.50 zone.
There Apple stock finds a key support/resistance zone from this year, as well as the more meaningful 50% retracement of the current rally.
Again, that’s not to say the 50-day is not relevant — it is — but a break of this secondary zone between $150 to $152.50 would deal a huge blow to the long case for Apple.
For now, keep $158 to $161 in mind. This zone is very key in short term to keep the charts intact.

.png?w=600)