
The bear market roared throughout 2022.
In a somewhat cruel twist, the S&P 500 hit an all-time high on Jan. 4, the second trading day of the new year. From that point on, it's been a feast for the bears.
As inflation was raging at the start of the year, the Federal Reserve was caught behind the eight ball and forced to engage in a series of aggressive rate hikes in an effort to curb inflation.
Between rising interest rates and worries about a recession, stock bulls have their work cut out for them this year. Here’s how the technicals are setting up for 2023.
Looking at the S&P 500 for 2023
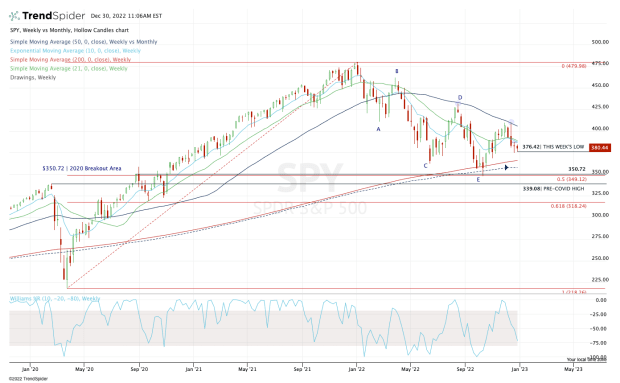
Chart courtesy of TrendSpider.com
Earlier this year, I kept a major focus on the $350 area for the SPDR S&P 500 ETF Trust (SPY). That’s as it contained the 50-month moving average, the 50% retracement area and a major breakout zone in 2020.
After a strong rally, though, the SPY is finding resistance at the declining 50-week moving average for the second time in a row.
Now, with the SPY hovering around $380, we're at the midpoint of the recent range and setting up for an inside week. With several overhead downtrends ahead of it, the SPY has a bearish look.
A break of the $375 area likely opens the door down to the 200-week moving average. If it fails as support, that opens the door back down to the $350 area and the SPY’s 52-week low.
Below that and it’s possible for the SPY to retest its pre-covid high near $339, followed by a potential dip down to the 61.8% retracement at $318. That would imply a decline of roughly 33% from the all-time high.
So what do the bulls need to do?
In the short-term, it would be helpful for the SPY to reclaim the 10-week and 21-week moving averages. But for a sustainable uptrend to form, it needs to reclaim the 50-week moving average and put in a higher low.
From there, it has the potential to put in a higher high and start forming a new uptrend.
Traders must come to terms with the possibility that we won’t make new all-time highs in 2023. It’s possible we are range-bound next year and stock-picking becomes much more important for traders to succeed.
Looking at the Nasdaq for 2023
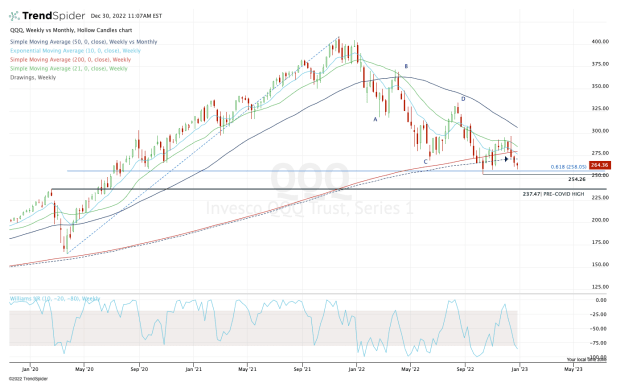
Chart courtesy of TrendSpider.com
Tech has badly lagged the rest of the market this year, made evident by the year-to-date loss of 33.6% for the PowerShares QQQ Trust (QQQ).
The QQQ is trading below all of its major weekly moving averages, as well as the 50-month moving average.
It’s holding up above the 61.8% retracement and the current low for the year near $254.
If the QQQ can clear the $292 to $295 area, it opens the door for a rally up to the declining 50-week moving average, a measure it hasn’t tested once since April (unlike the SPY).
On the downside, if the QQQ takes out the low and fails to stay above $250, it’s possible we get a test of the $237 to $240 area, which is the pre-covid high. In that scenario, long-term bulls ought to pay attention.
That would mean the QQQ ETF is down about 40% from its all-time high. Historically, that’s been a good buying opportunity for long-term investors. It would likely also mean that companies like Apple (AAPL) are lingering near a key area on the charts.