Alibaba (BABA) has been in the news a lot lately, and as one might guess, the stock has been volatile.
On Friday the shares sank 11% on reports that the company could be delisted from the NYSE under the Holding Foreign Companies Accountable Act.
On Monday, the stock posted a meager recovery, up 1%, as management said the company would “strive” to remain publicly traded on a U.S. exchange.
On Tuesday, the shares opened lower by more than 2% — and fell almost 4% in premarket trading — as Chinese equities traded lower over worries about House Speaker Nancy Pelosi’s visit to Taiwan.
Getting lost in the shuffle is news that Alibaba and Xpeng (XPEV) — Tesla’s (TSLA) rival in China — are teaming up to work on self-driving cars.
At last check the shares are 3% higher as the bulls absorb all the news. It’s got investors wondering whether Alibaba stock has bottomed or if more downside is in store.
Trading Alibaba Stock

Chart courtesy of TrendSpider.com
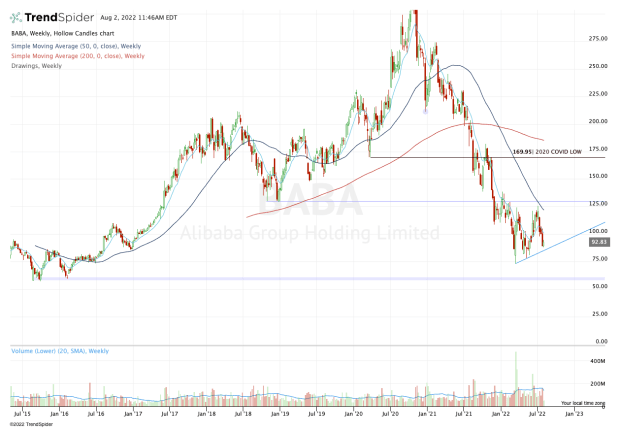
While it’s nice to see Alibaba stock rally on Tuesday, investors must remember that the stock had fallen more than 26% over the prior three weeks. Further, the shares remain 33% below the 2022 high and 54% below the 52-week high.
Put another way, the price action here has been very unhealthy.
The weekly chart above does a good job highlighting that action but also shows a silver lining. Despite the three-week pullback, Alibaba stock continues to make a series of higher lows. Even amid the pullback, it did not break its uptrend.
If it can regain $100 and the 10-week moving average, it opens the door to a potentially larger rally. That’s especially true given the negativity of the news and sentiment in the stock.
Specifically, a close above these levels could trigger a move up to the 50-week moving average and resistance near $125. Above that could put the $138 area in play, which was a key support/resistance pivot earlier this year.
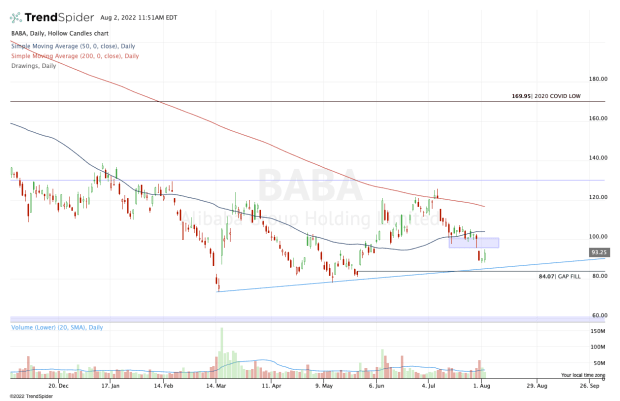
Let’s zoom in with a daily chart.

Chart courtesy of TrendSpider.com
So far, Alibaba stock has done a good job hammering out a three-day low near $88. If this fails, however, it opens the door down to the $84 to $85 area. While that may seem like a small drop, Alibaba will find the gap-fill level and uptrend support in this region.
If it fails as support, the $75 to $77 area is in play and it’s key. A break of that zone could usher in new lows and ultimately put the all-time lows and major support in play near $60.
So what’s the bottom line? The stock is looking better today but is fresh off some big losses.
If Alibaba can clear $100 and the 10-week moving average, more upside could be in store. Otherwise, exercise caution.


