
Our GPU benchmarks hierarchy ranks all the current and previous generation graphics cards by performance, and Tom's Hardware exhaustively benchmarks current and previous generation GPUs, including all of the best graphics cards. Whether it's playing games, running artificial intelligence workloads like Stable Diffusion, or doing professional video editing, your graphics card typically plays the biggest role in determining performance — even the best CPUs for Gaming take a secondary role. Current GPU prices are slowly trending down as well, though the new cards are all holding relatively steady.
We're nearly finished retesting all of the ray-tracing capable GPUs on a slightly revamped test suite, using a Core i9-13900K instead of a Core i9-12900K. For now, we have the same test suite we used in 2022. Our latest addition to the hierarchy is the Nvidia RTX 4060 Ti 16GB — a disappointing card that costs too much and delivers too little.
Our full GPU hierarchy using traditional rendering (aka, rasterization) comes first, and below that we have our ray tracing GPU benchmarks hierarchy. Those of course require a ray tracing capable GPU so only AMD's RX 7000/6000-series, Intel's Arc, and Nvidia's RTX cards are present. The results are all without enabling DLSS, FSR, or XeSS on the various cards, mind you.
We've added the GeForce RTX 4060 Ti 16GB to the hierarchy and updated the charts. At 1080p and 1440p, performance is very nearly identical to the 8GB variant, but it costs $100 more.
Nvidia's Ada Lovelace architecture powers its latest generation RTX 40-series, with new features like DLSS 3 Frame Generation — and for all RTX cards, Nvidia DLSS 3.5 Ray Reconstruction is coming this fall. AMD's RDNA 3 architecture powers the RX 7000-series, with only three desktop cards presently released, but we expect two more in the next month. Meanwhile, Intel's Arc Alchemist architecture brings a third player into the dedicated GPU party, even if it's more of a competitor for the previous generation midrange offerings.
On page two, you'll find our 2020–2021 benchmark suite, which has all of the previous generation GPUs running our older test suite running on a Core i9-9900K testbed. It's no longer being actively updated. We also have the legacy GPU hierarchy (without benchmarks, sorted by theoretical performance) for reference purposes.
The following tables sort everything solely by our performance-based GPU gaming benchmarks, at 1080p "ultra" for the main suite and at 1080p "medium" for the DXR suite. Factors including price, graphics card power consumption, overall efficiency, and features aren't factored into the rankings here. The current 2022/2023 results use an Alder Lake Core i9-12900K testbed. Now let's hit the benchmarks and tables.
GPU Benchmarks Ranking 2023
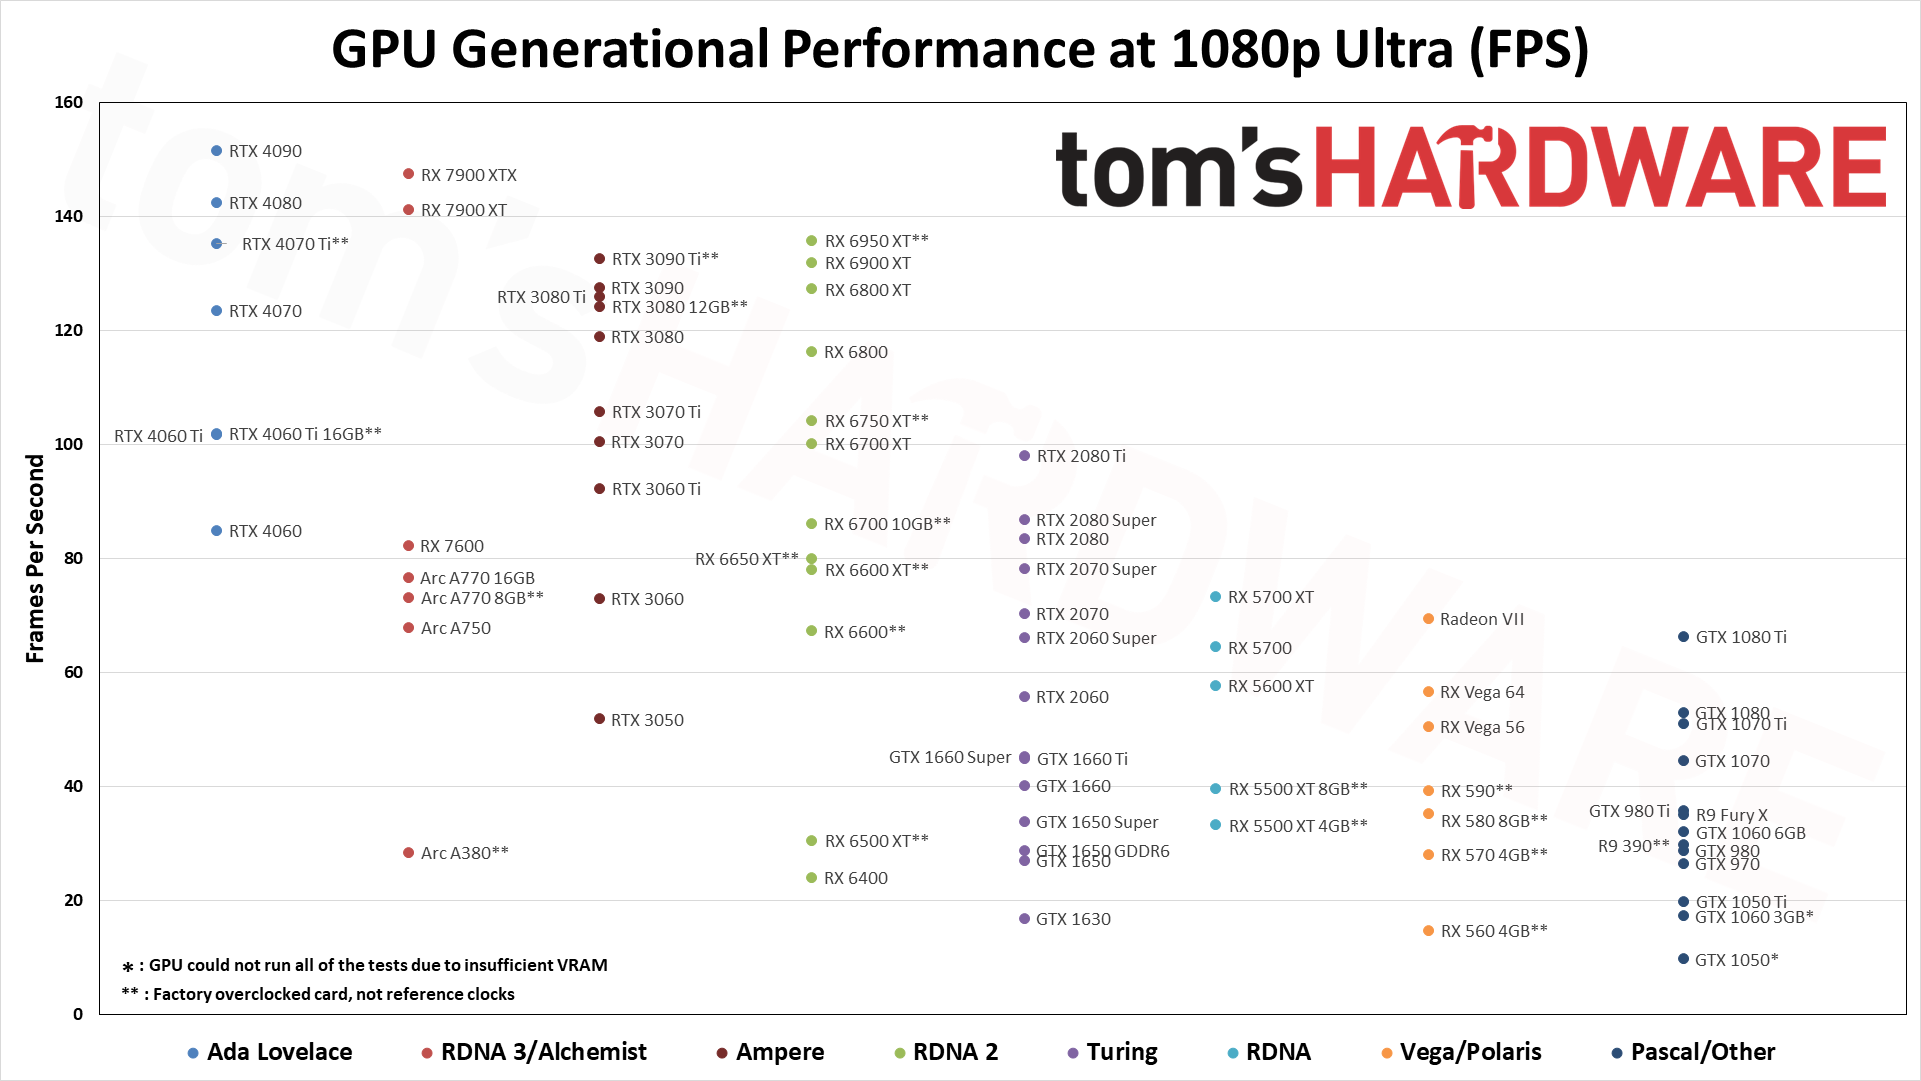
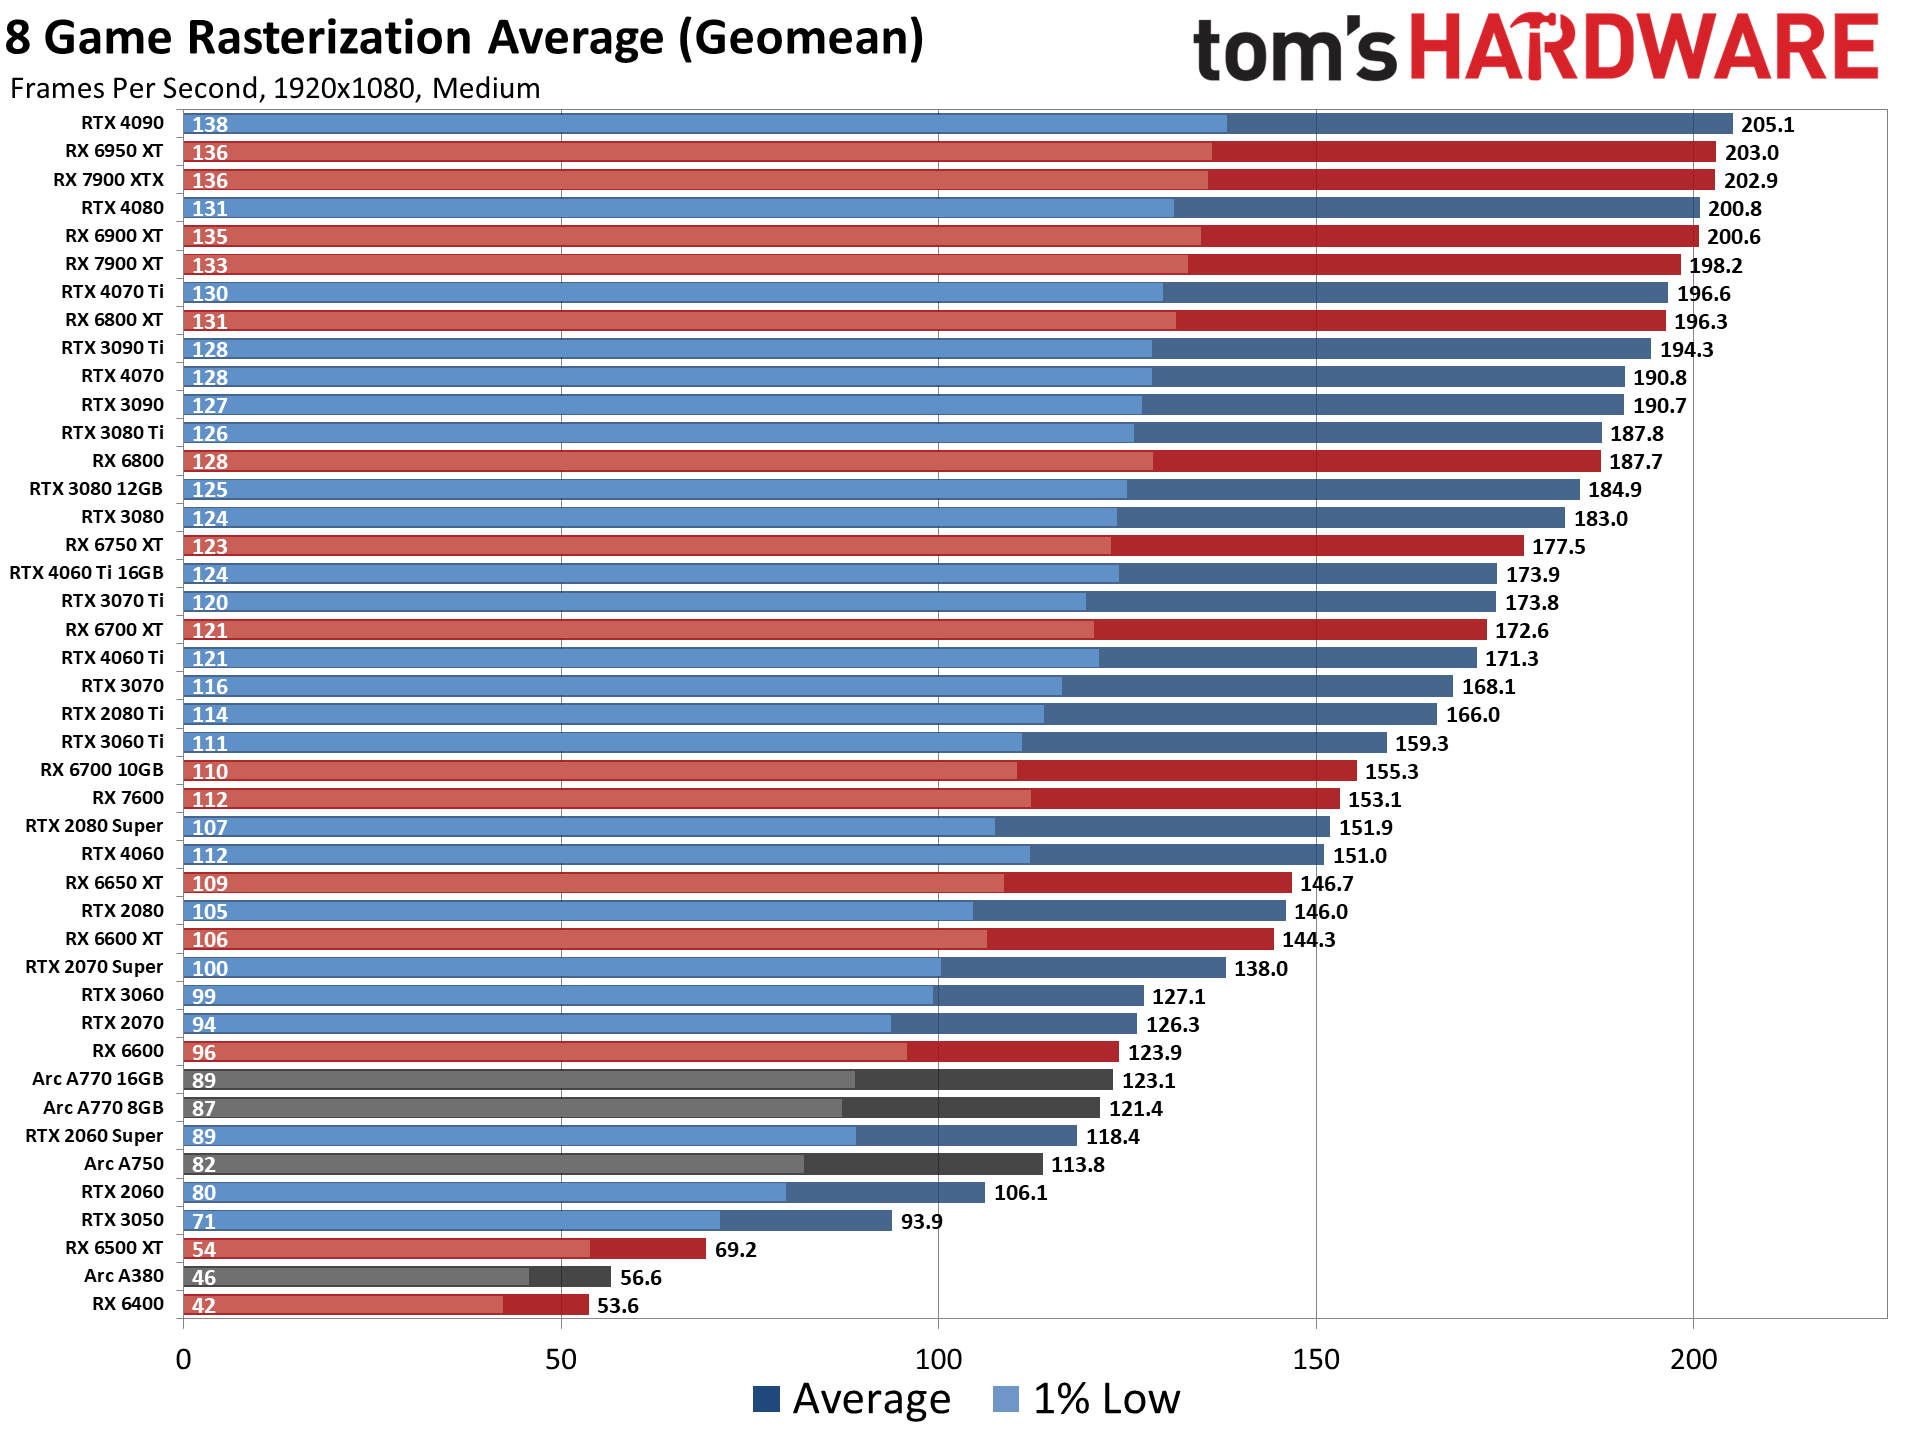
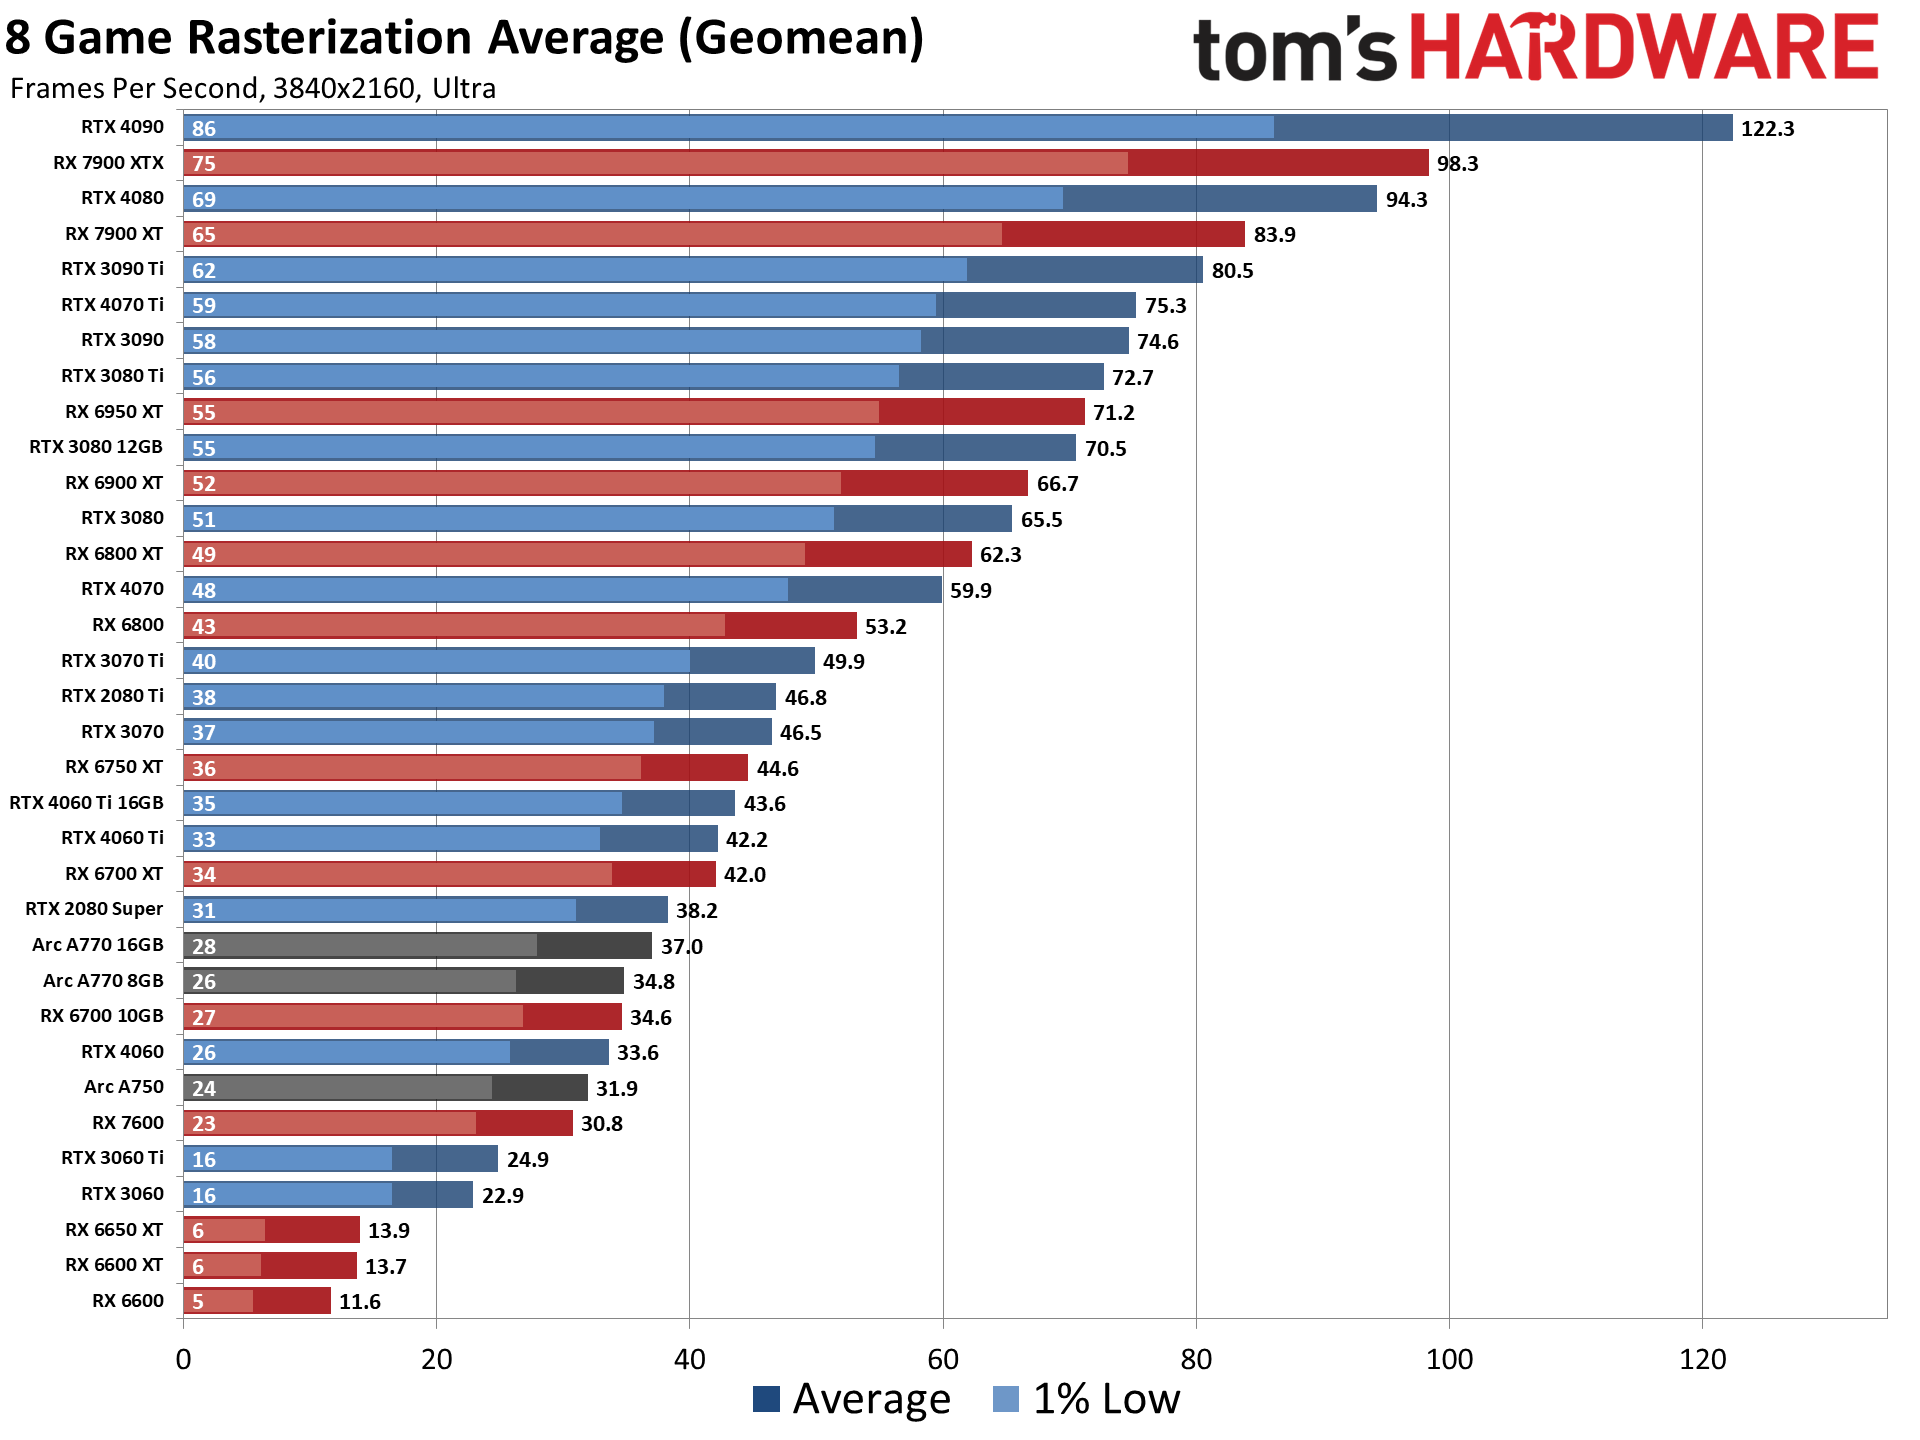
For our latest benchmarks, we've tested nearly every GPU released in the past seven years, plus a few extras, at 1080p medium and 1080p ultra, and sorted the table by the 1080p ultra results. Where it makes sense, we also test at 1440p ultra and 4K ultra. All of the scores are scaled relative to the top-ranking 1080p ultra card, which in our new suite is the RTX 4090 — especially at 4K and 1440p.
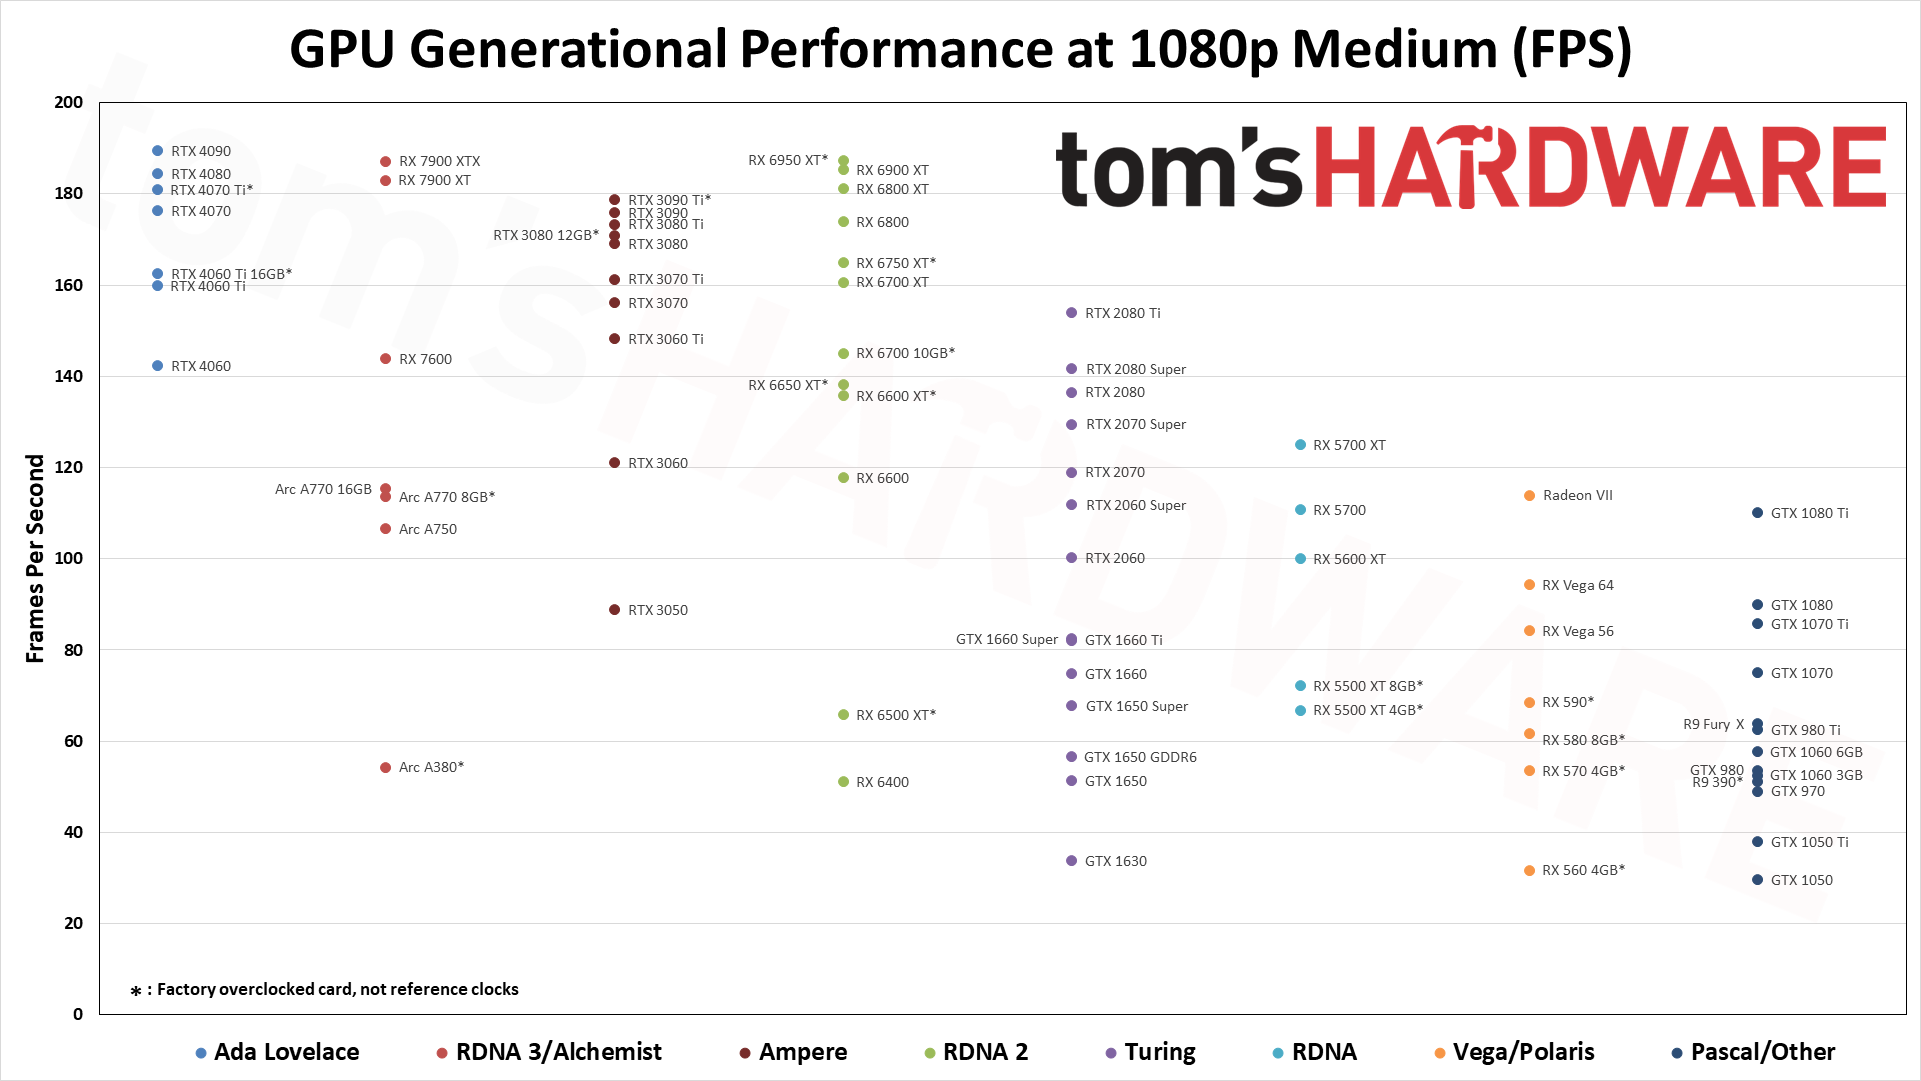
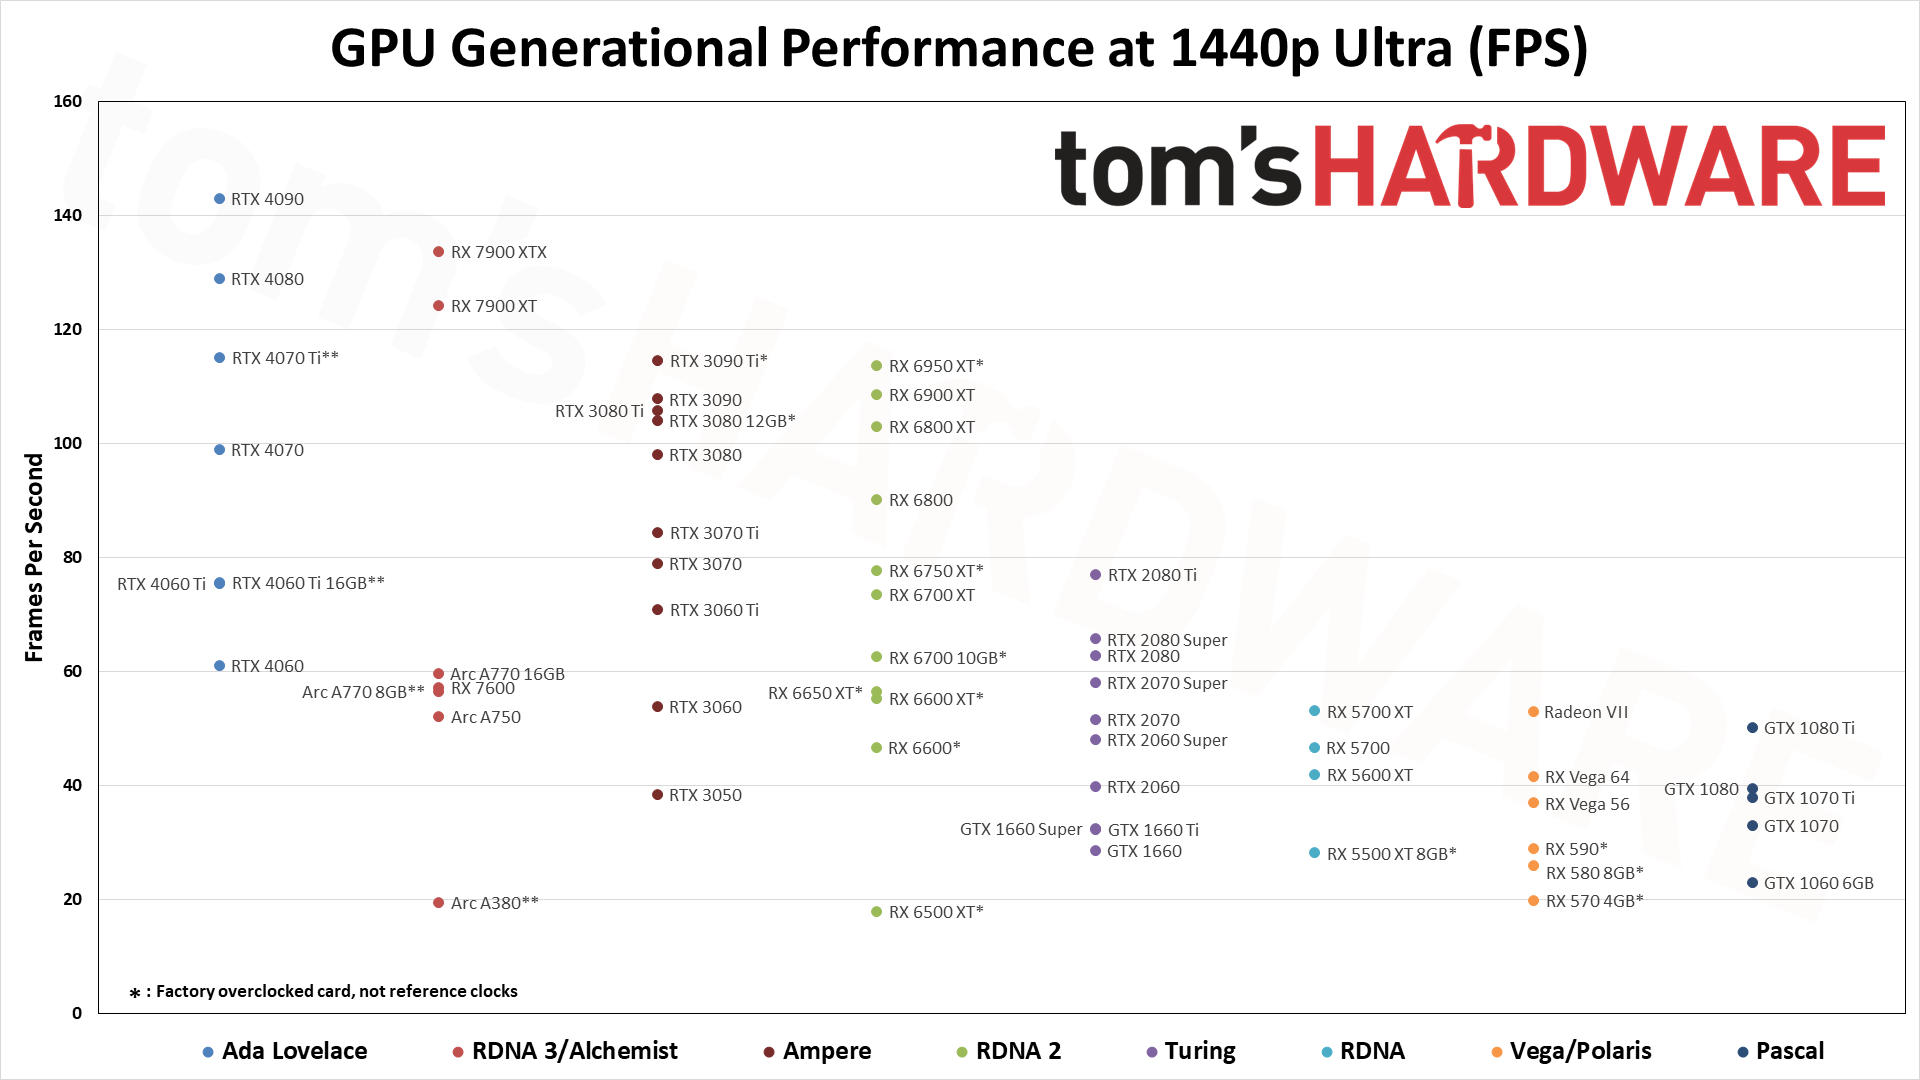
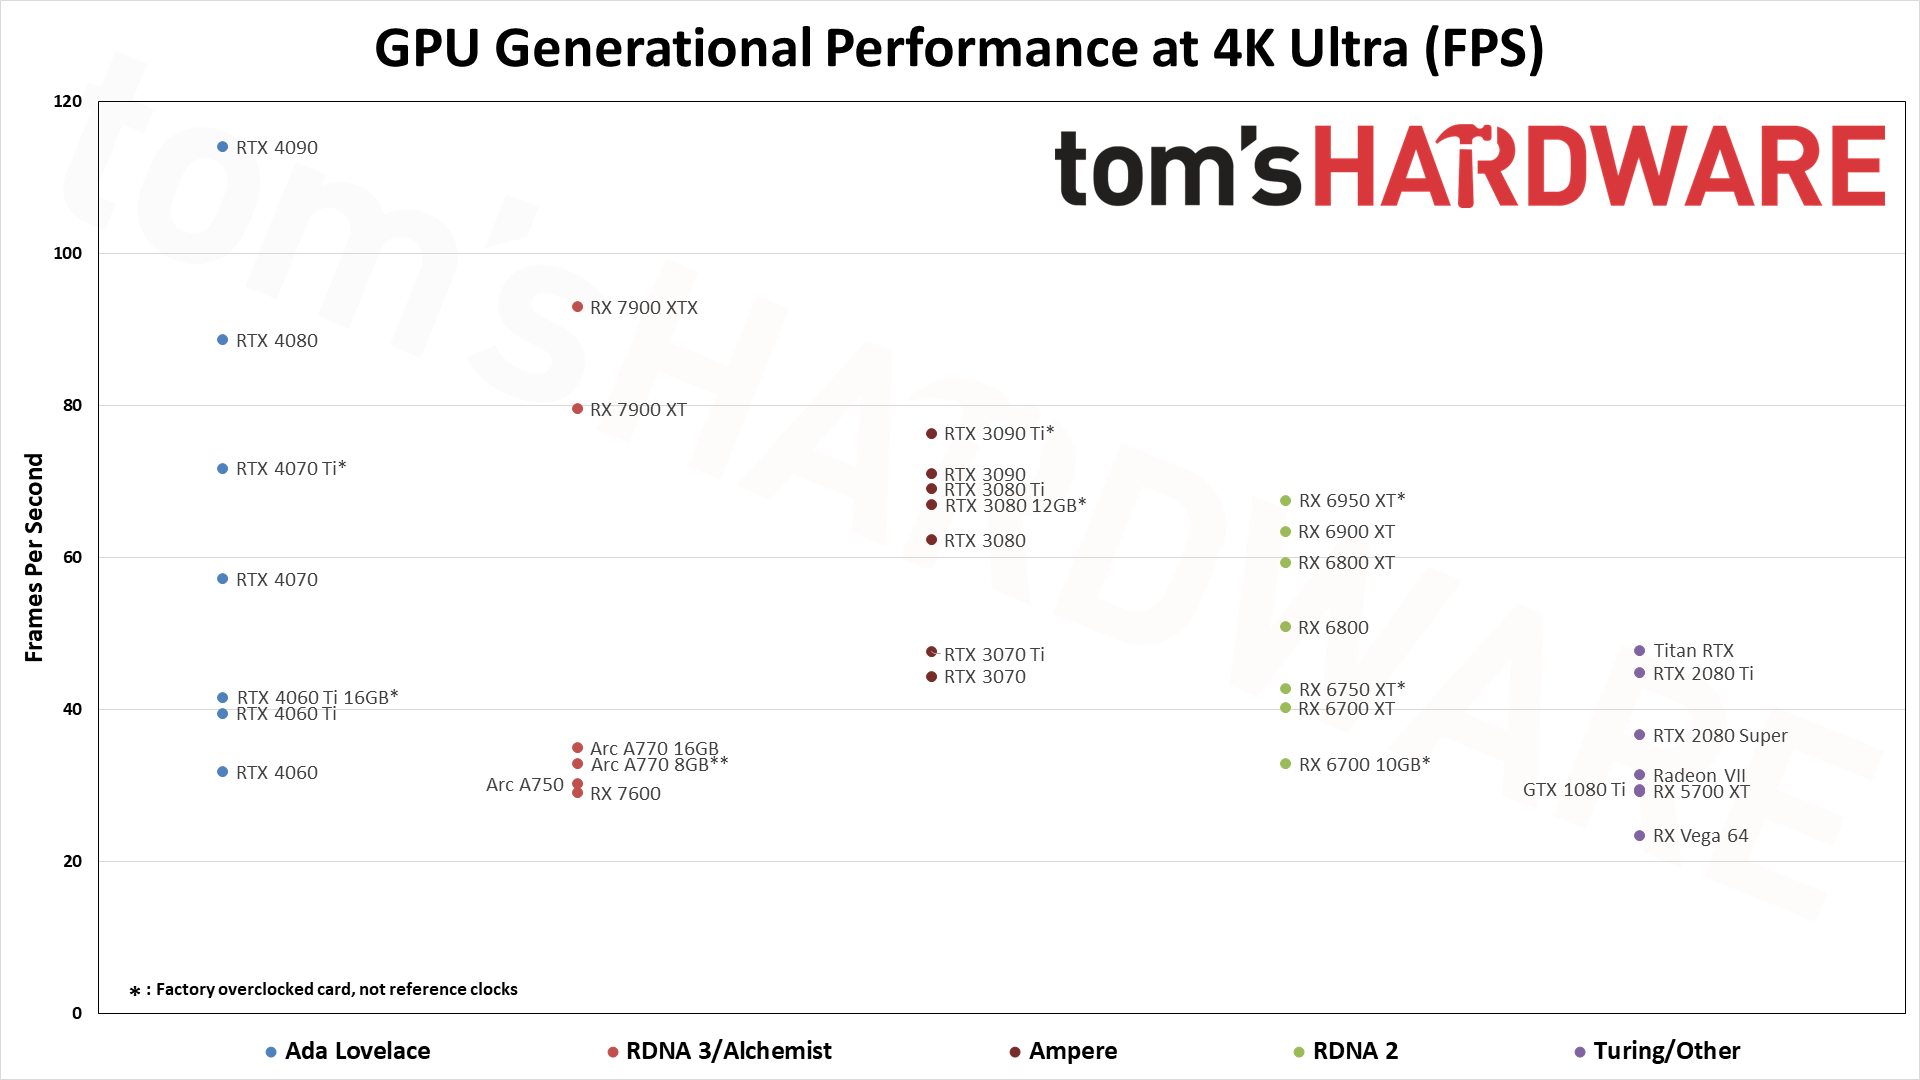
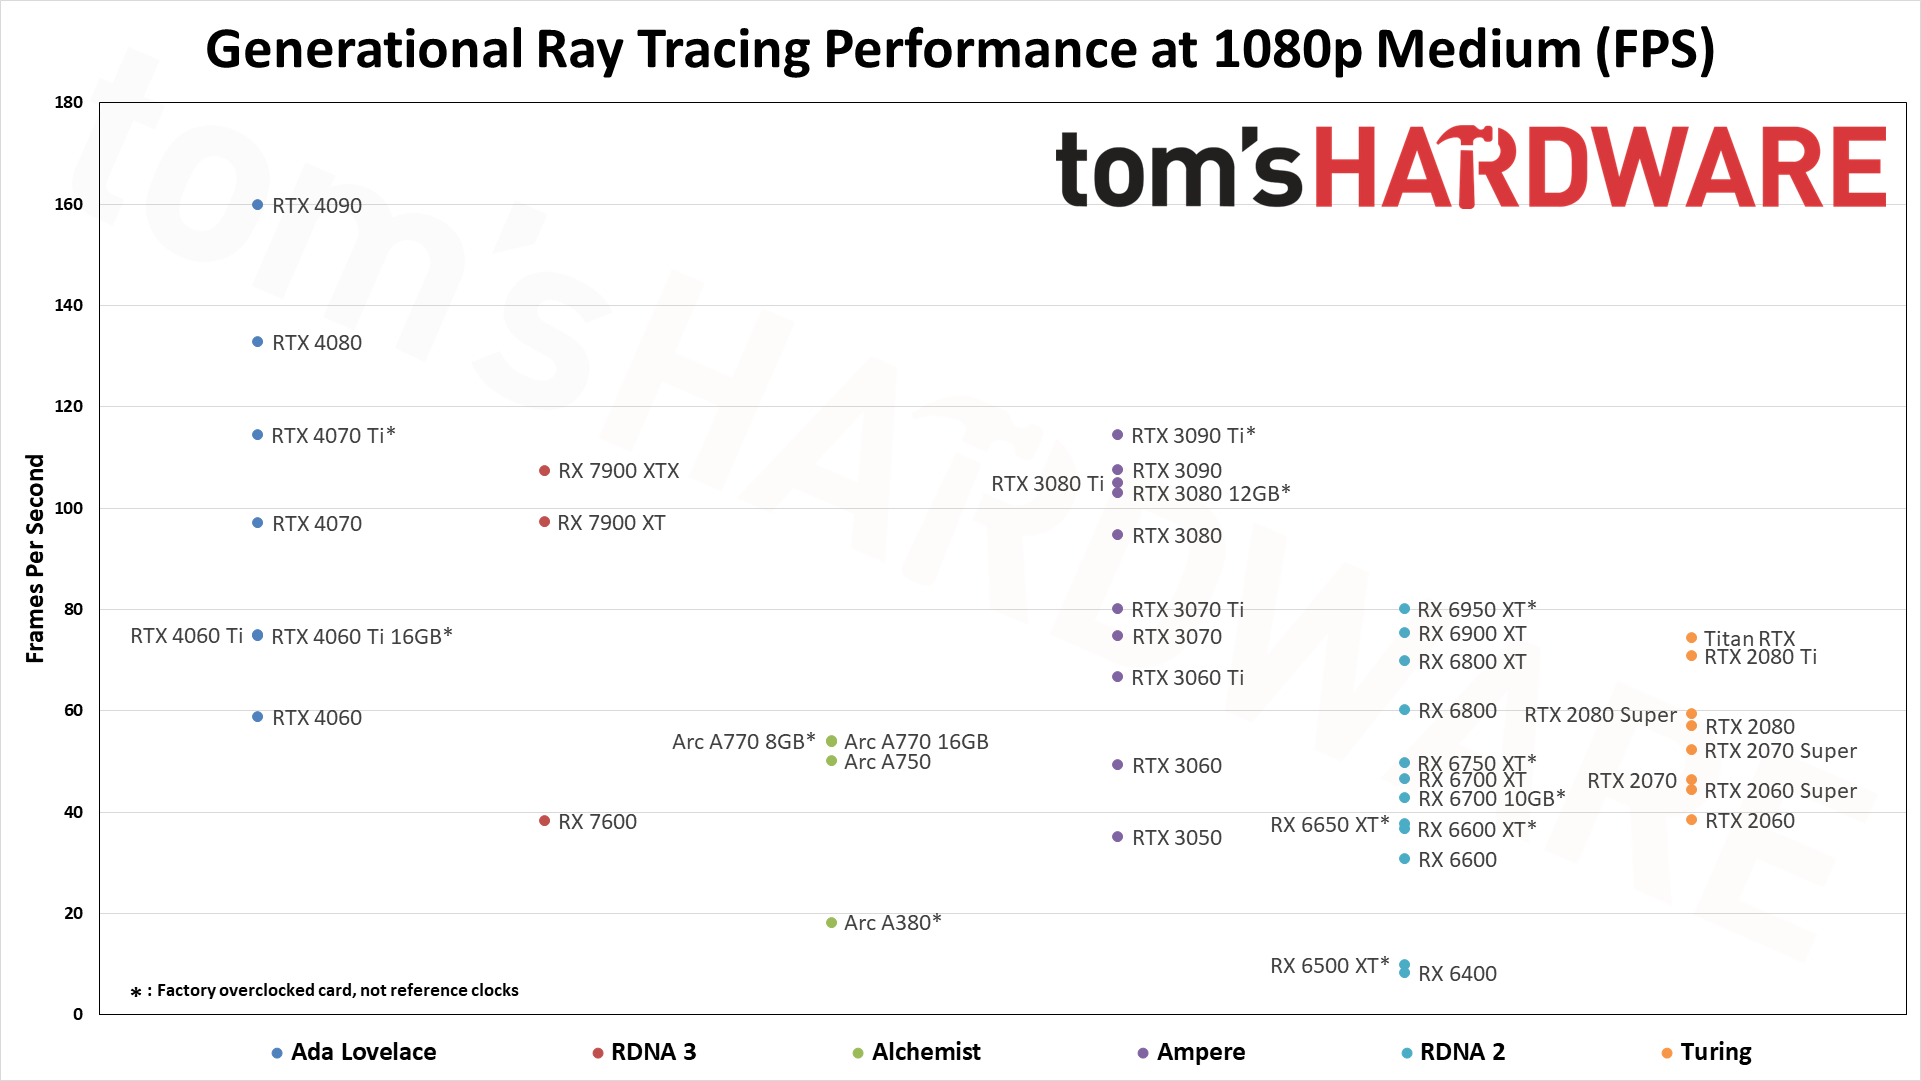
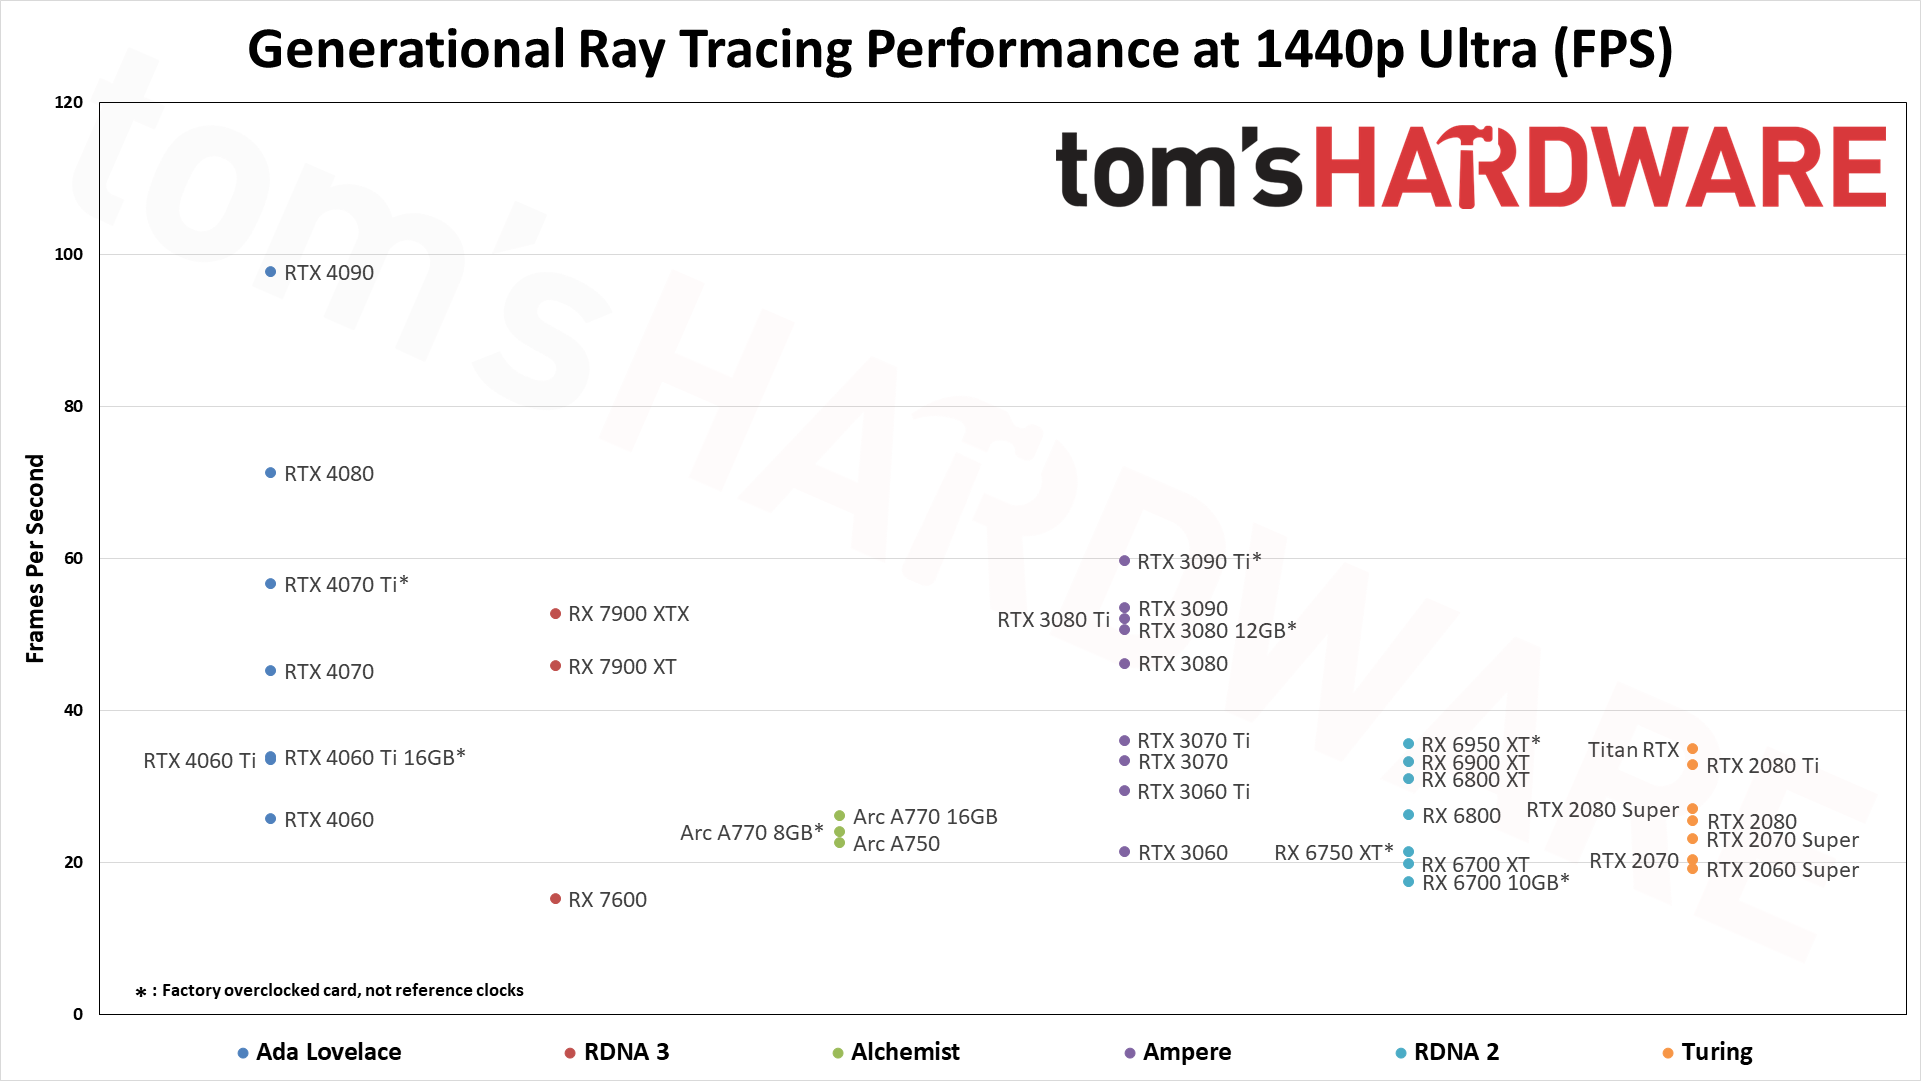
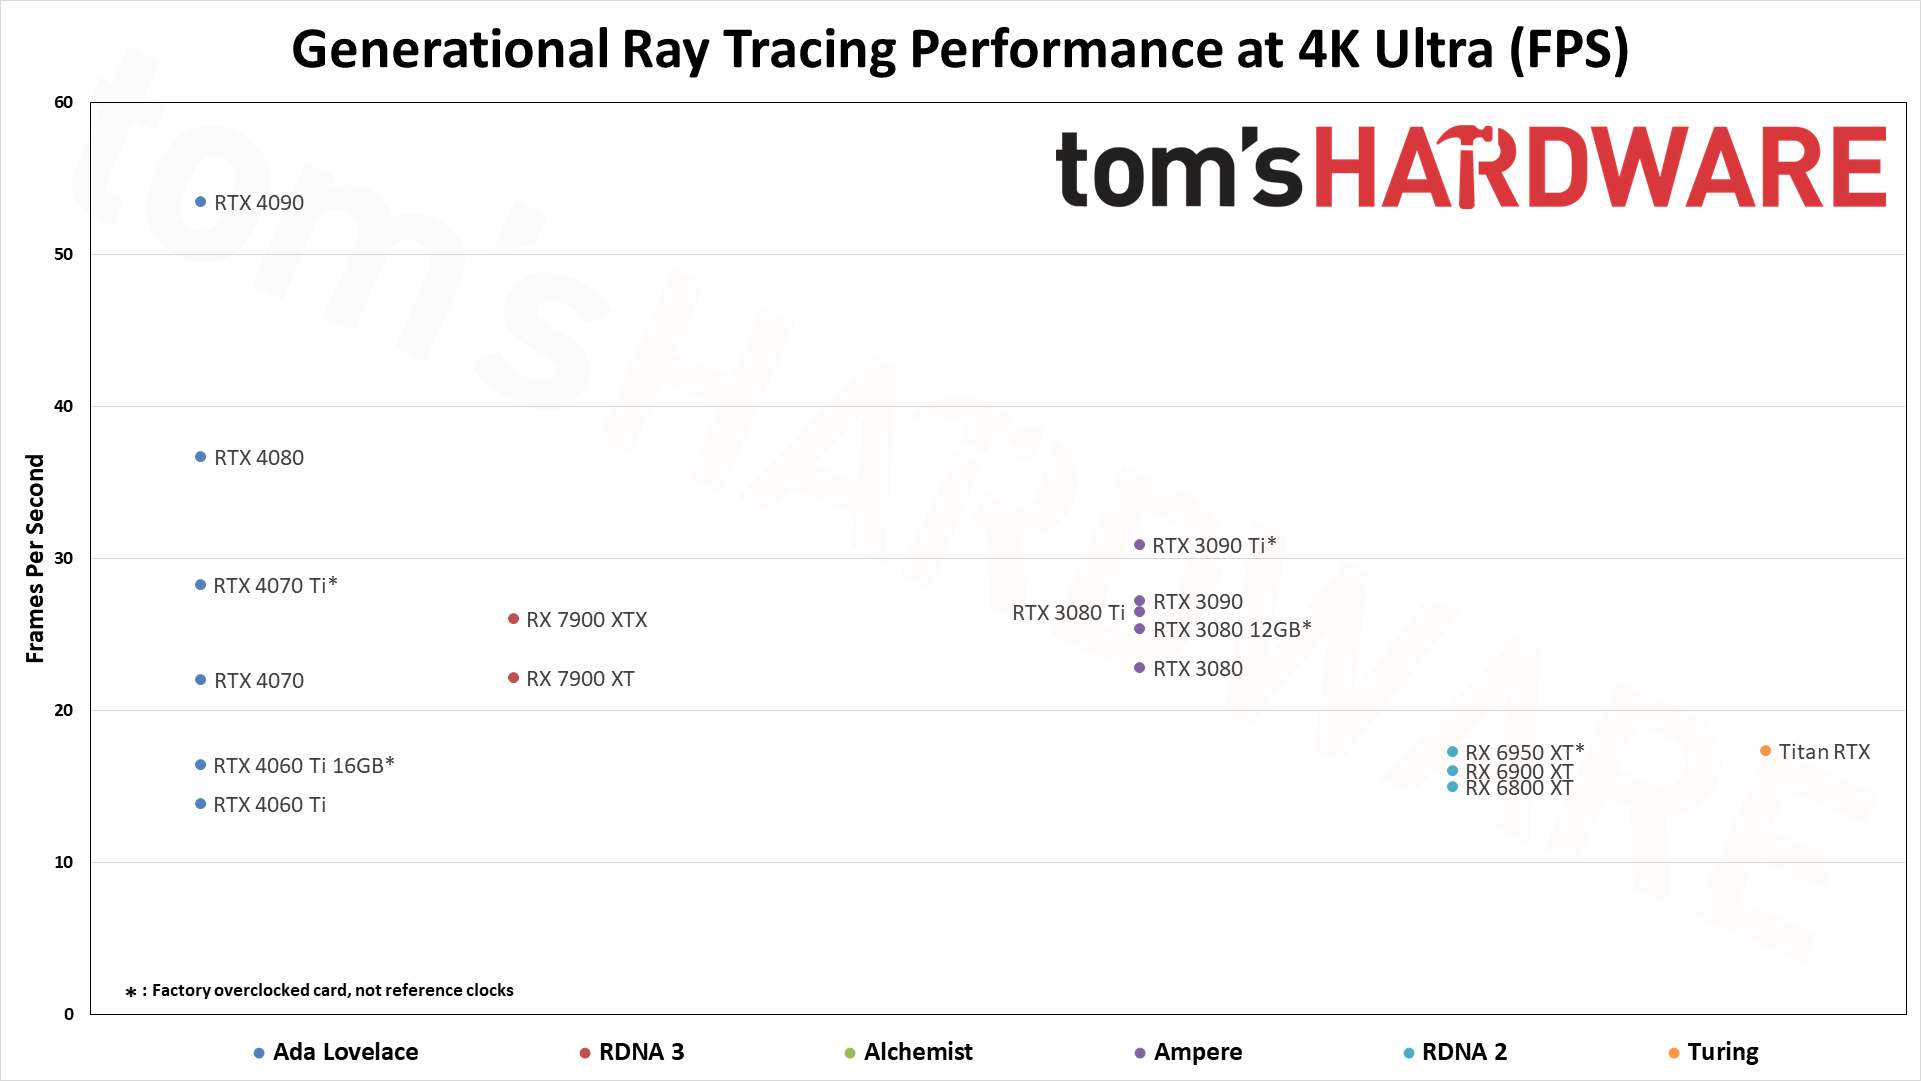
You can also see the above summary chart showing the relative performance of the cards we've tested across the past several generations of hardware at 1080p ultra — swipe through the above gallery if you want to see the 1080p medium, 1440p and 4K ultra images. There are a few missing options (e.g., the GT 1030, RX 550, and several Titan cards), but otherwise it's basically complete. Note that we also have data in the table below for some of the other older GPUs.
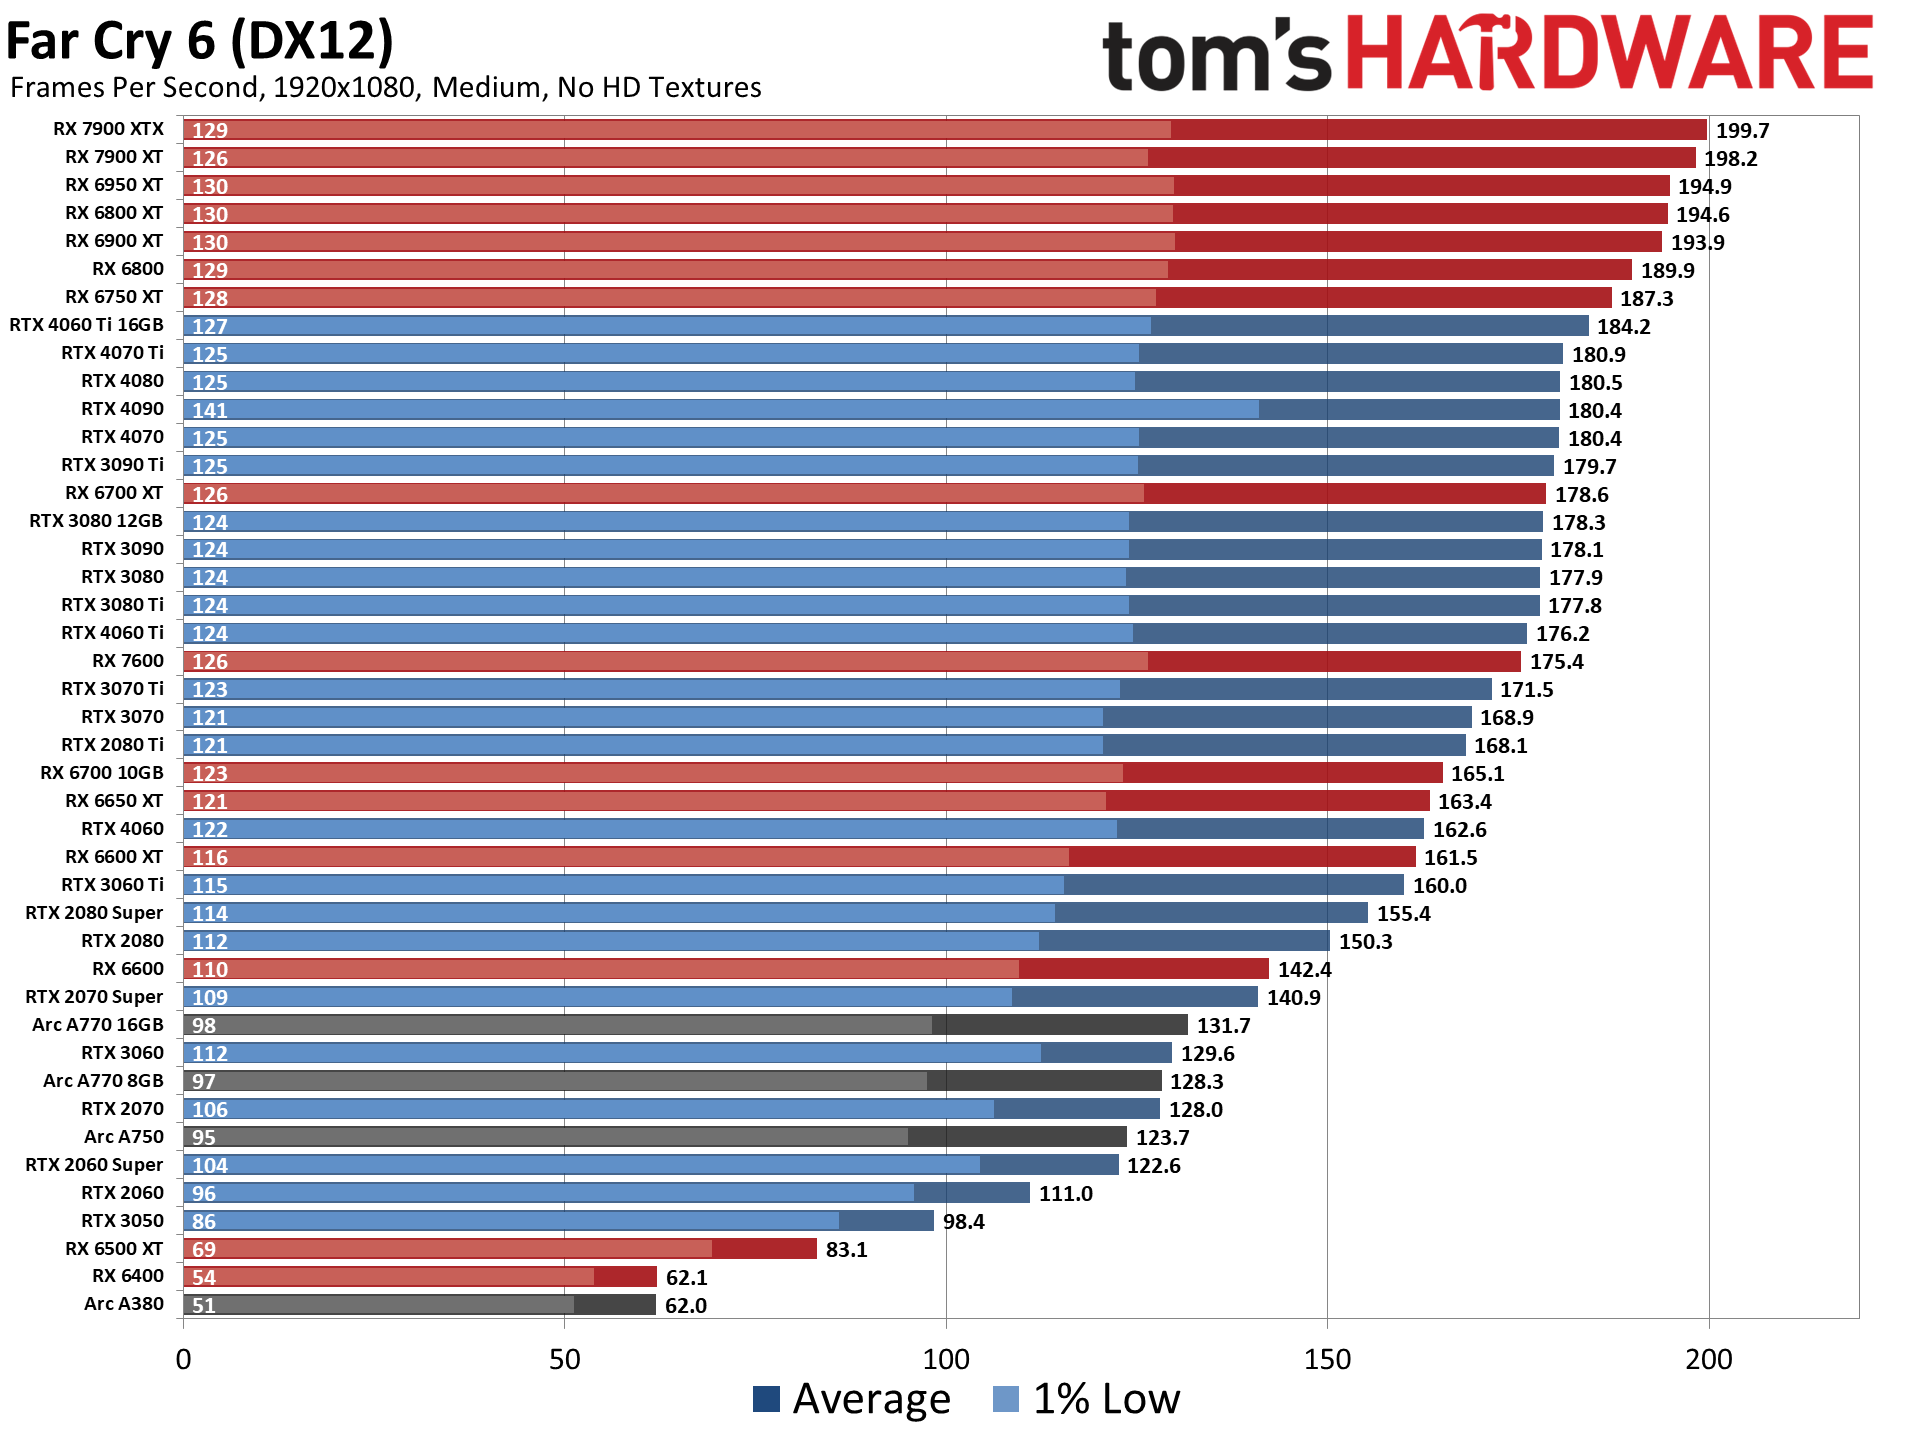
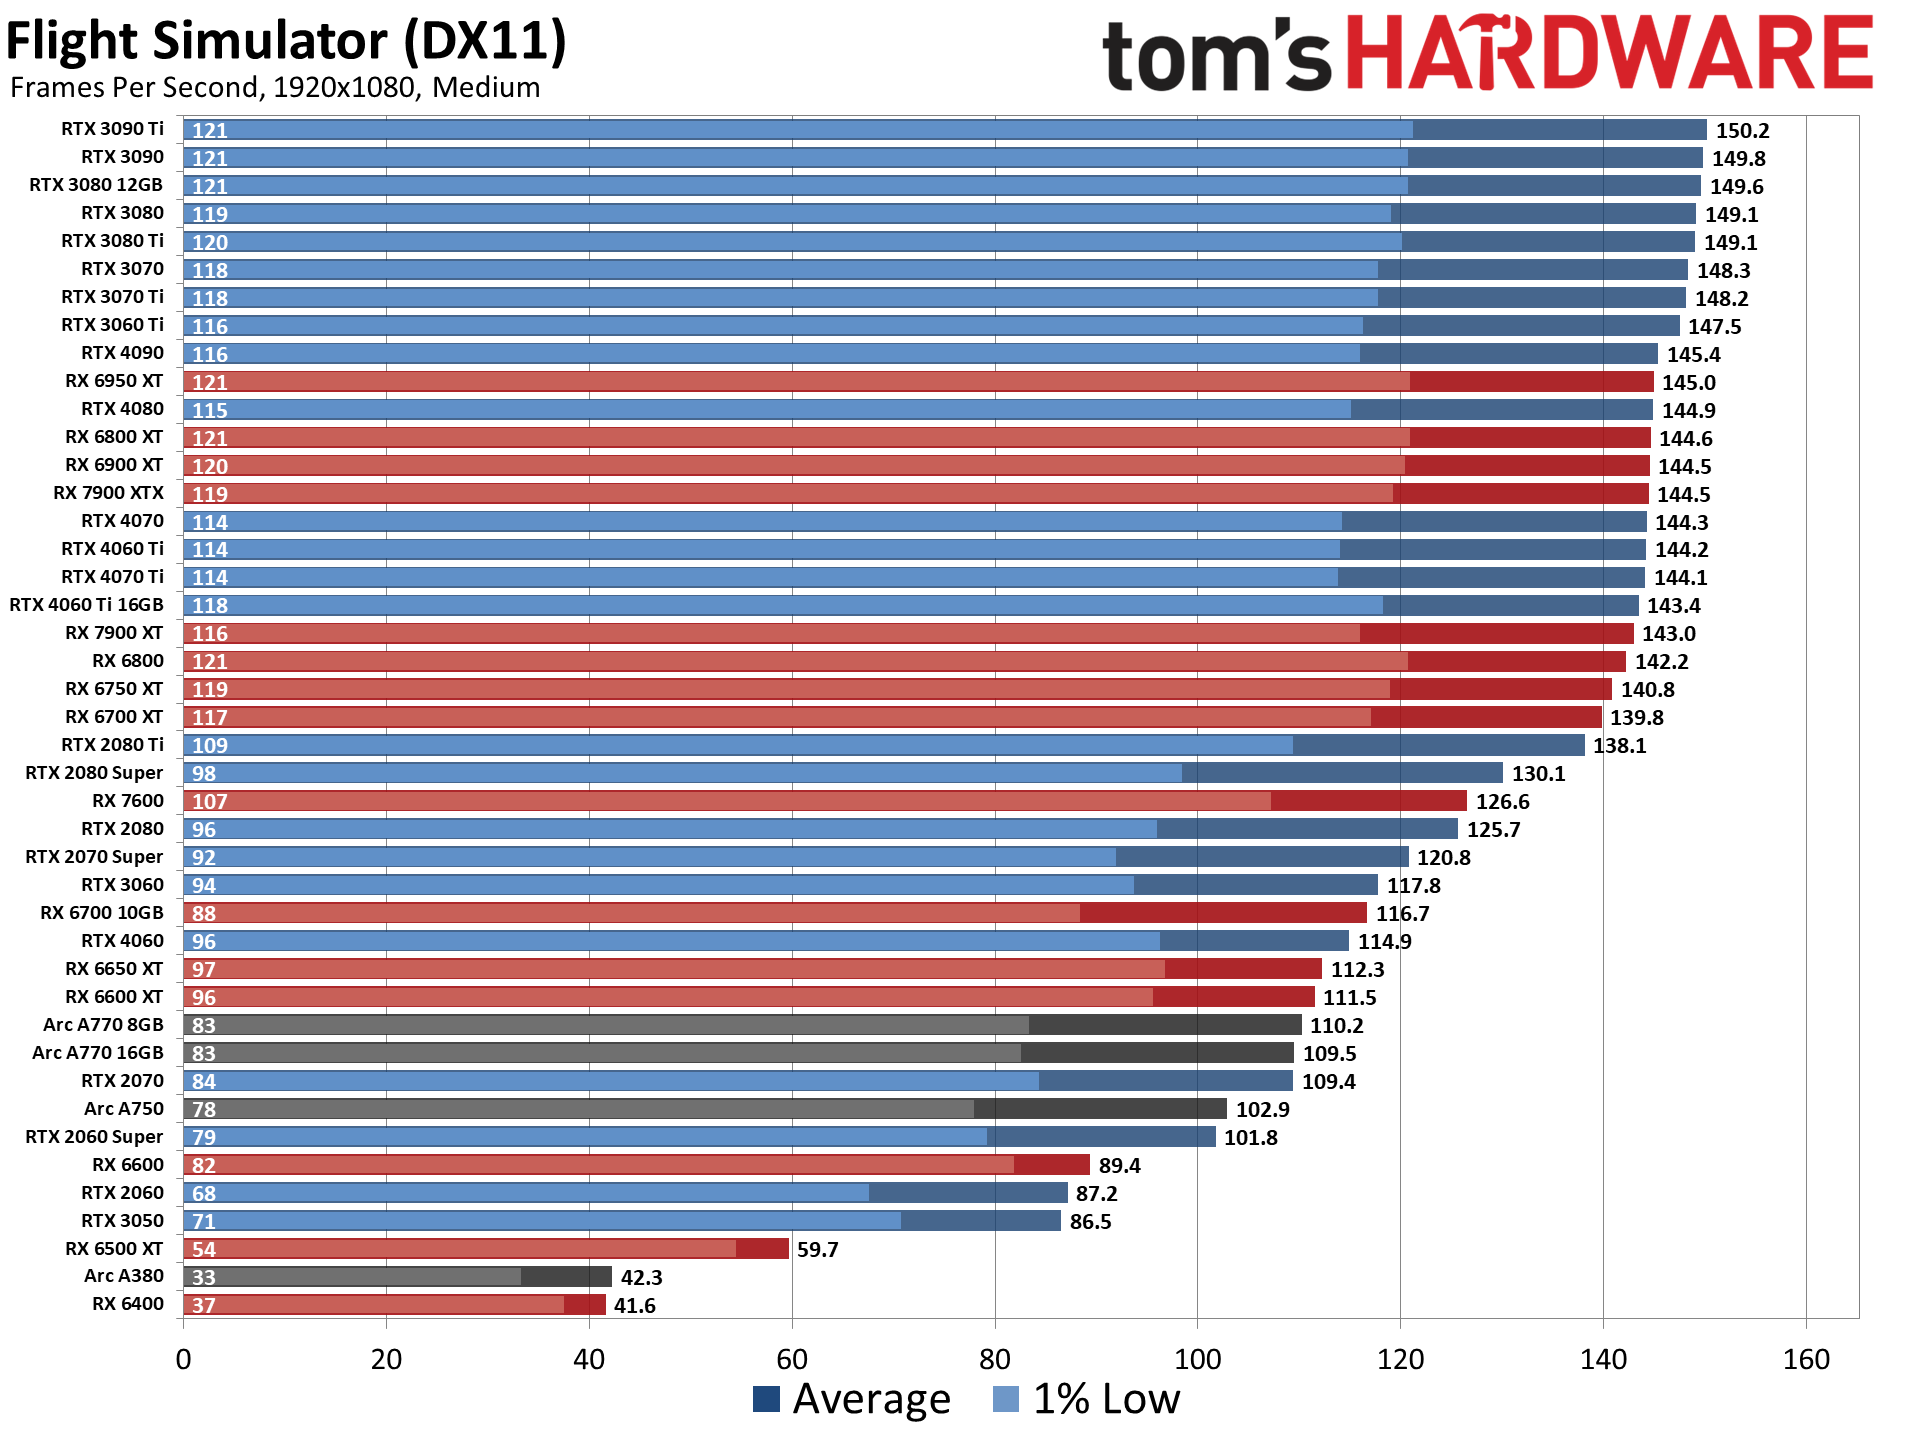
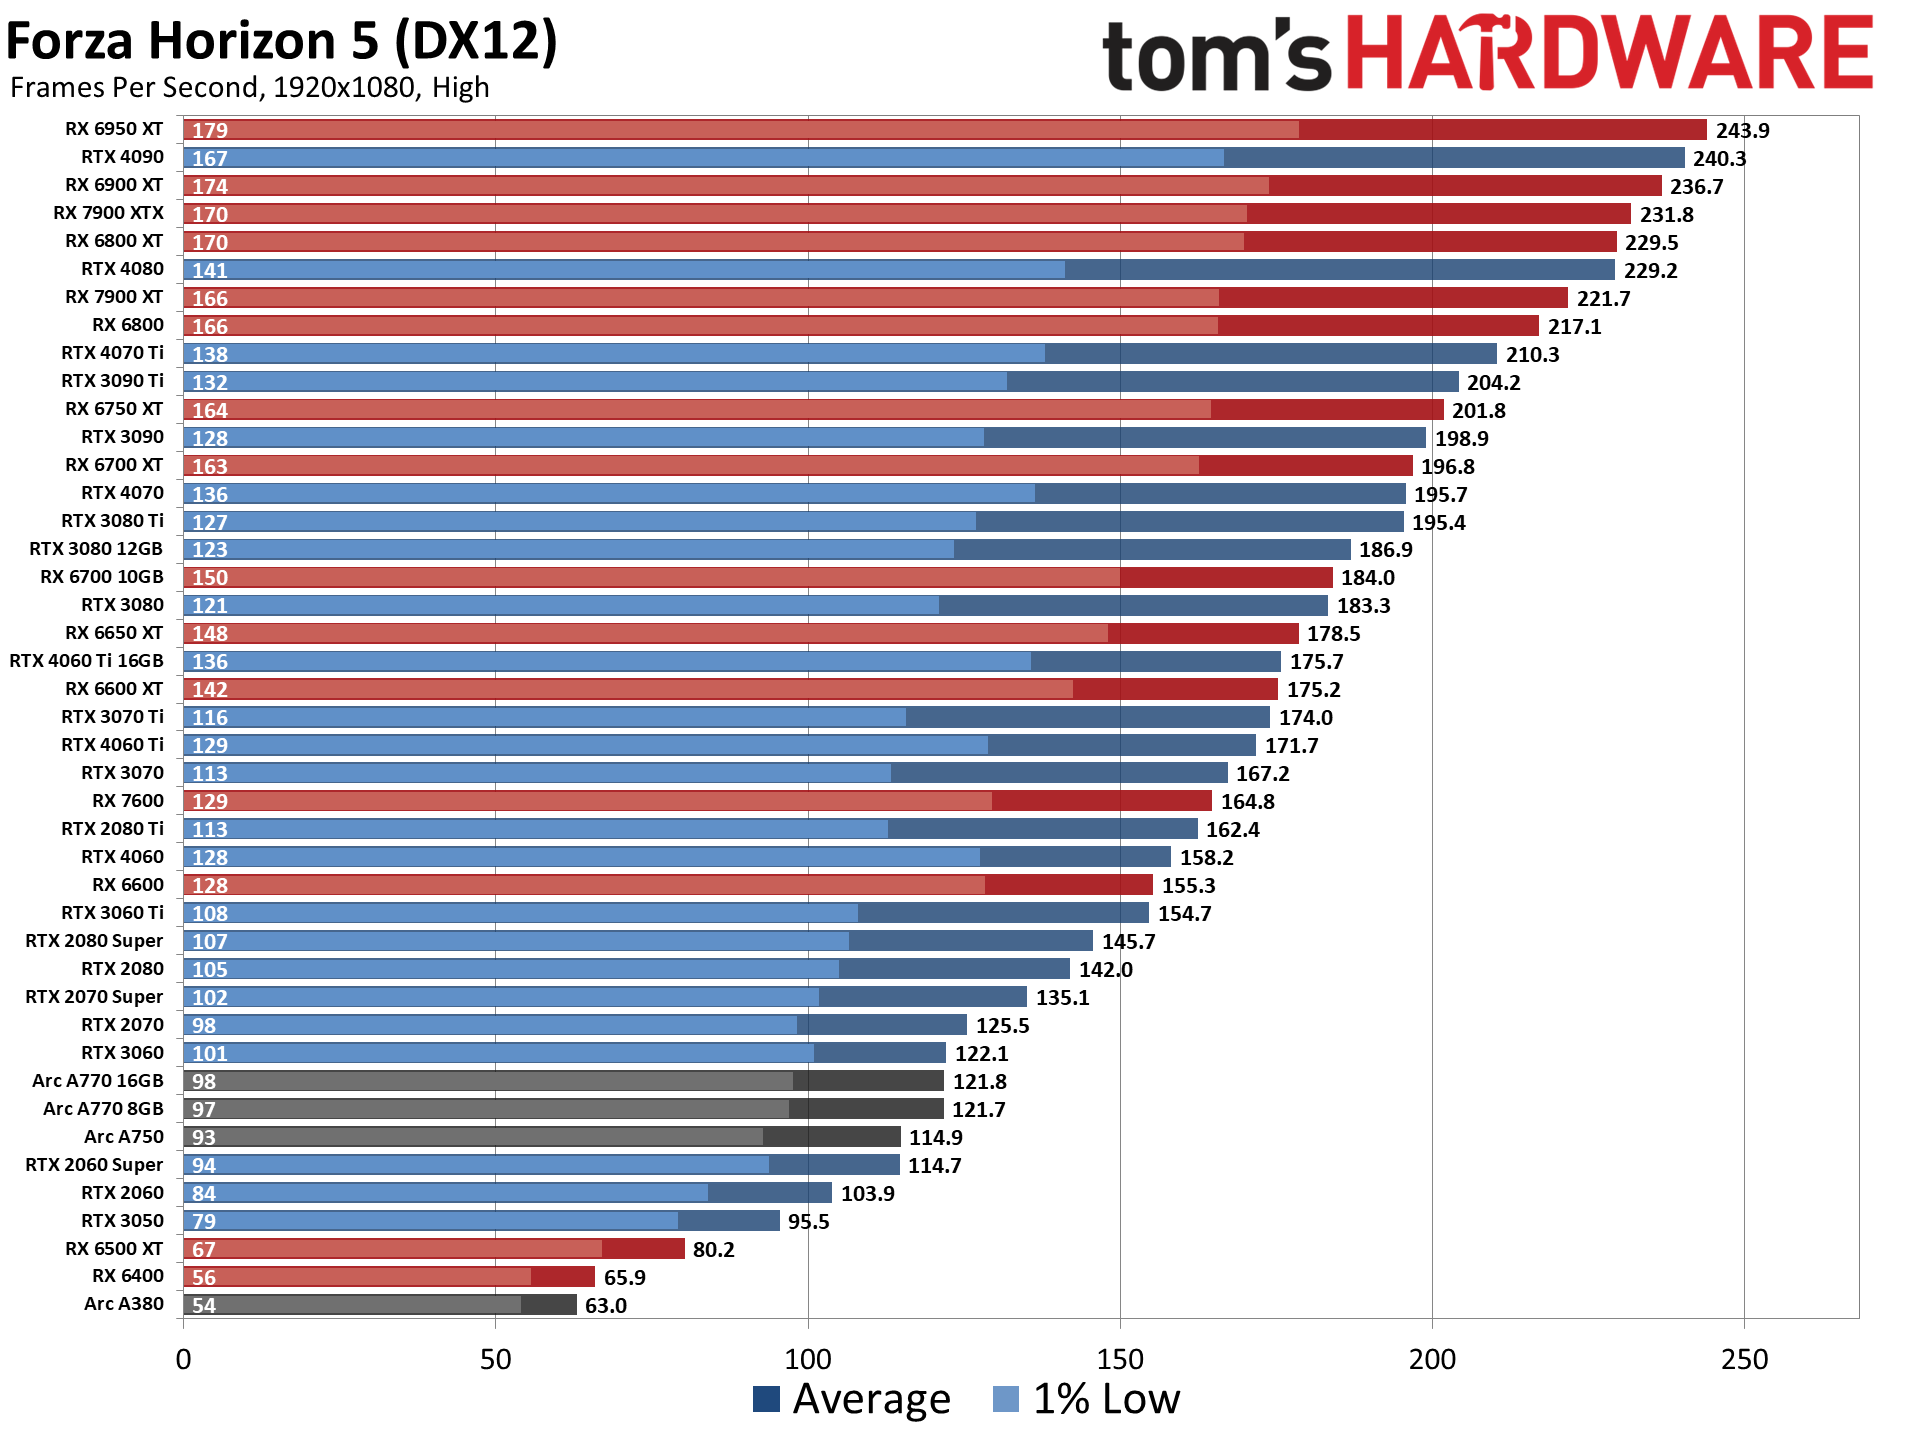
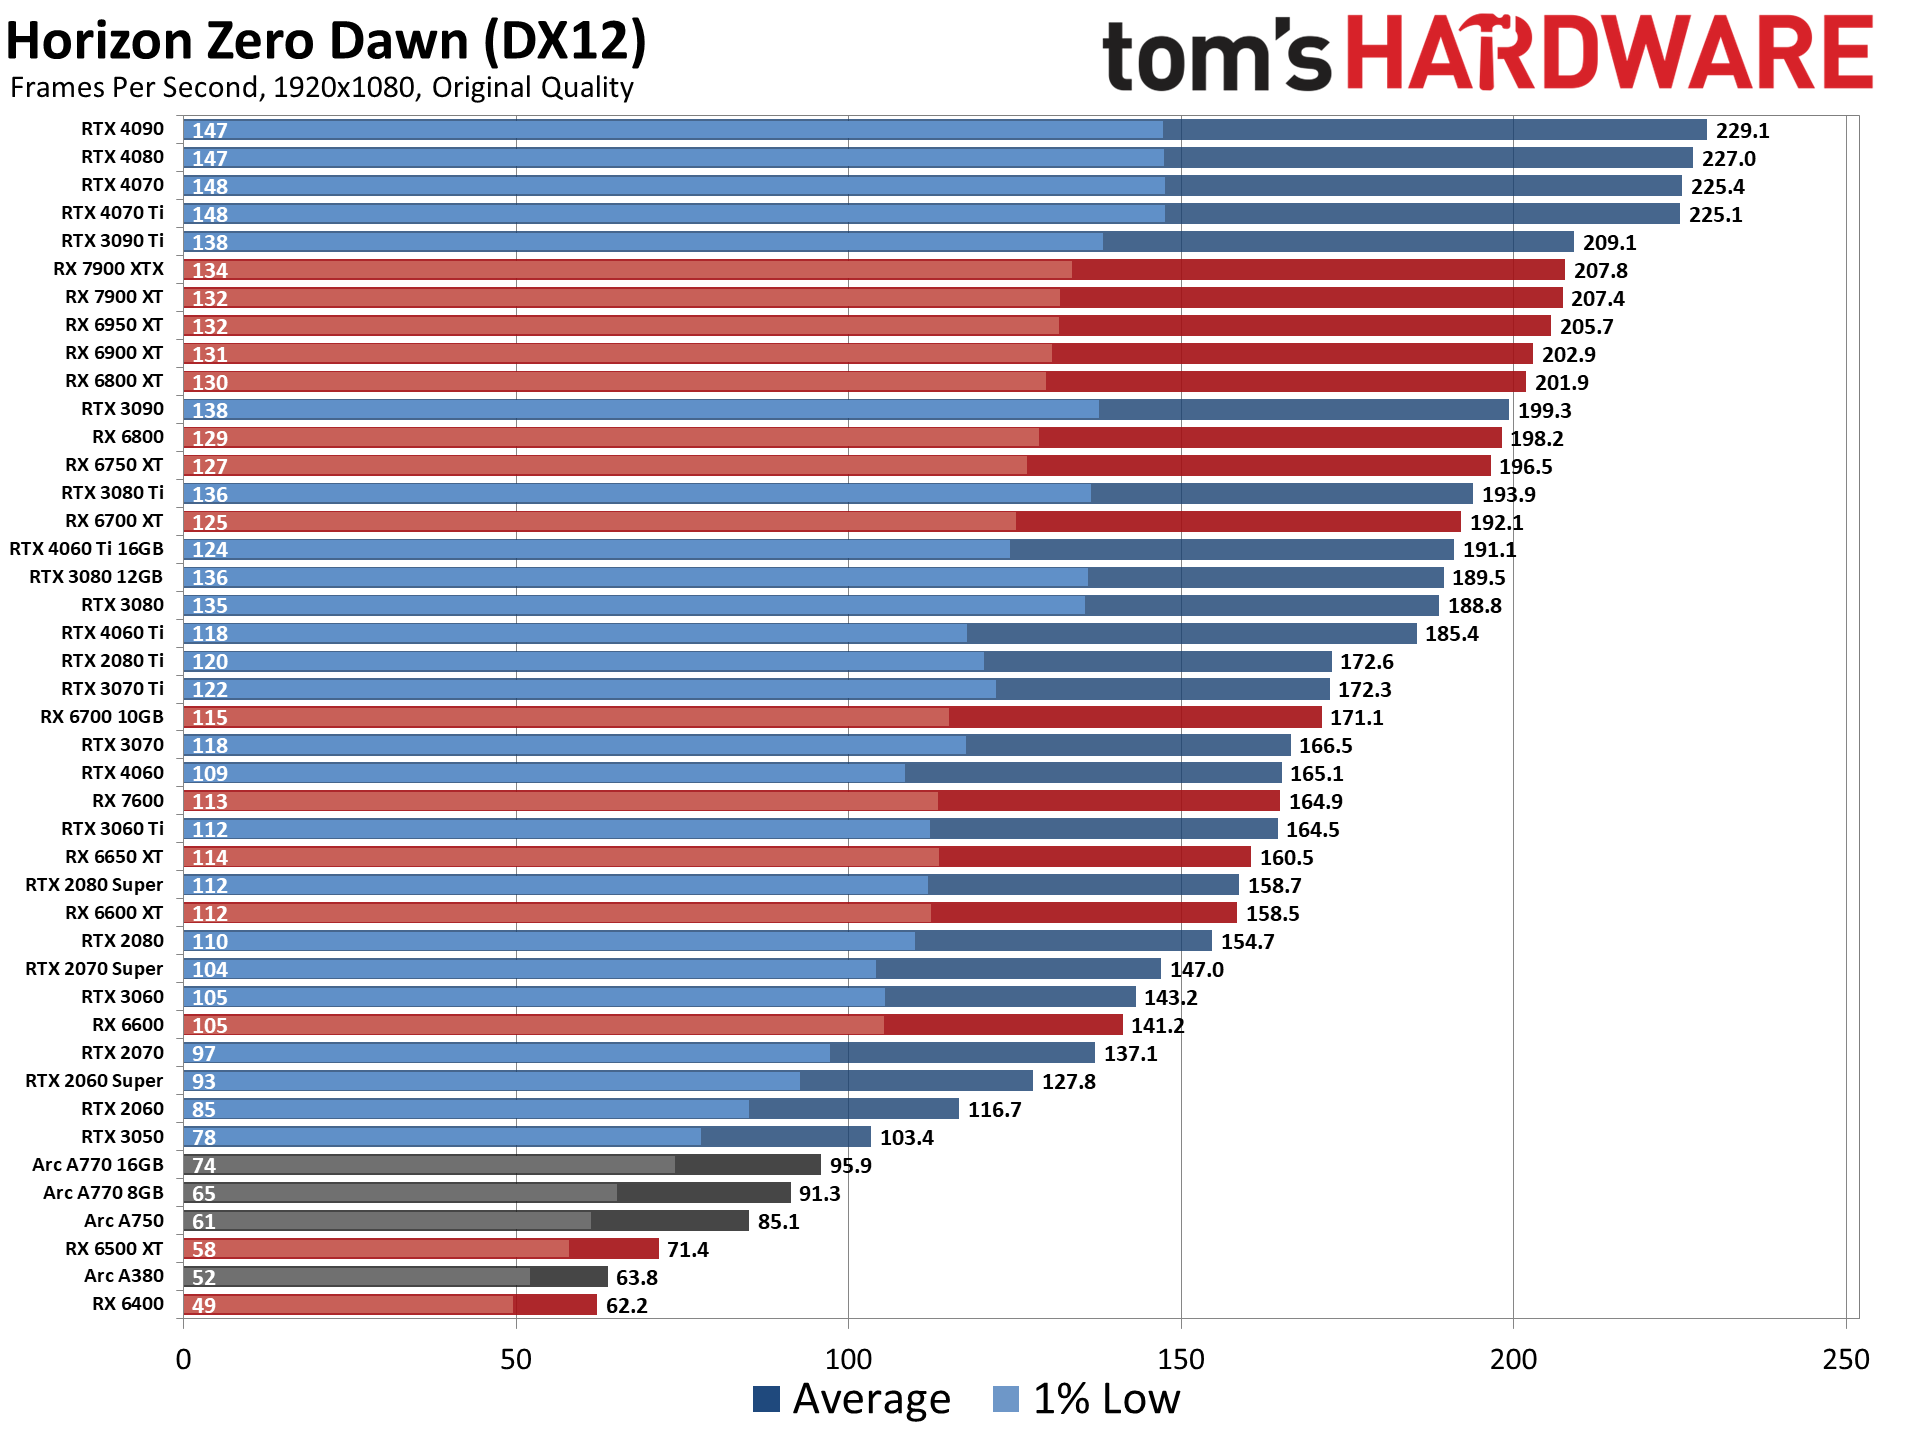
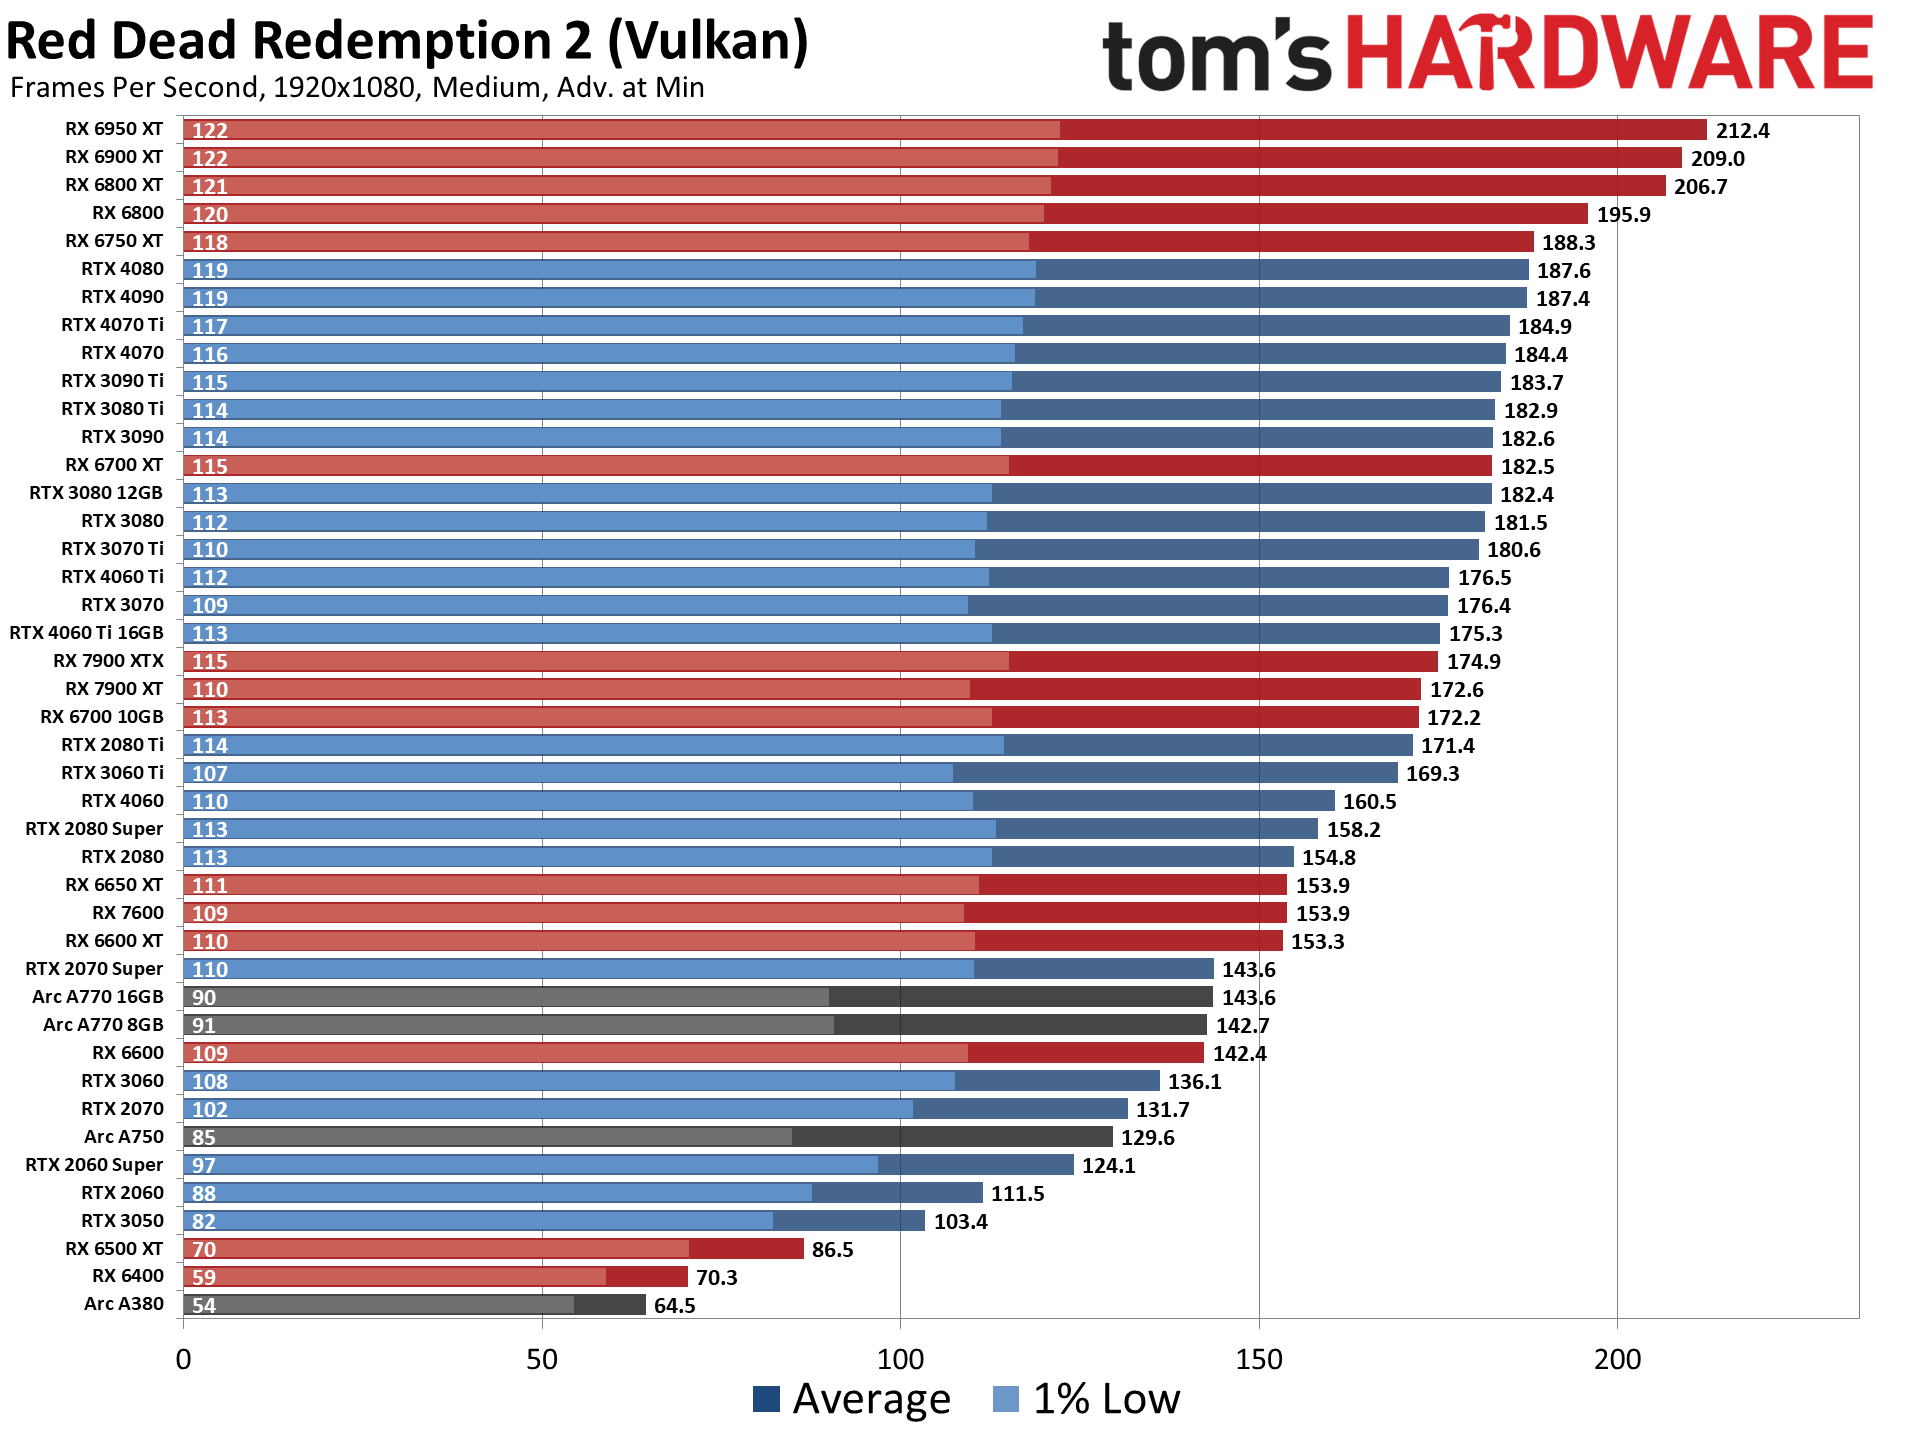
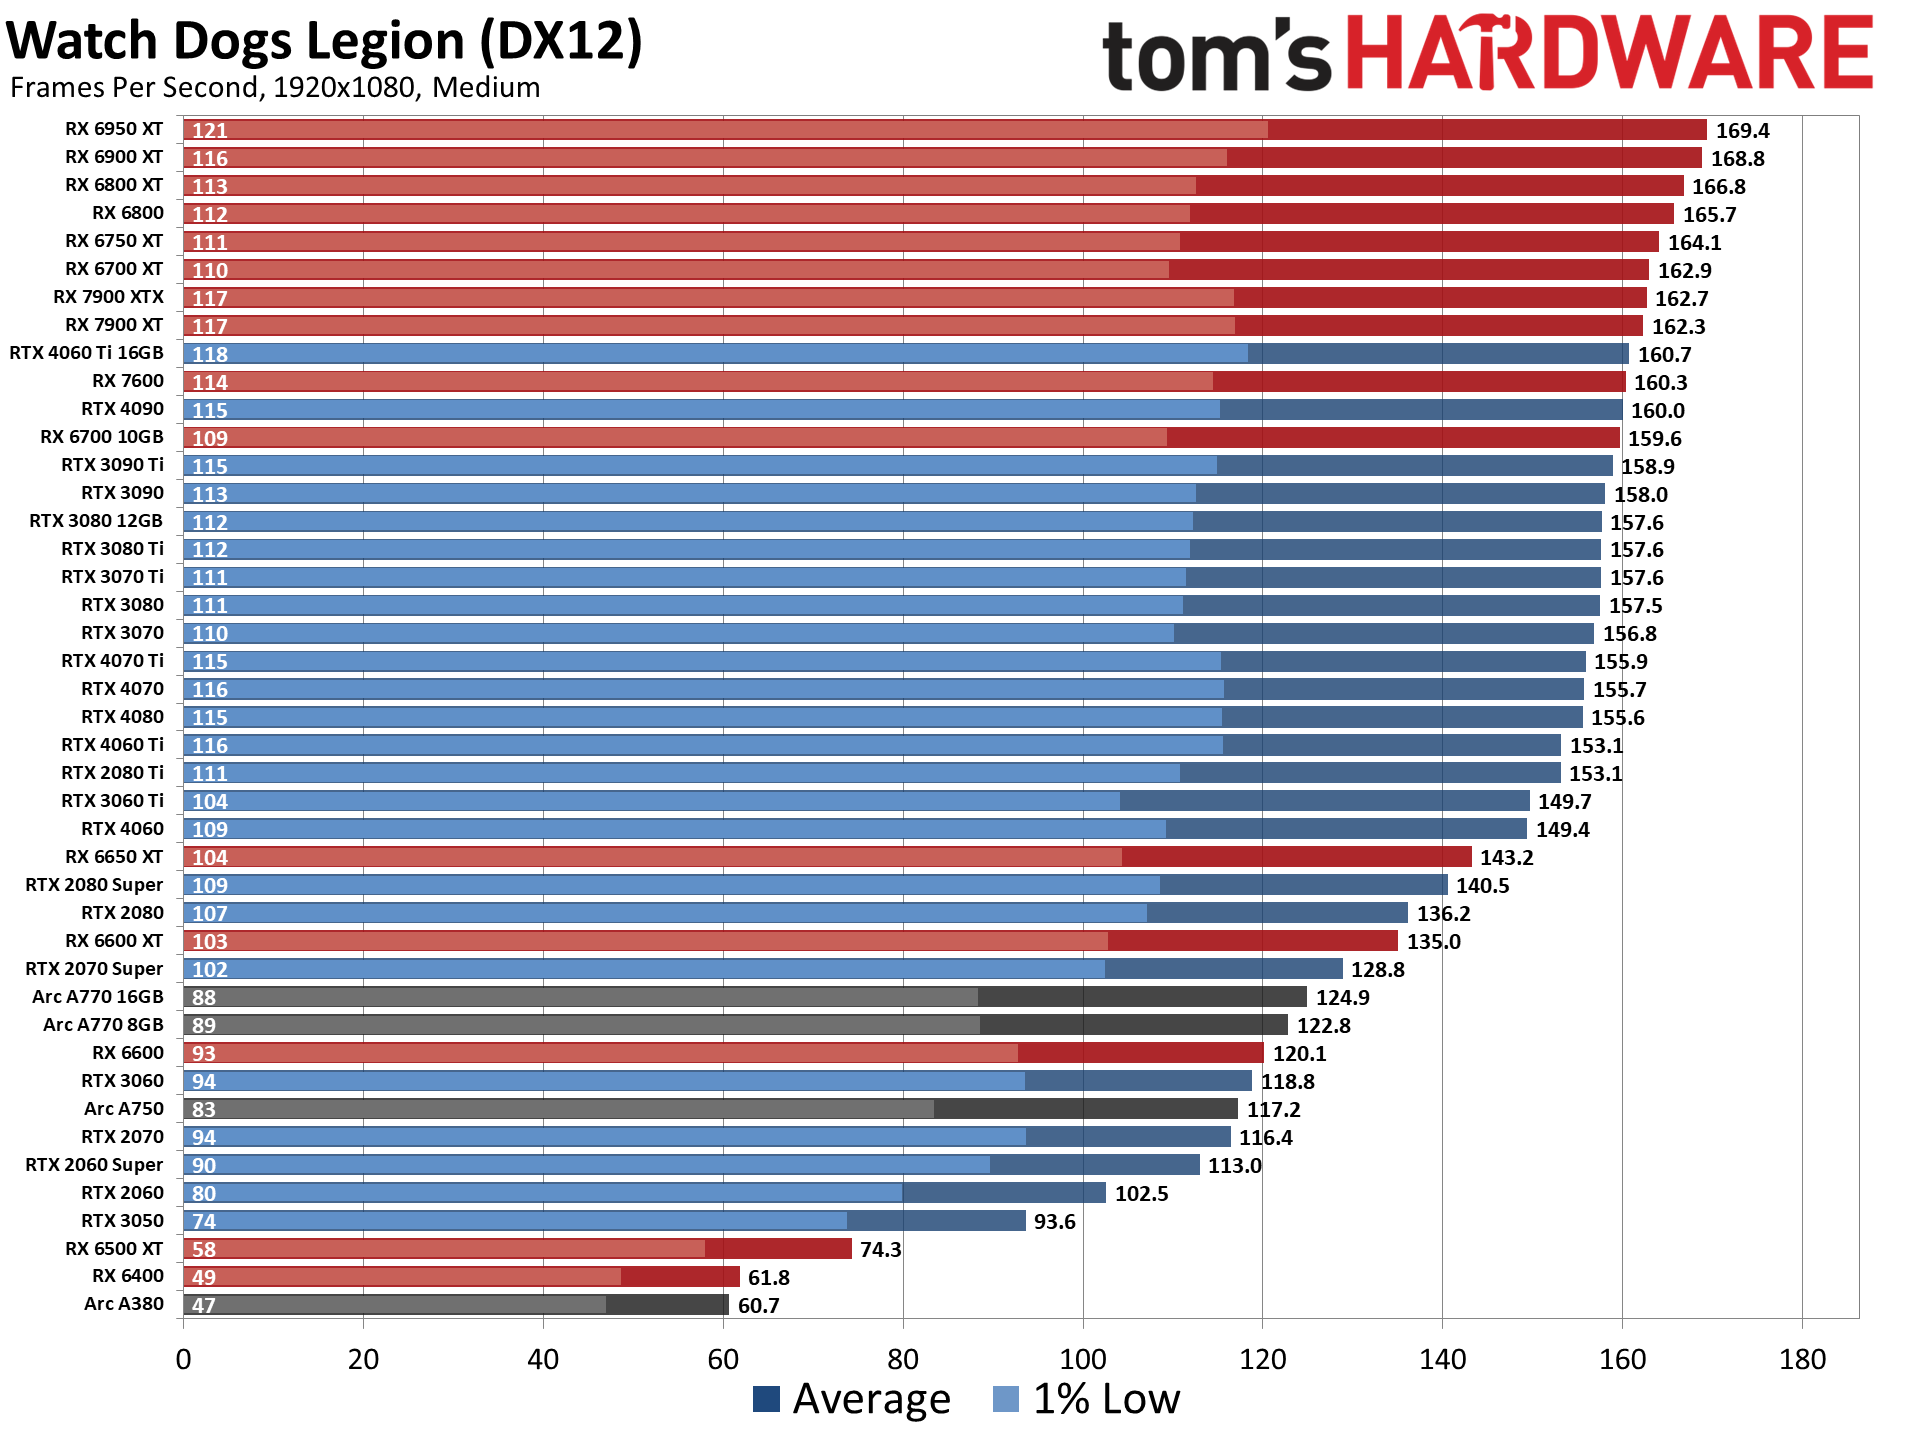
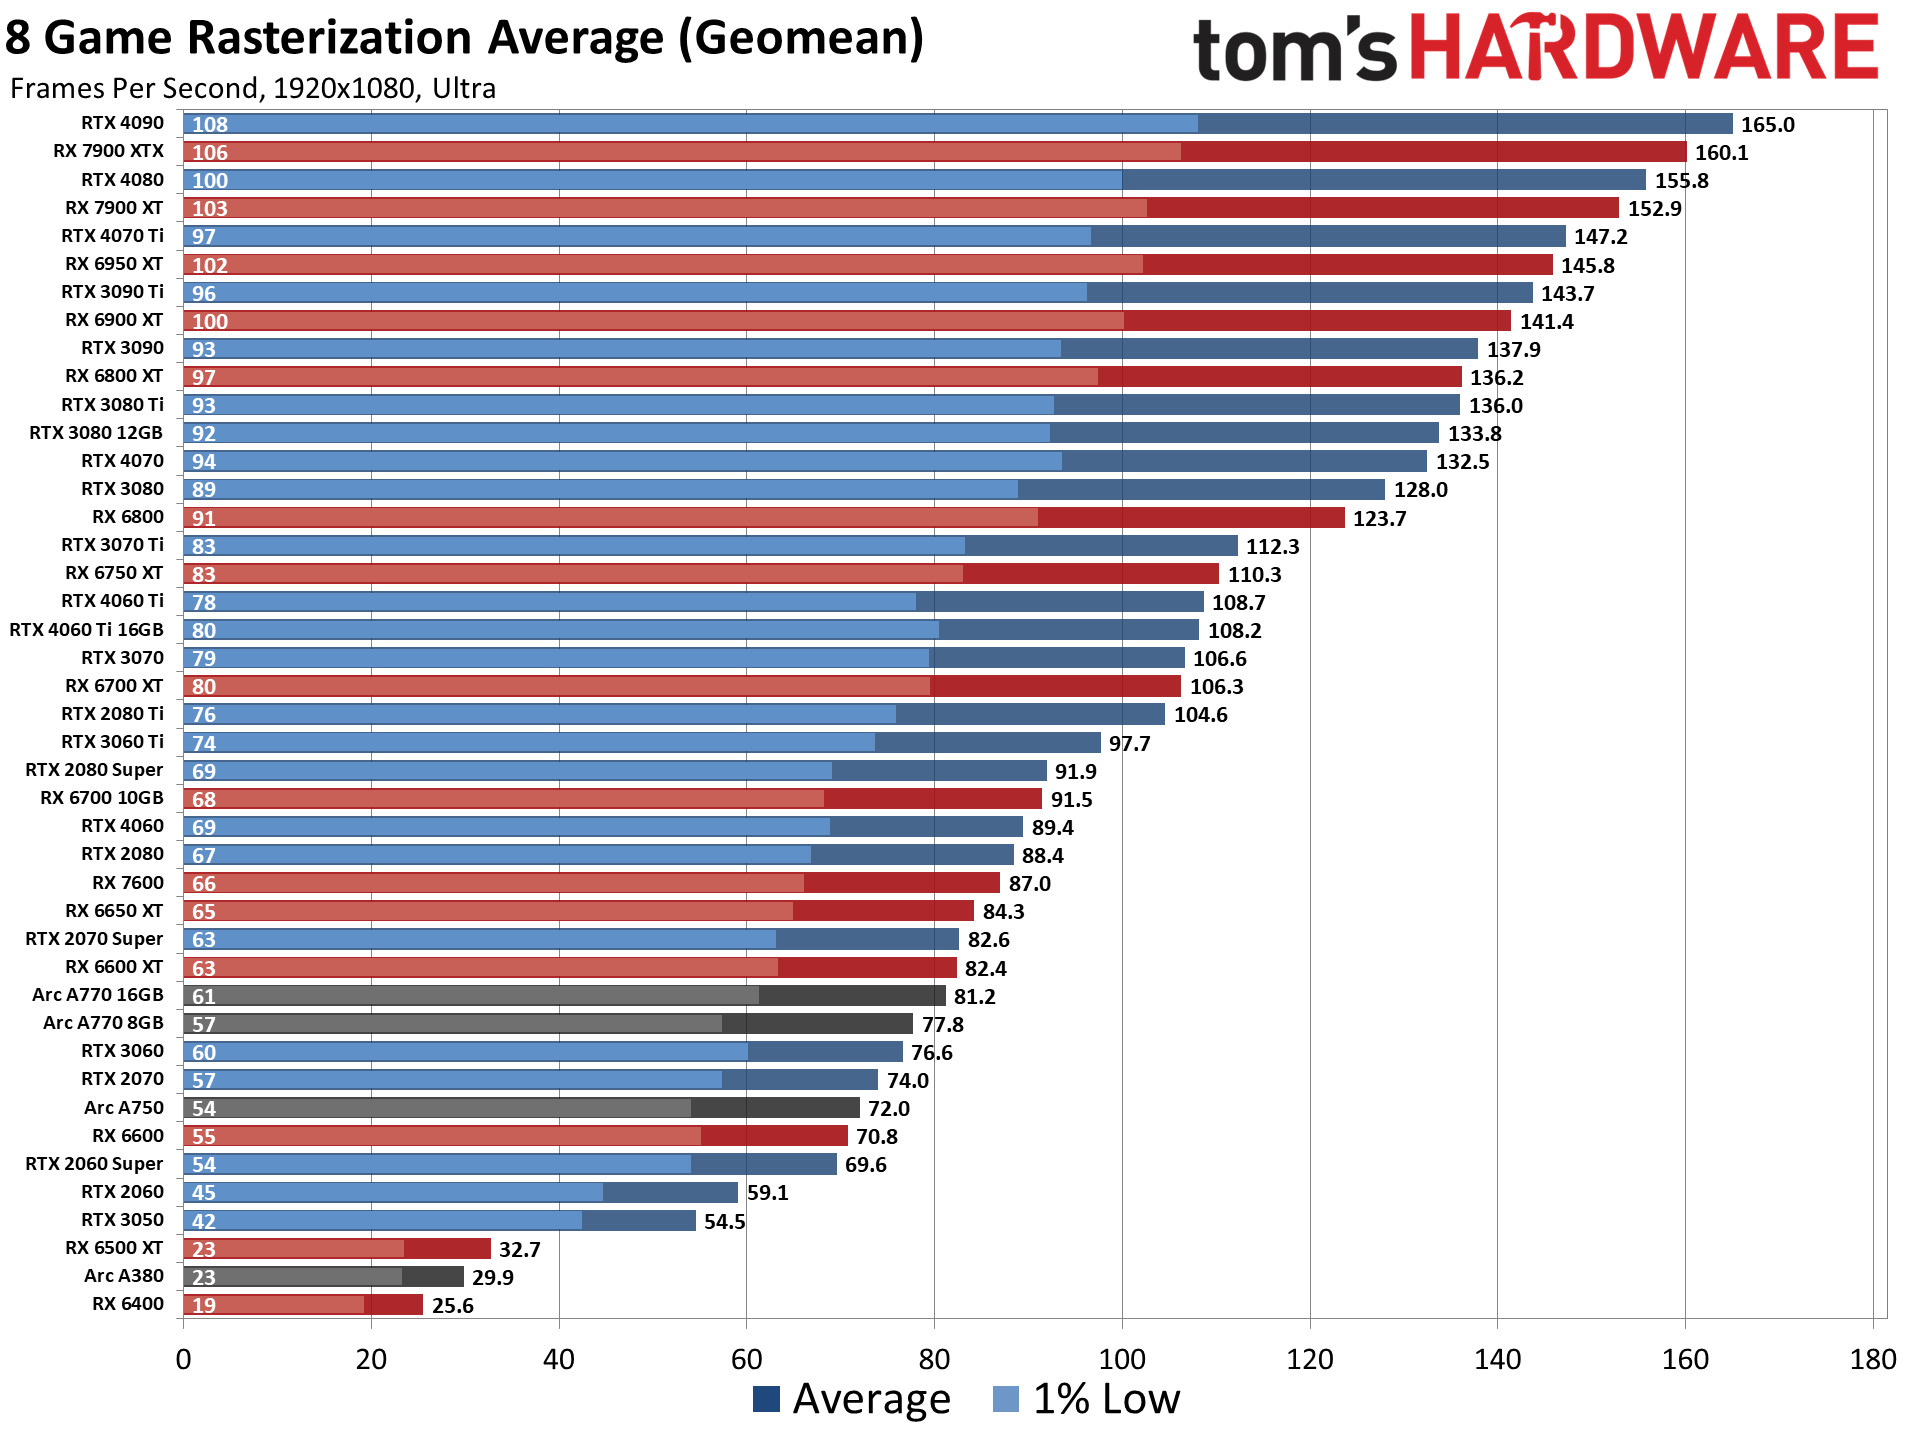
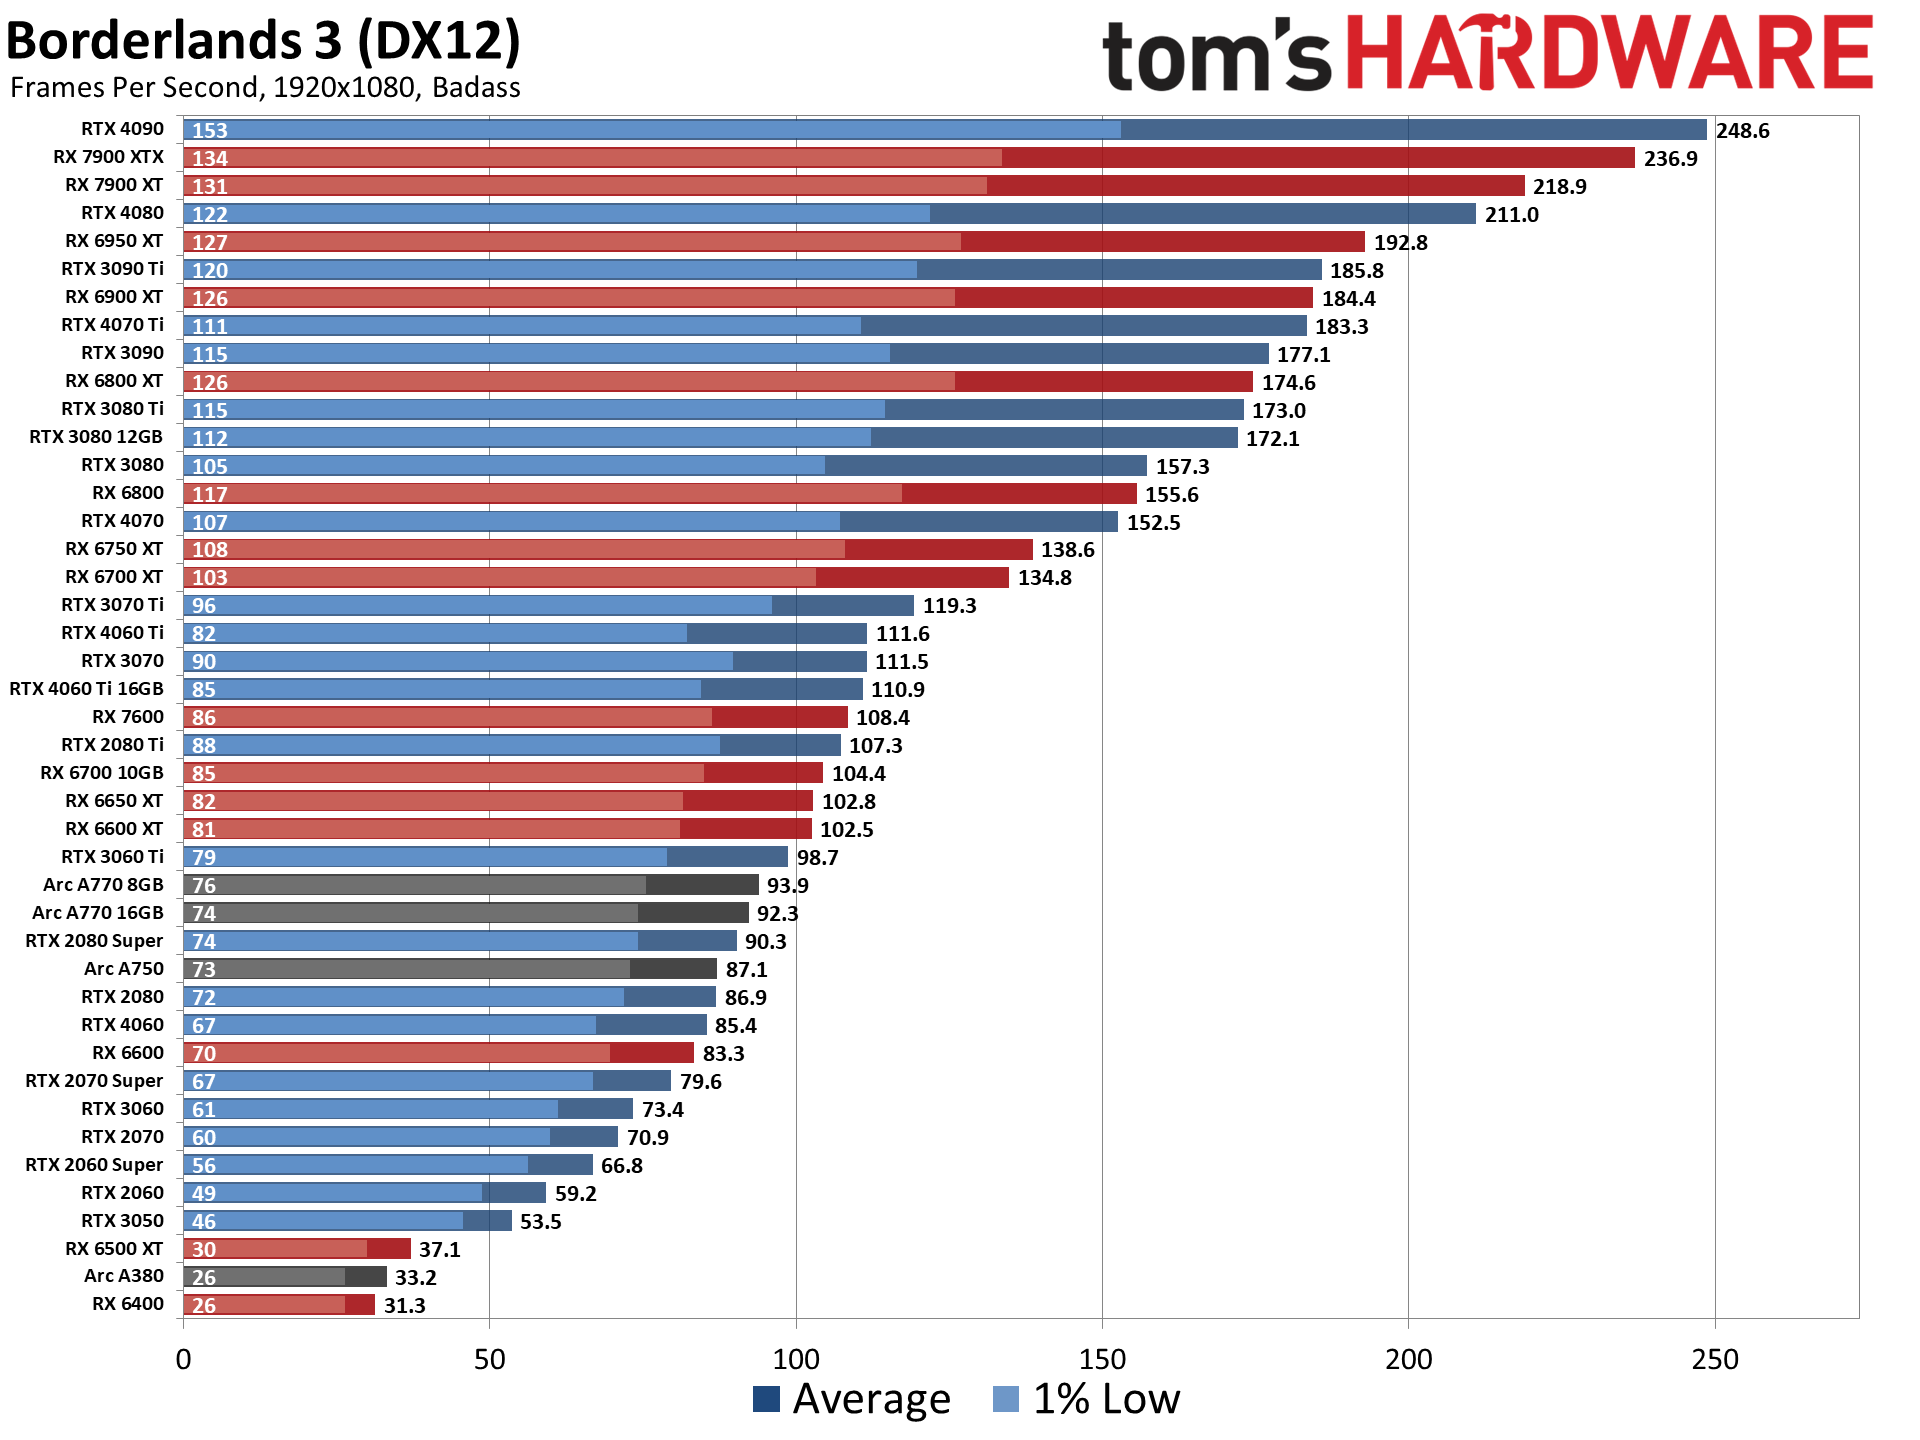
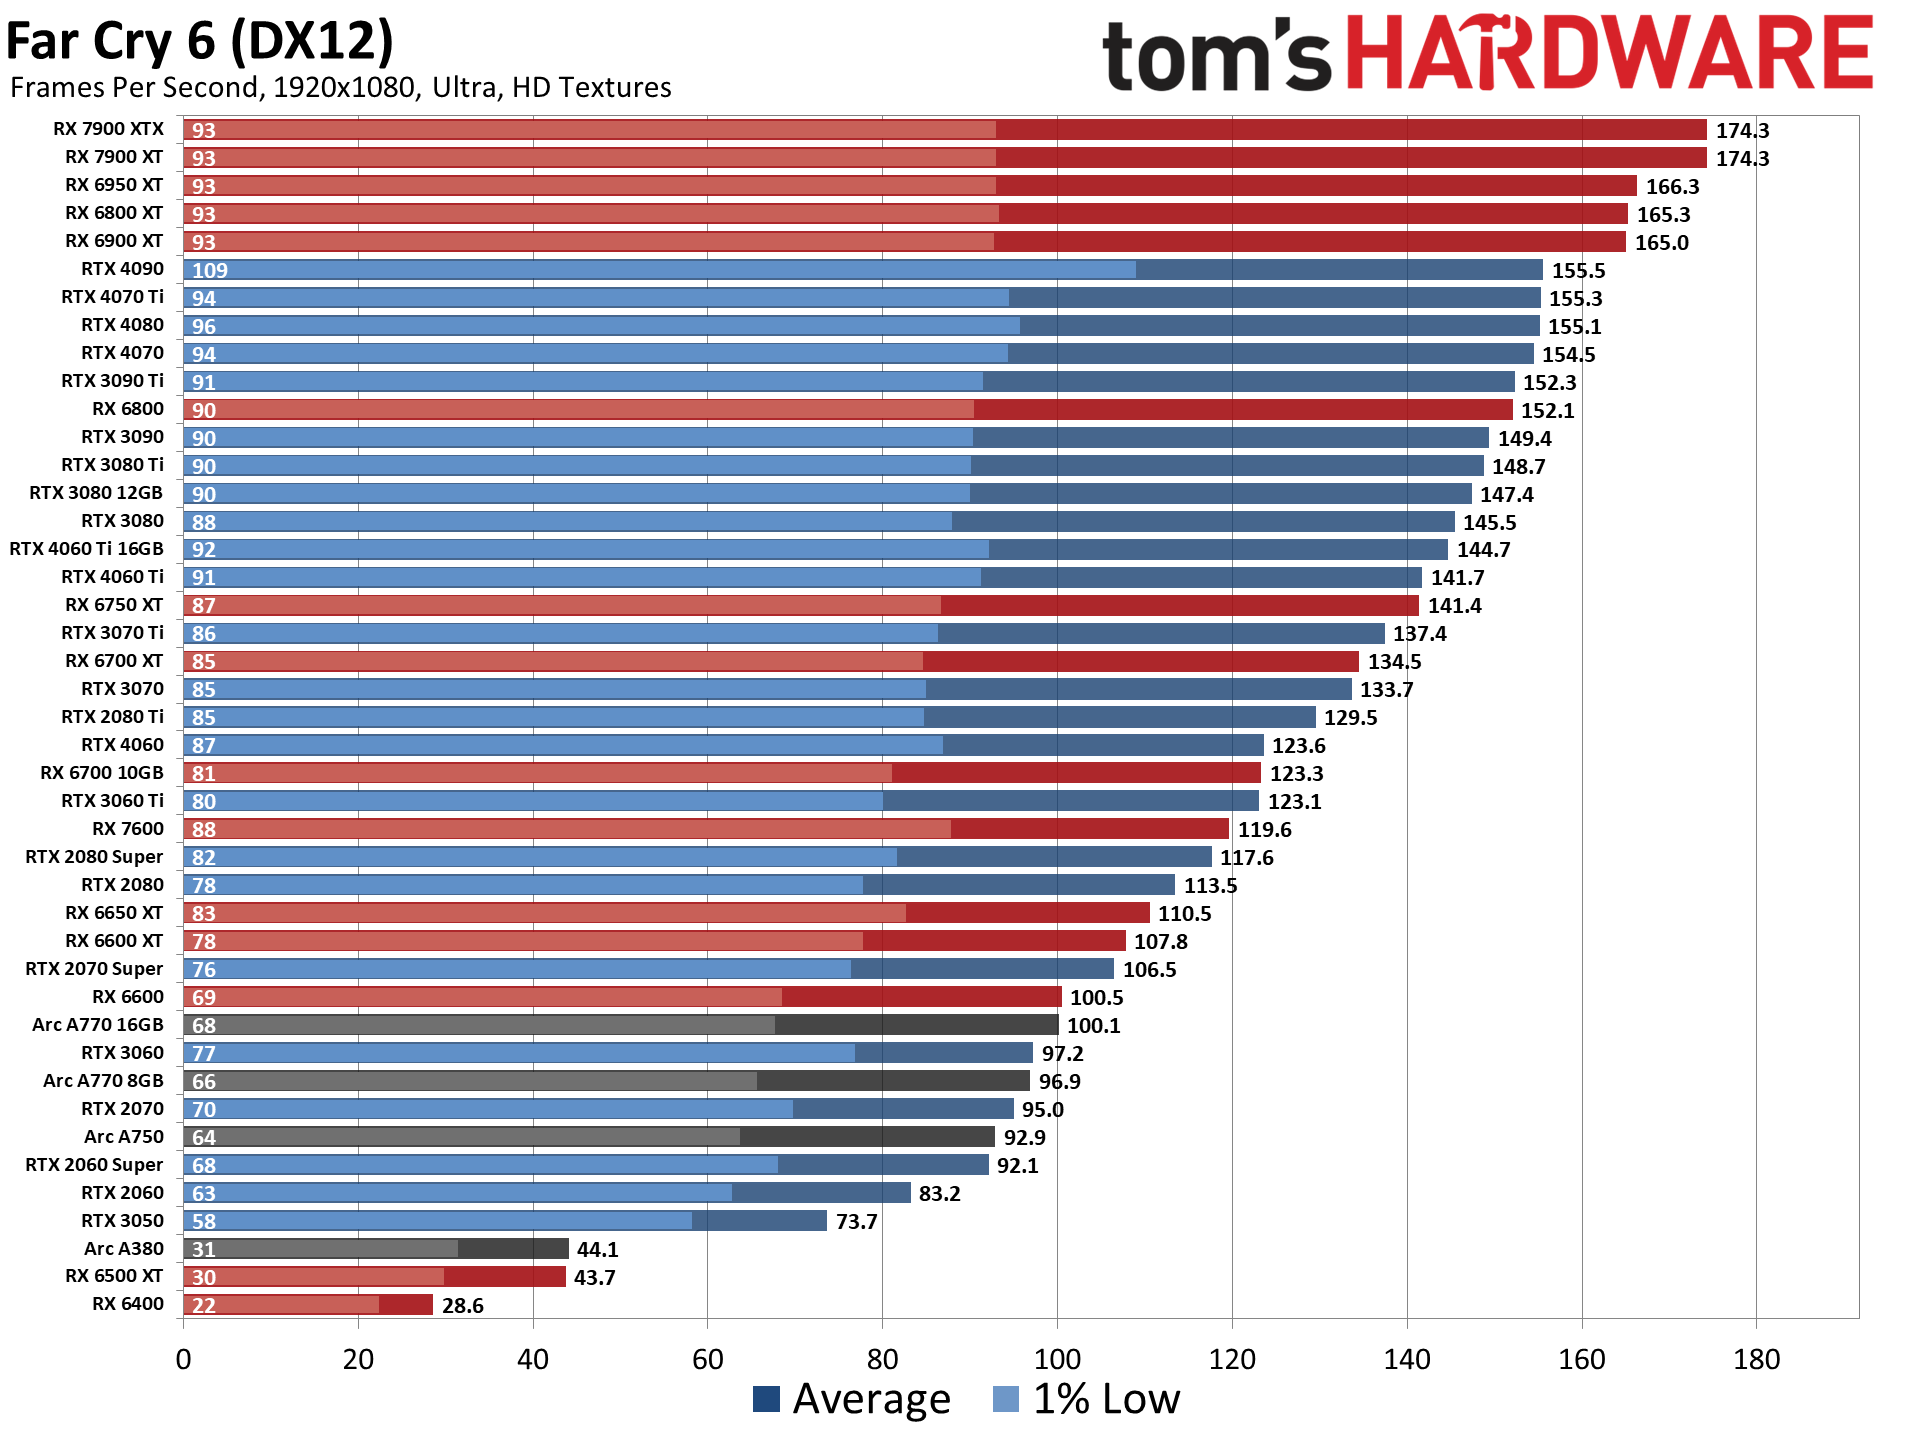
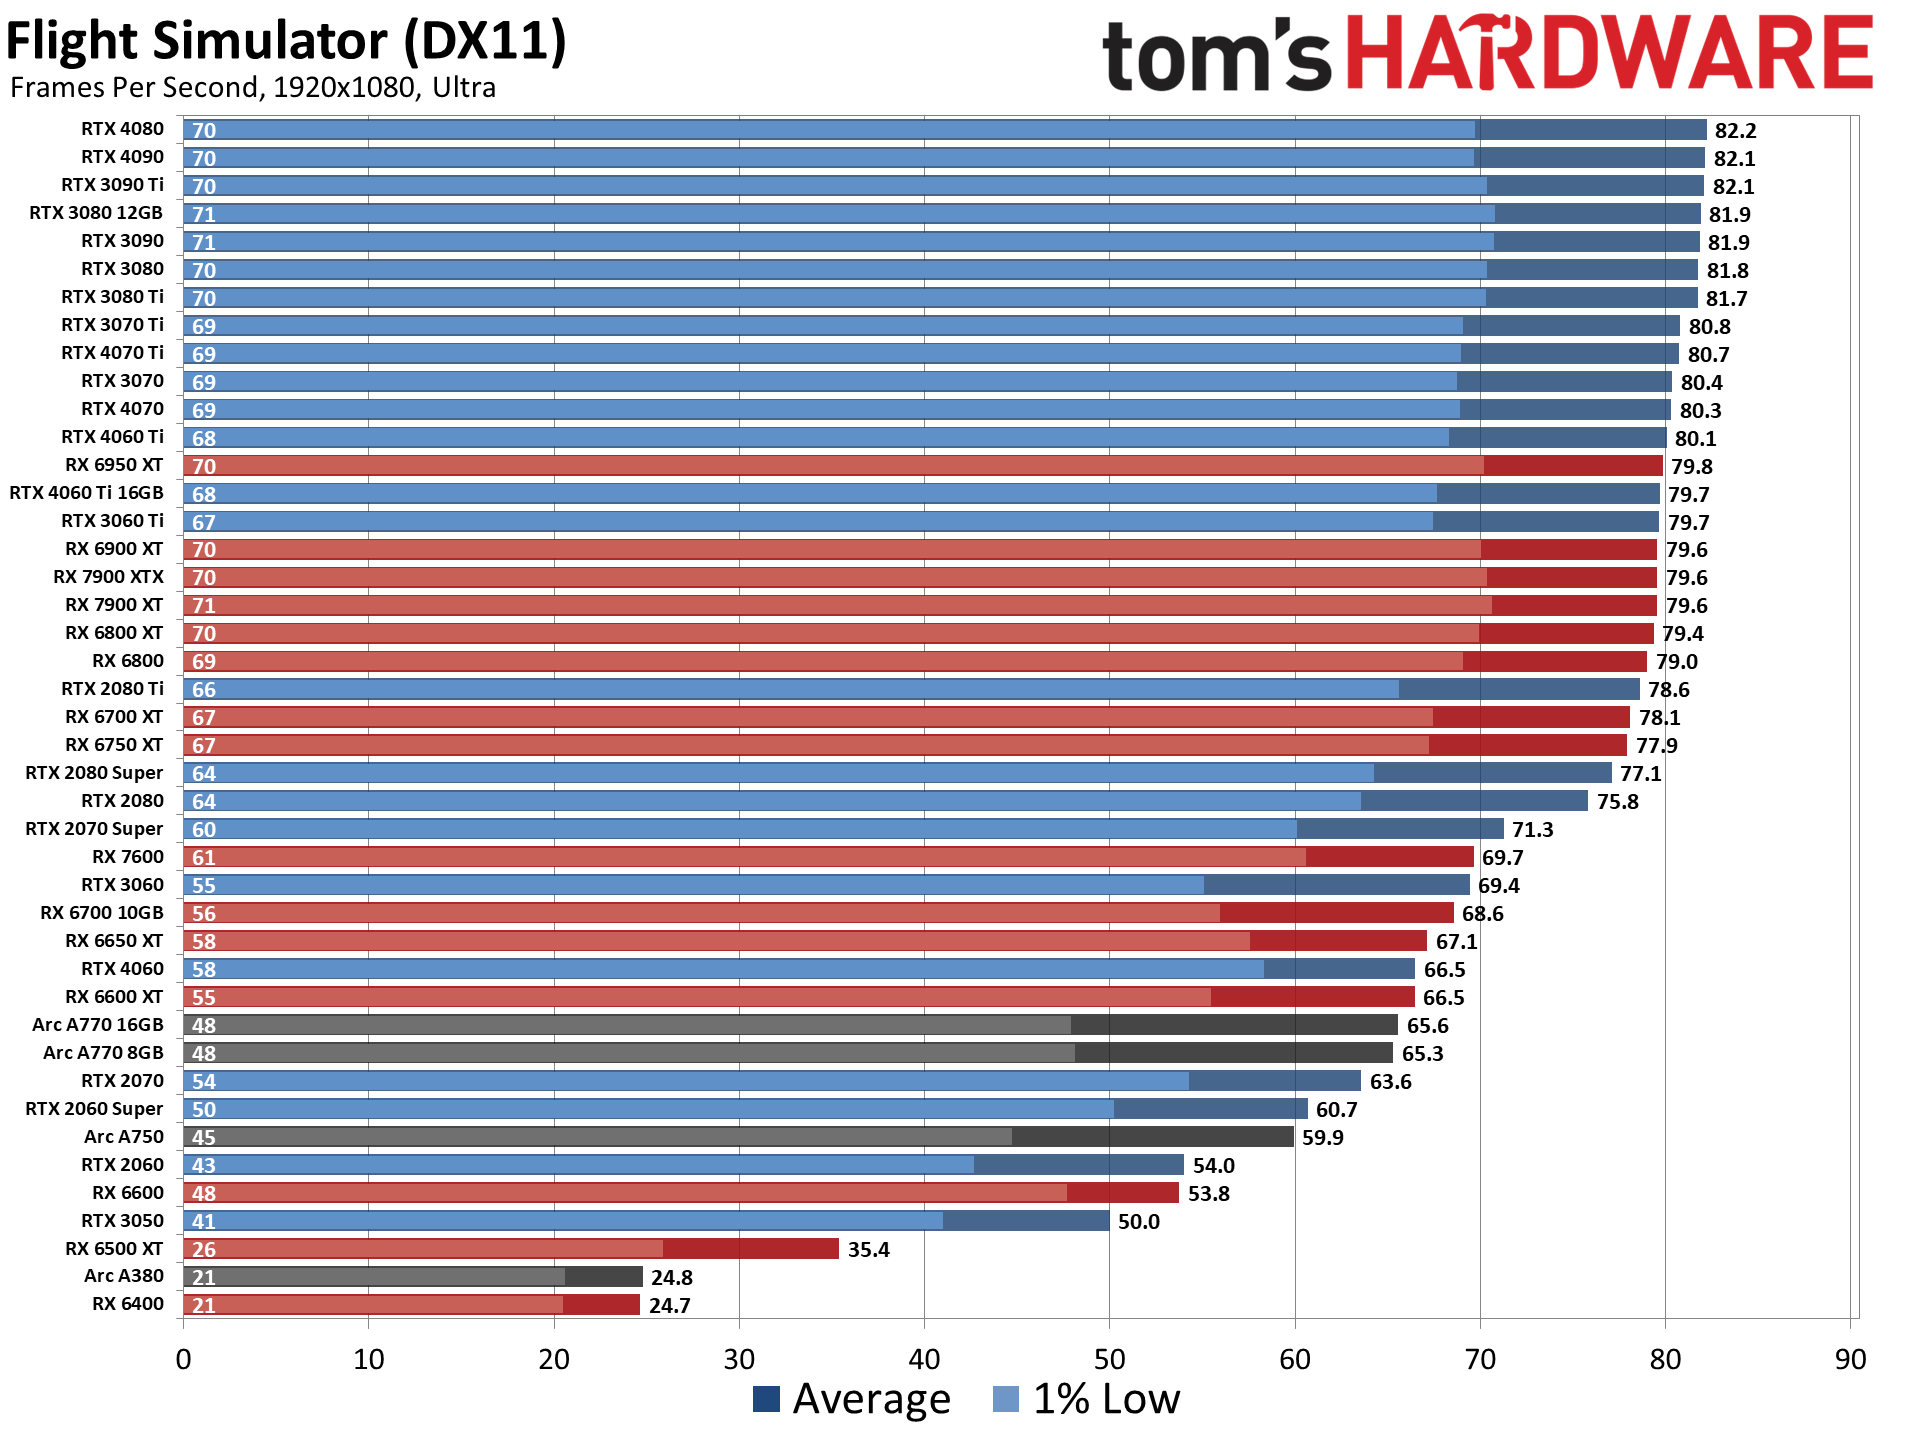
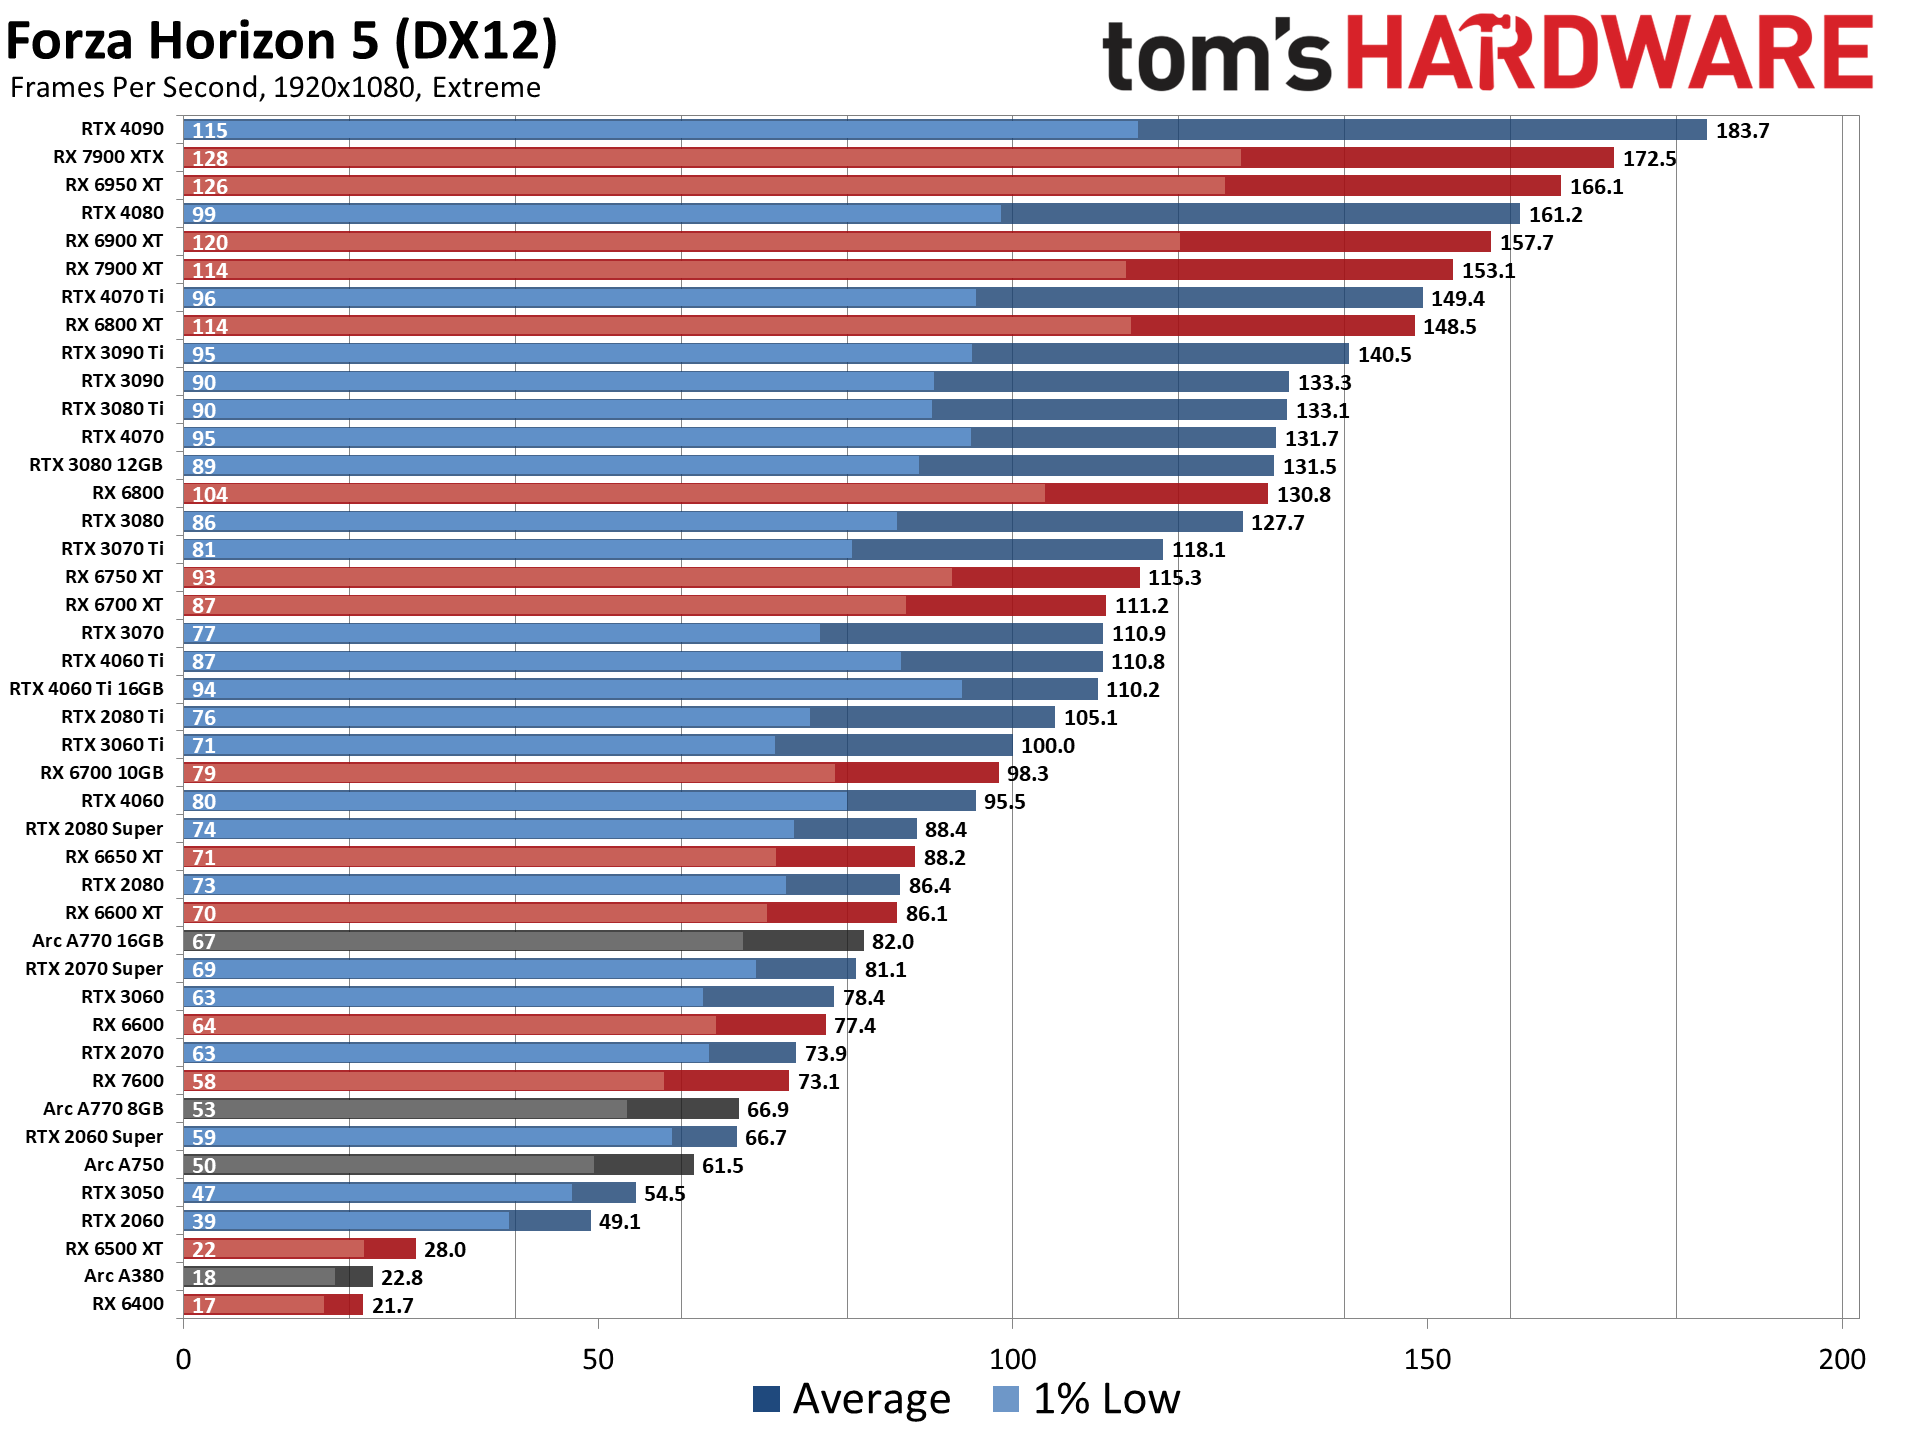
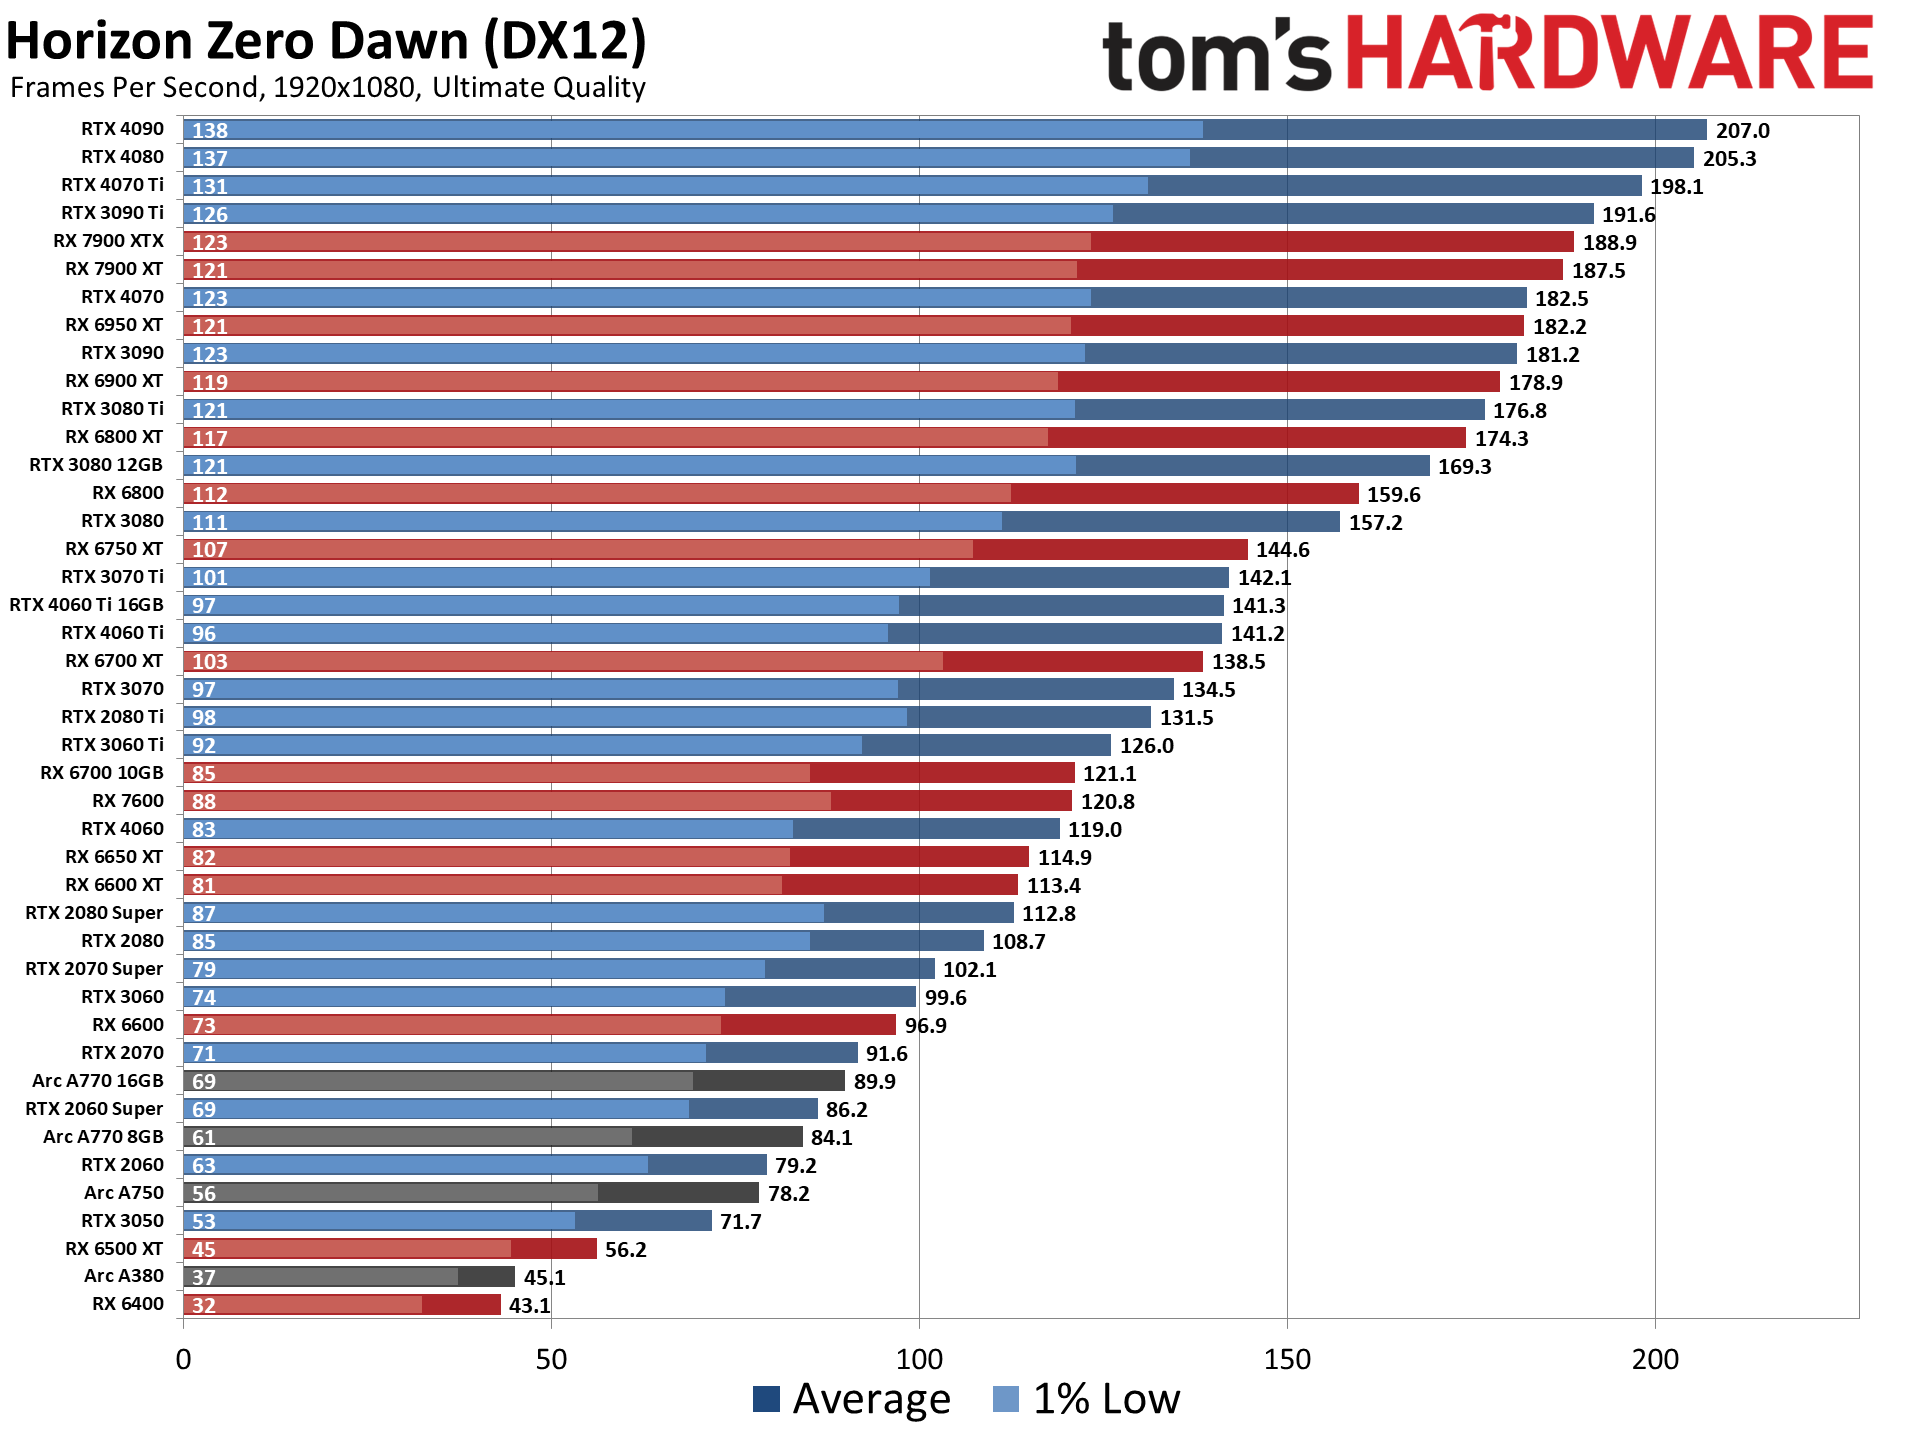
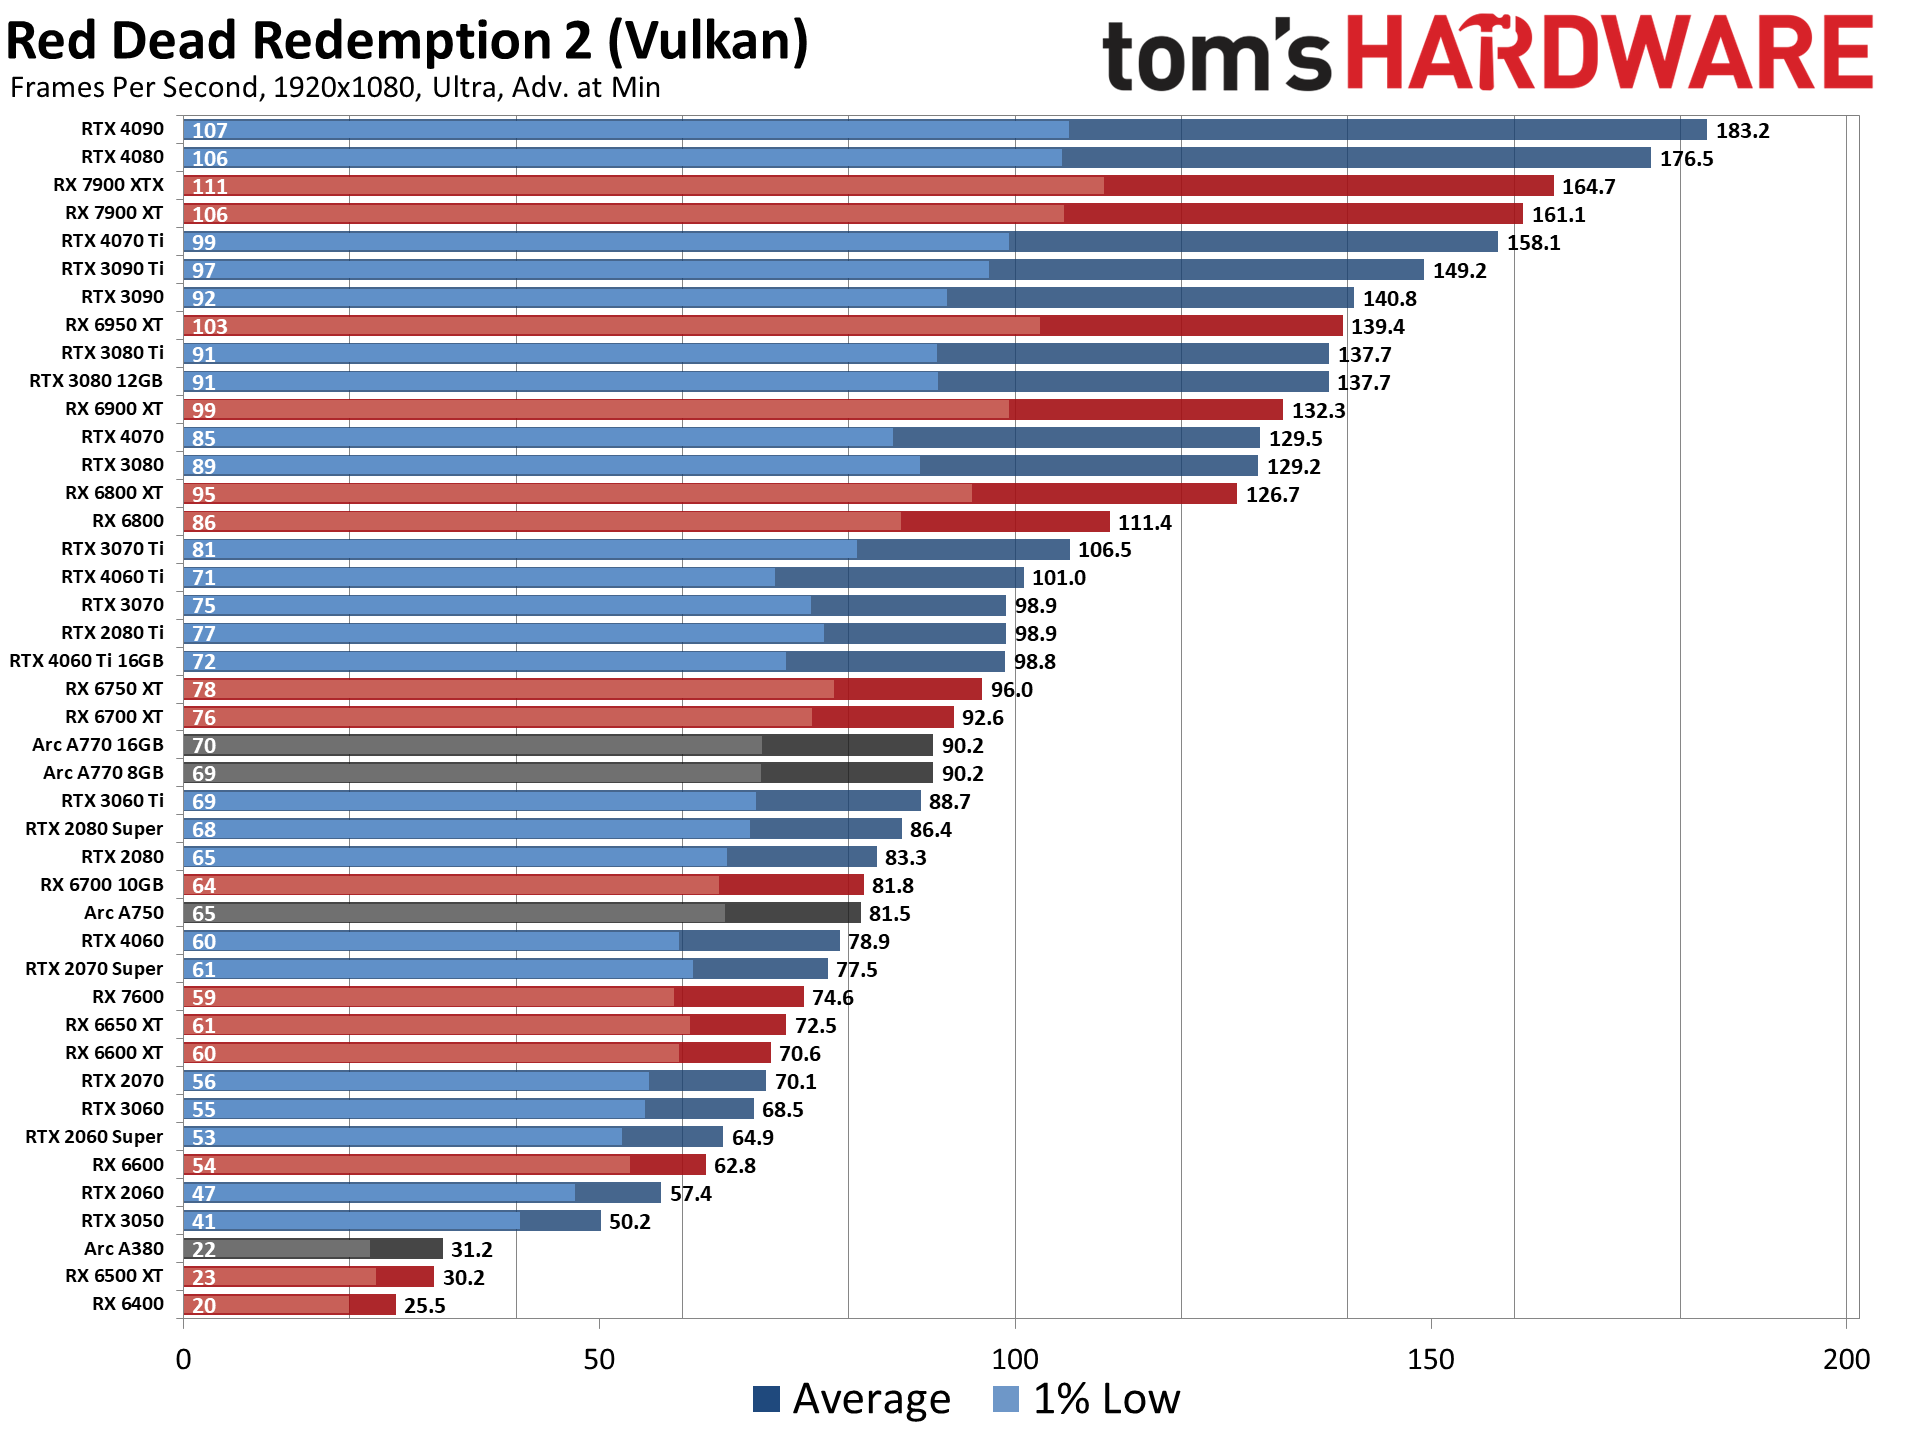
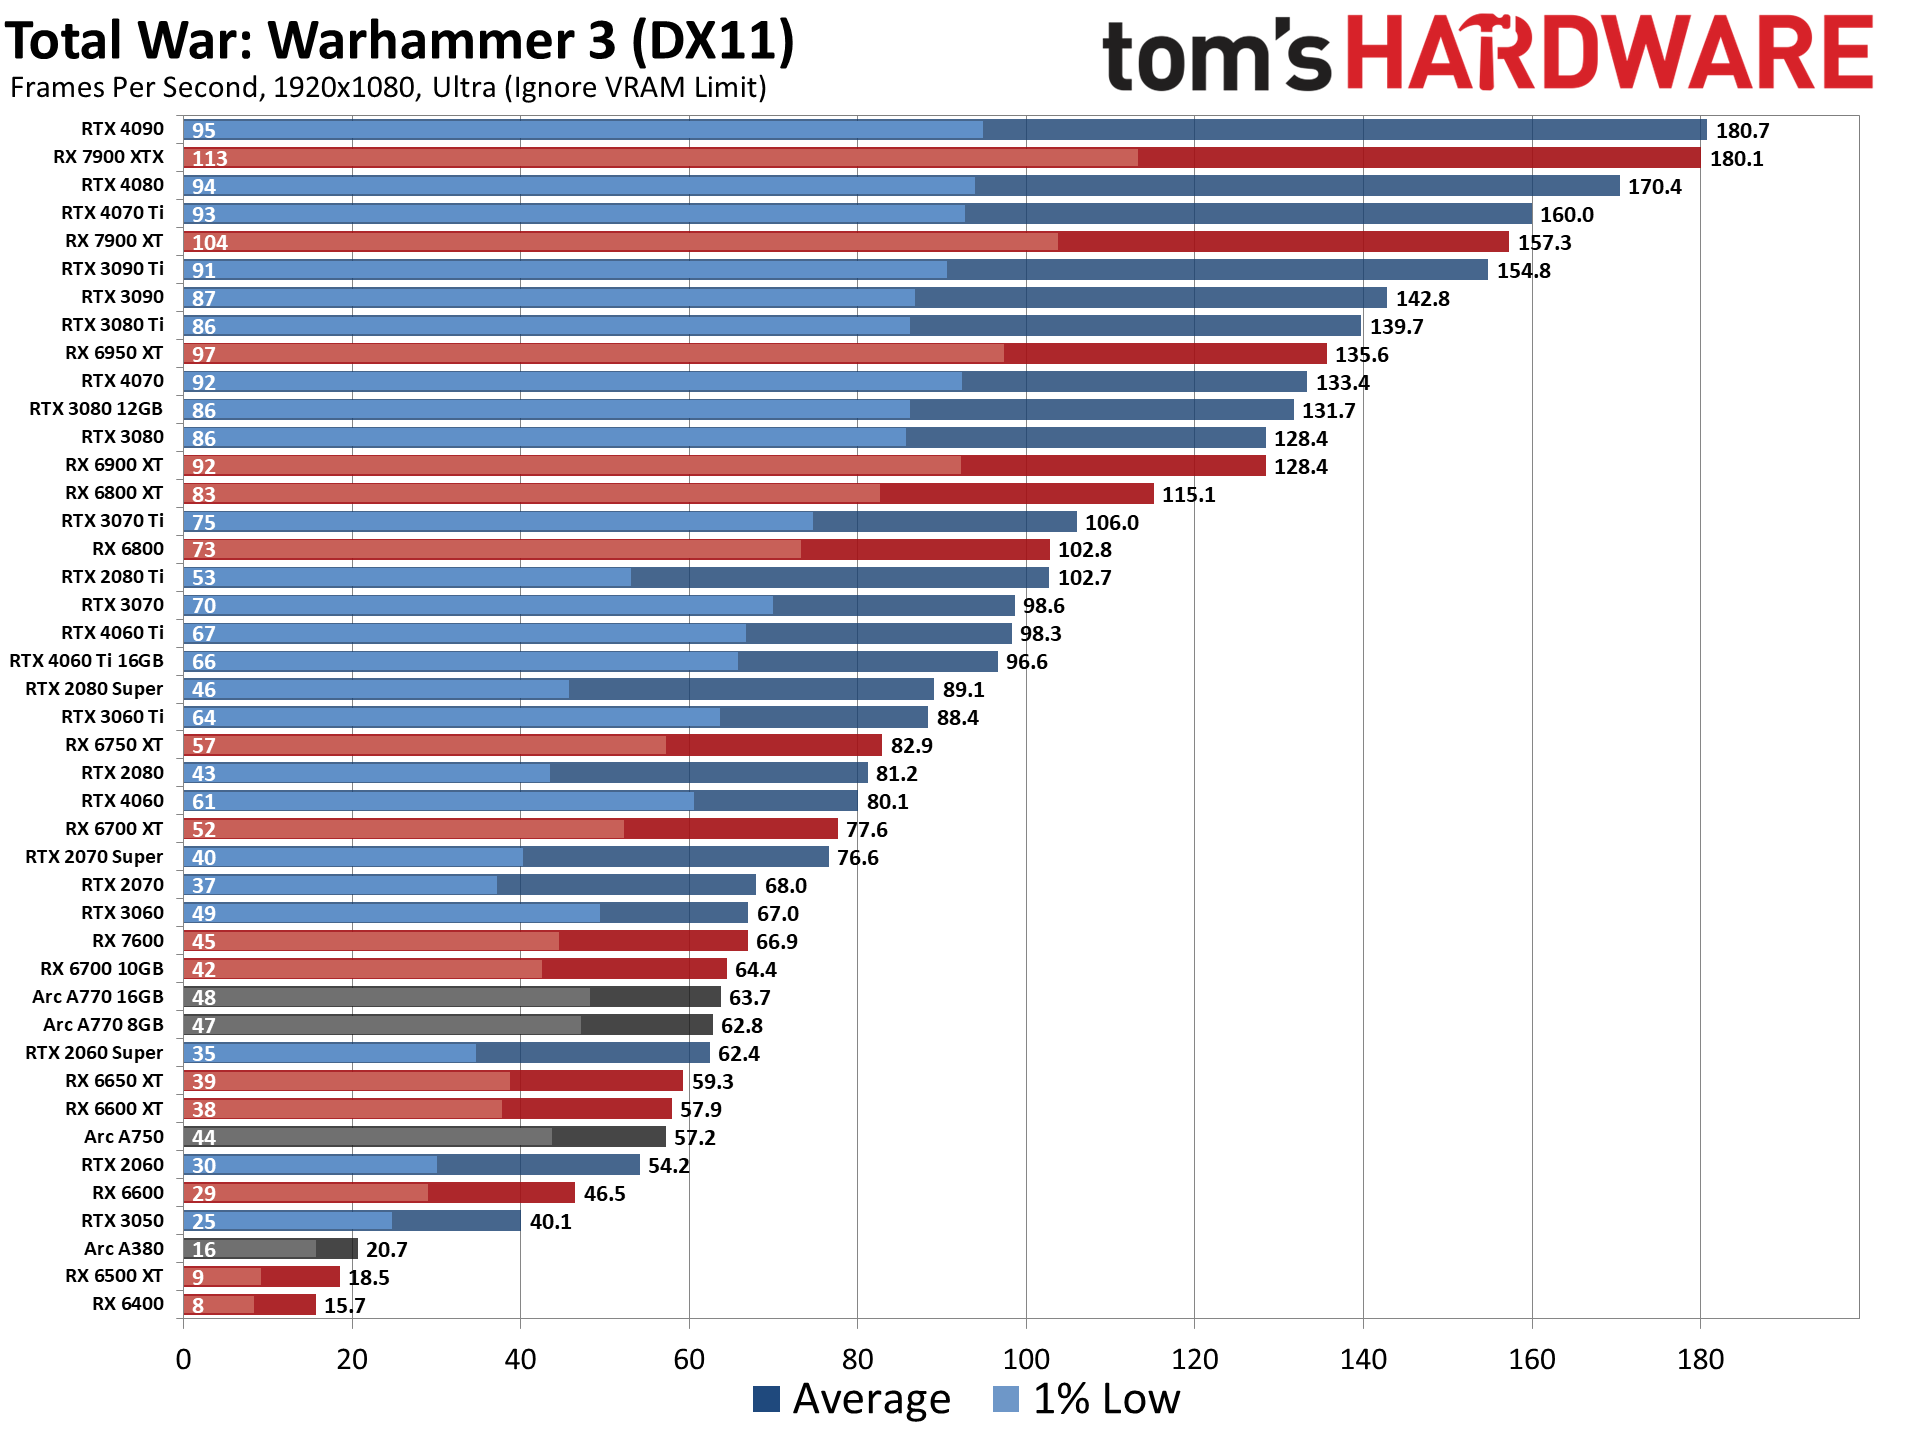
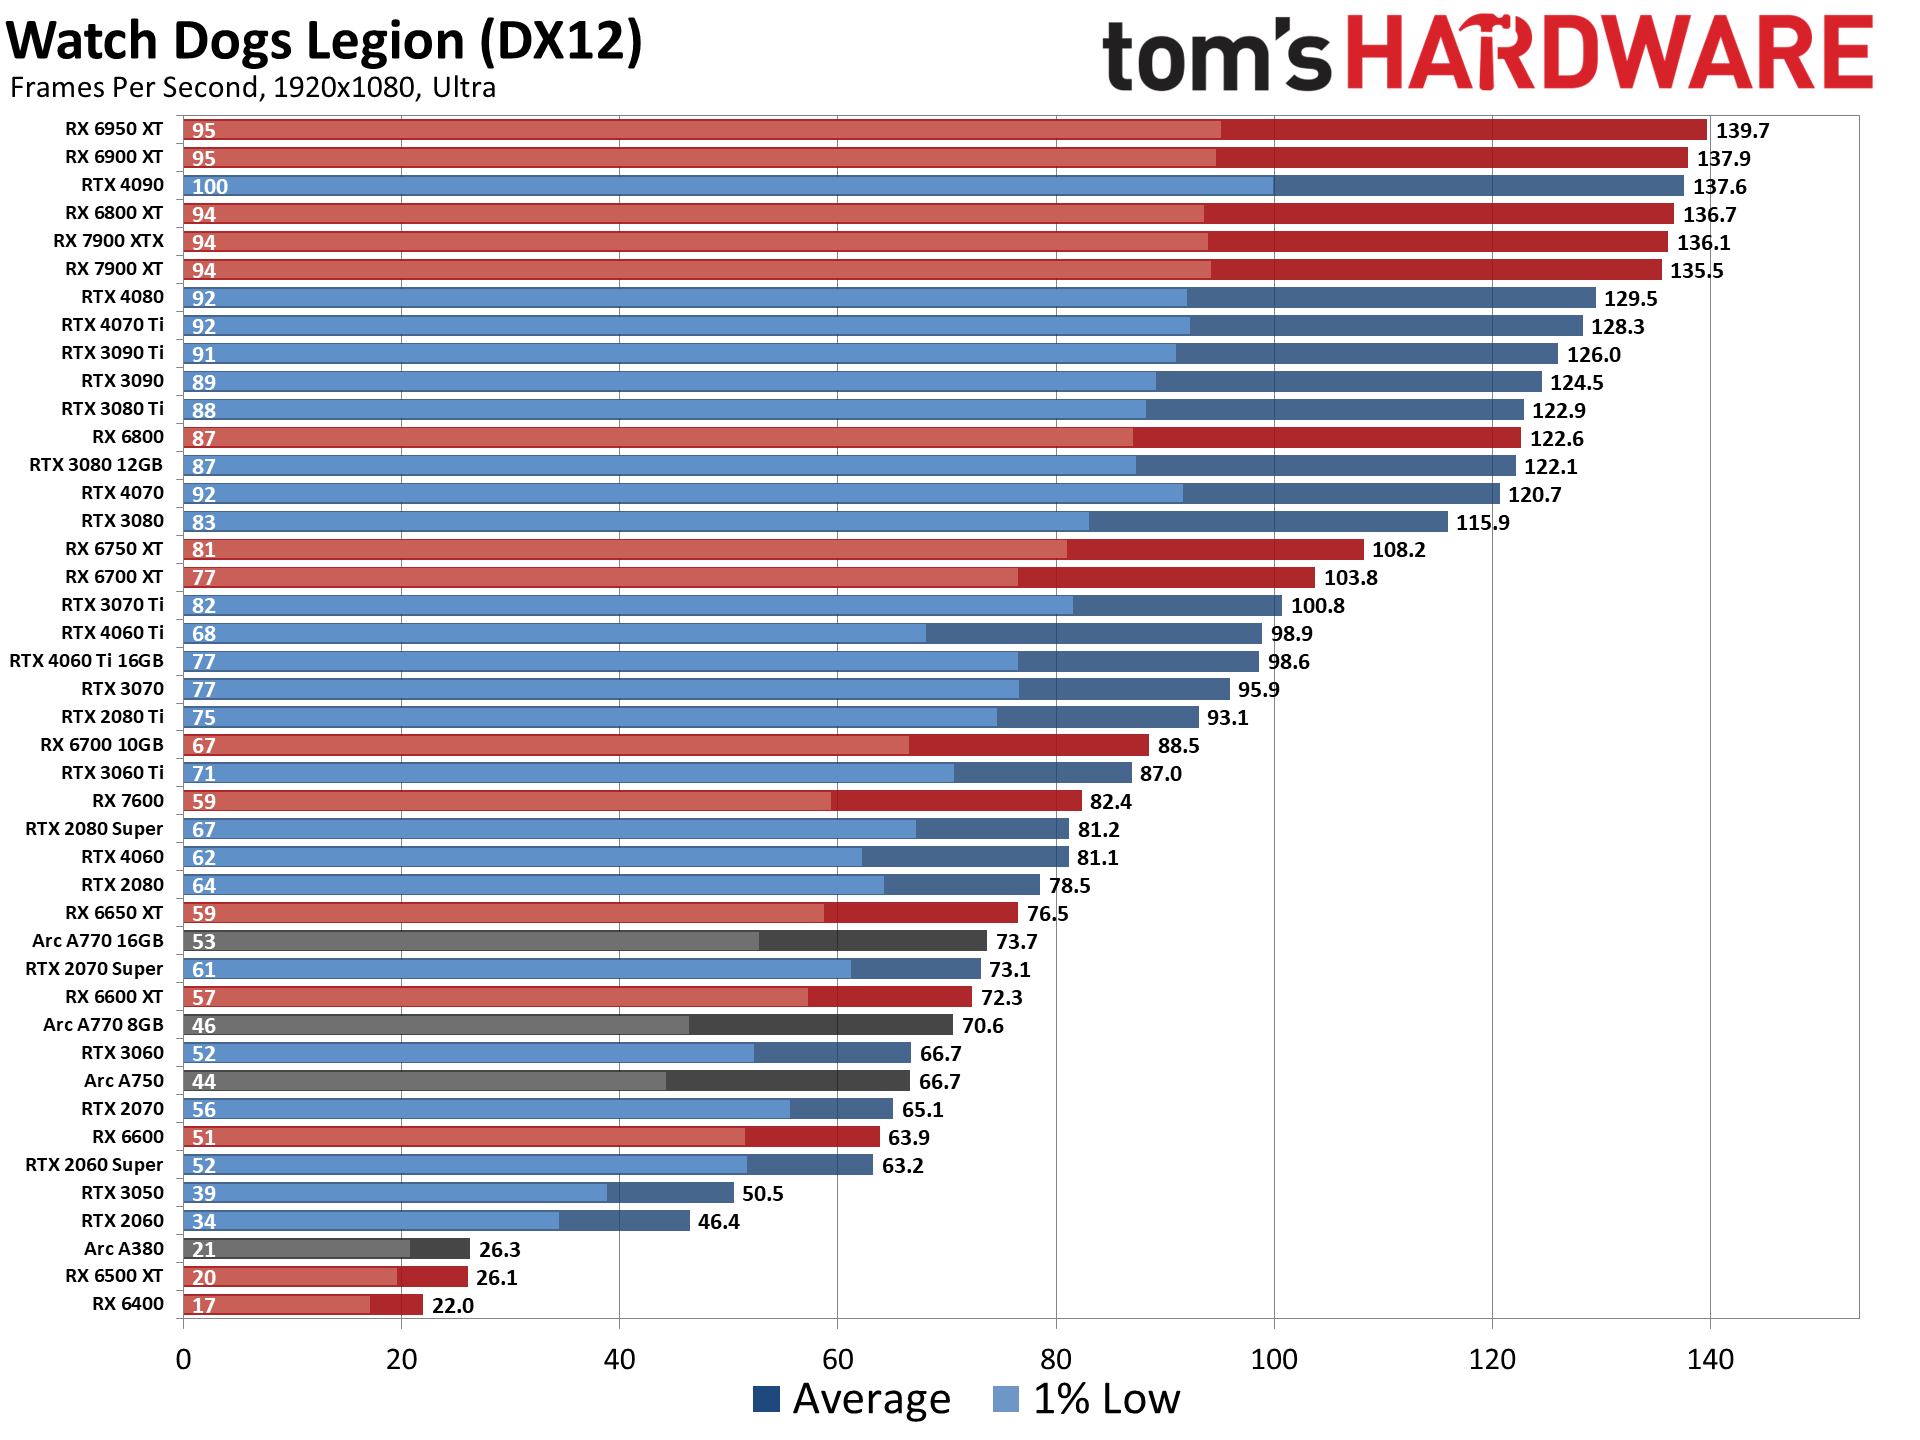
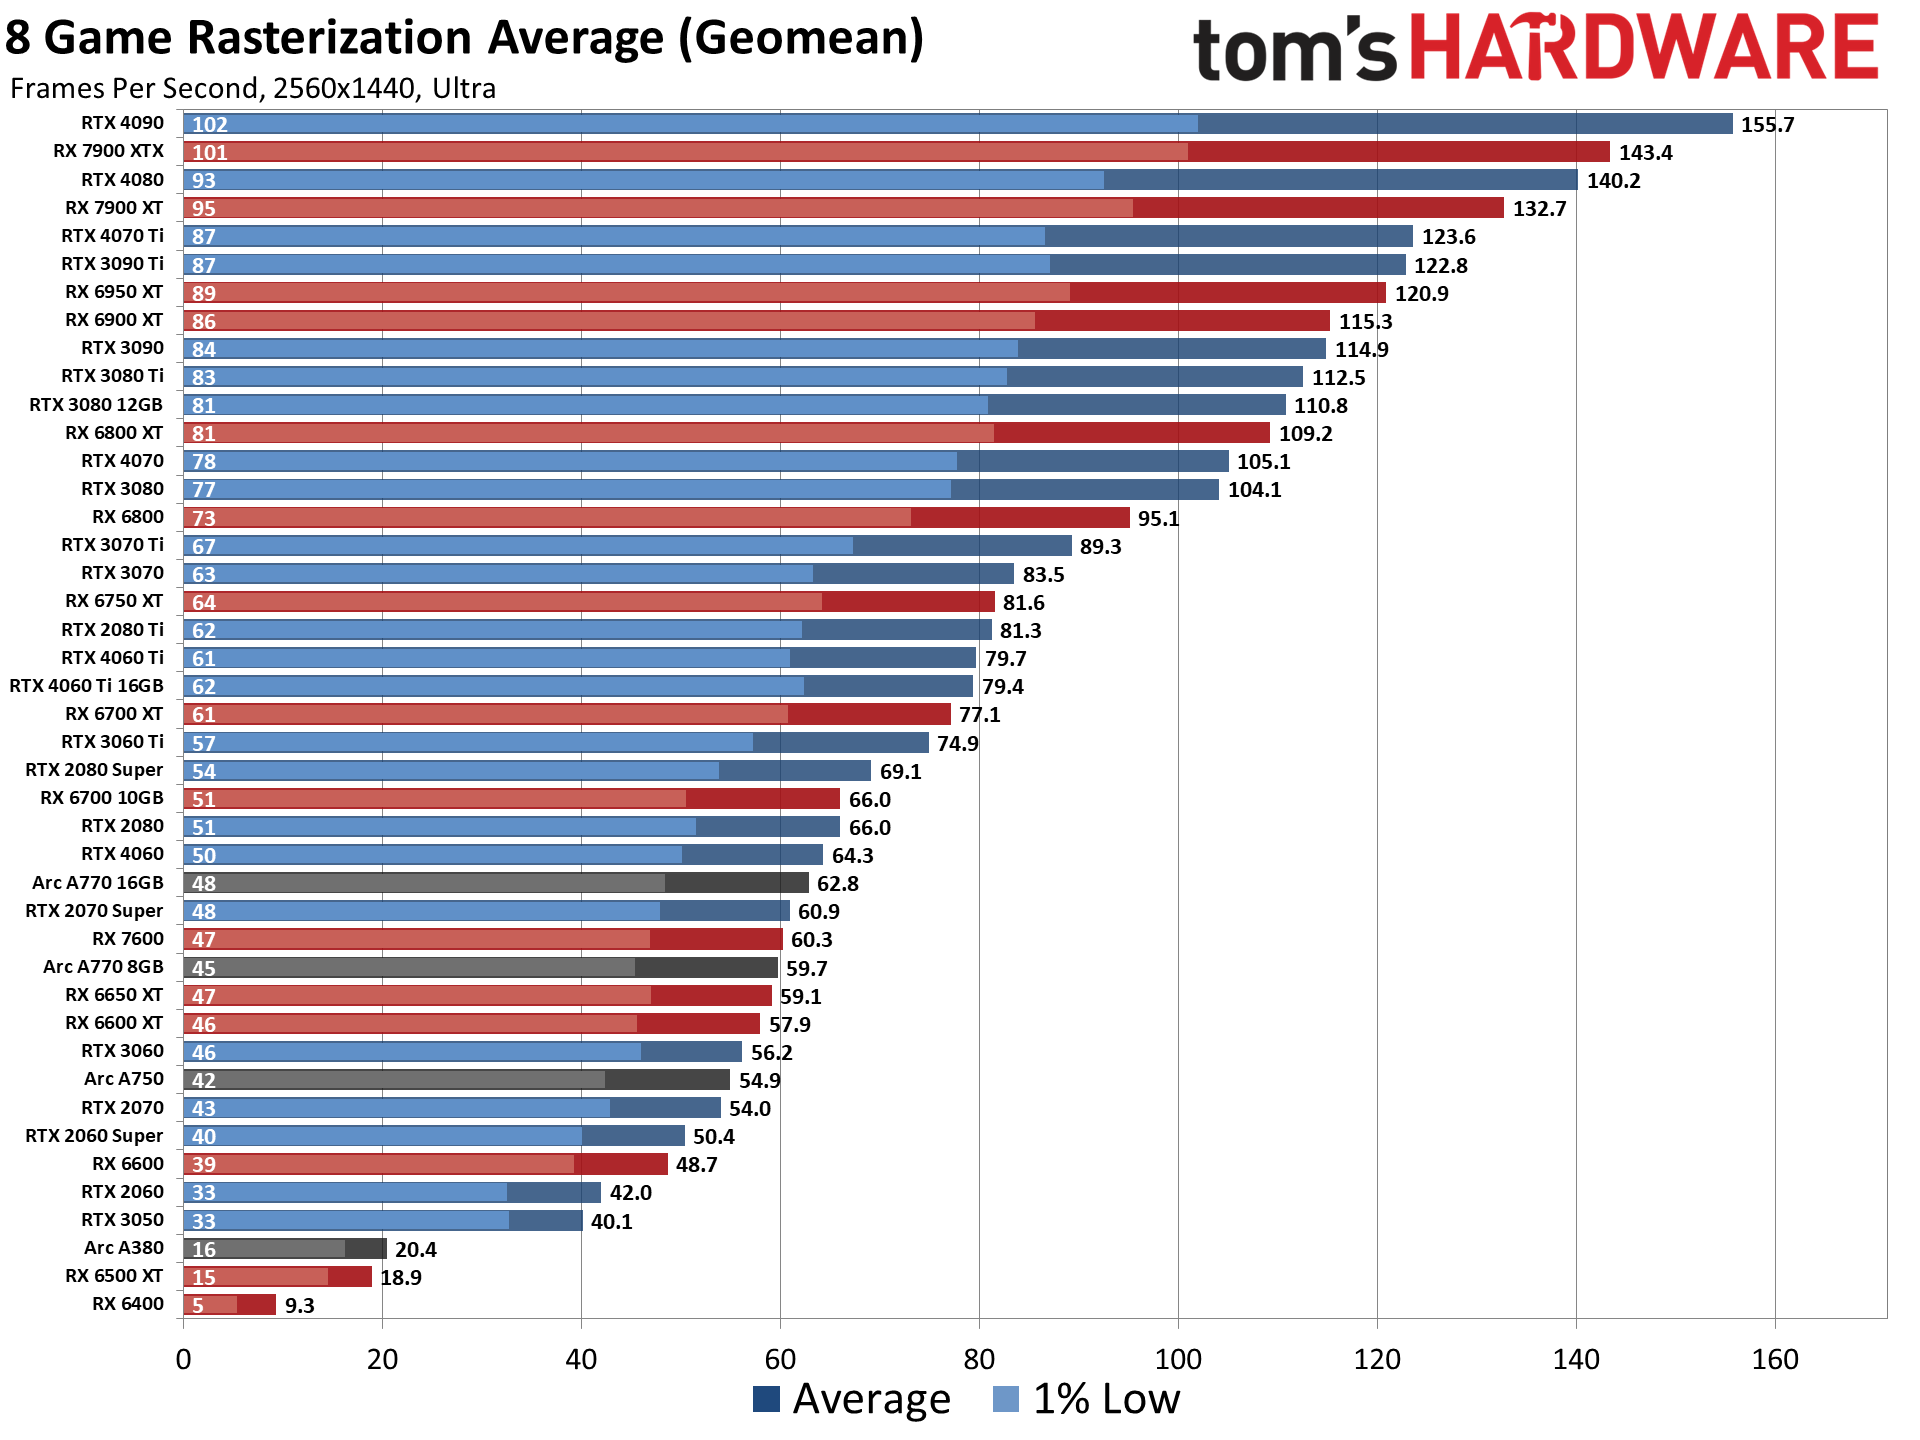
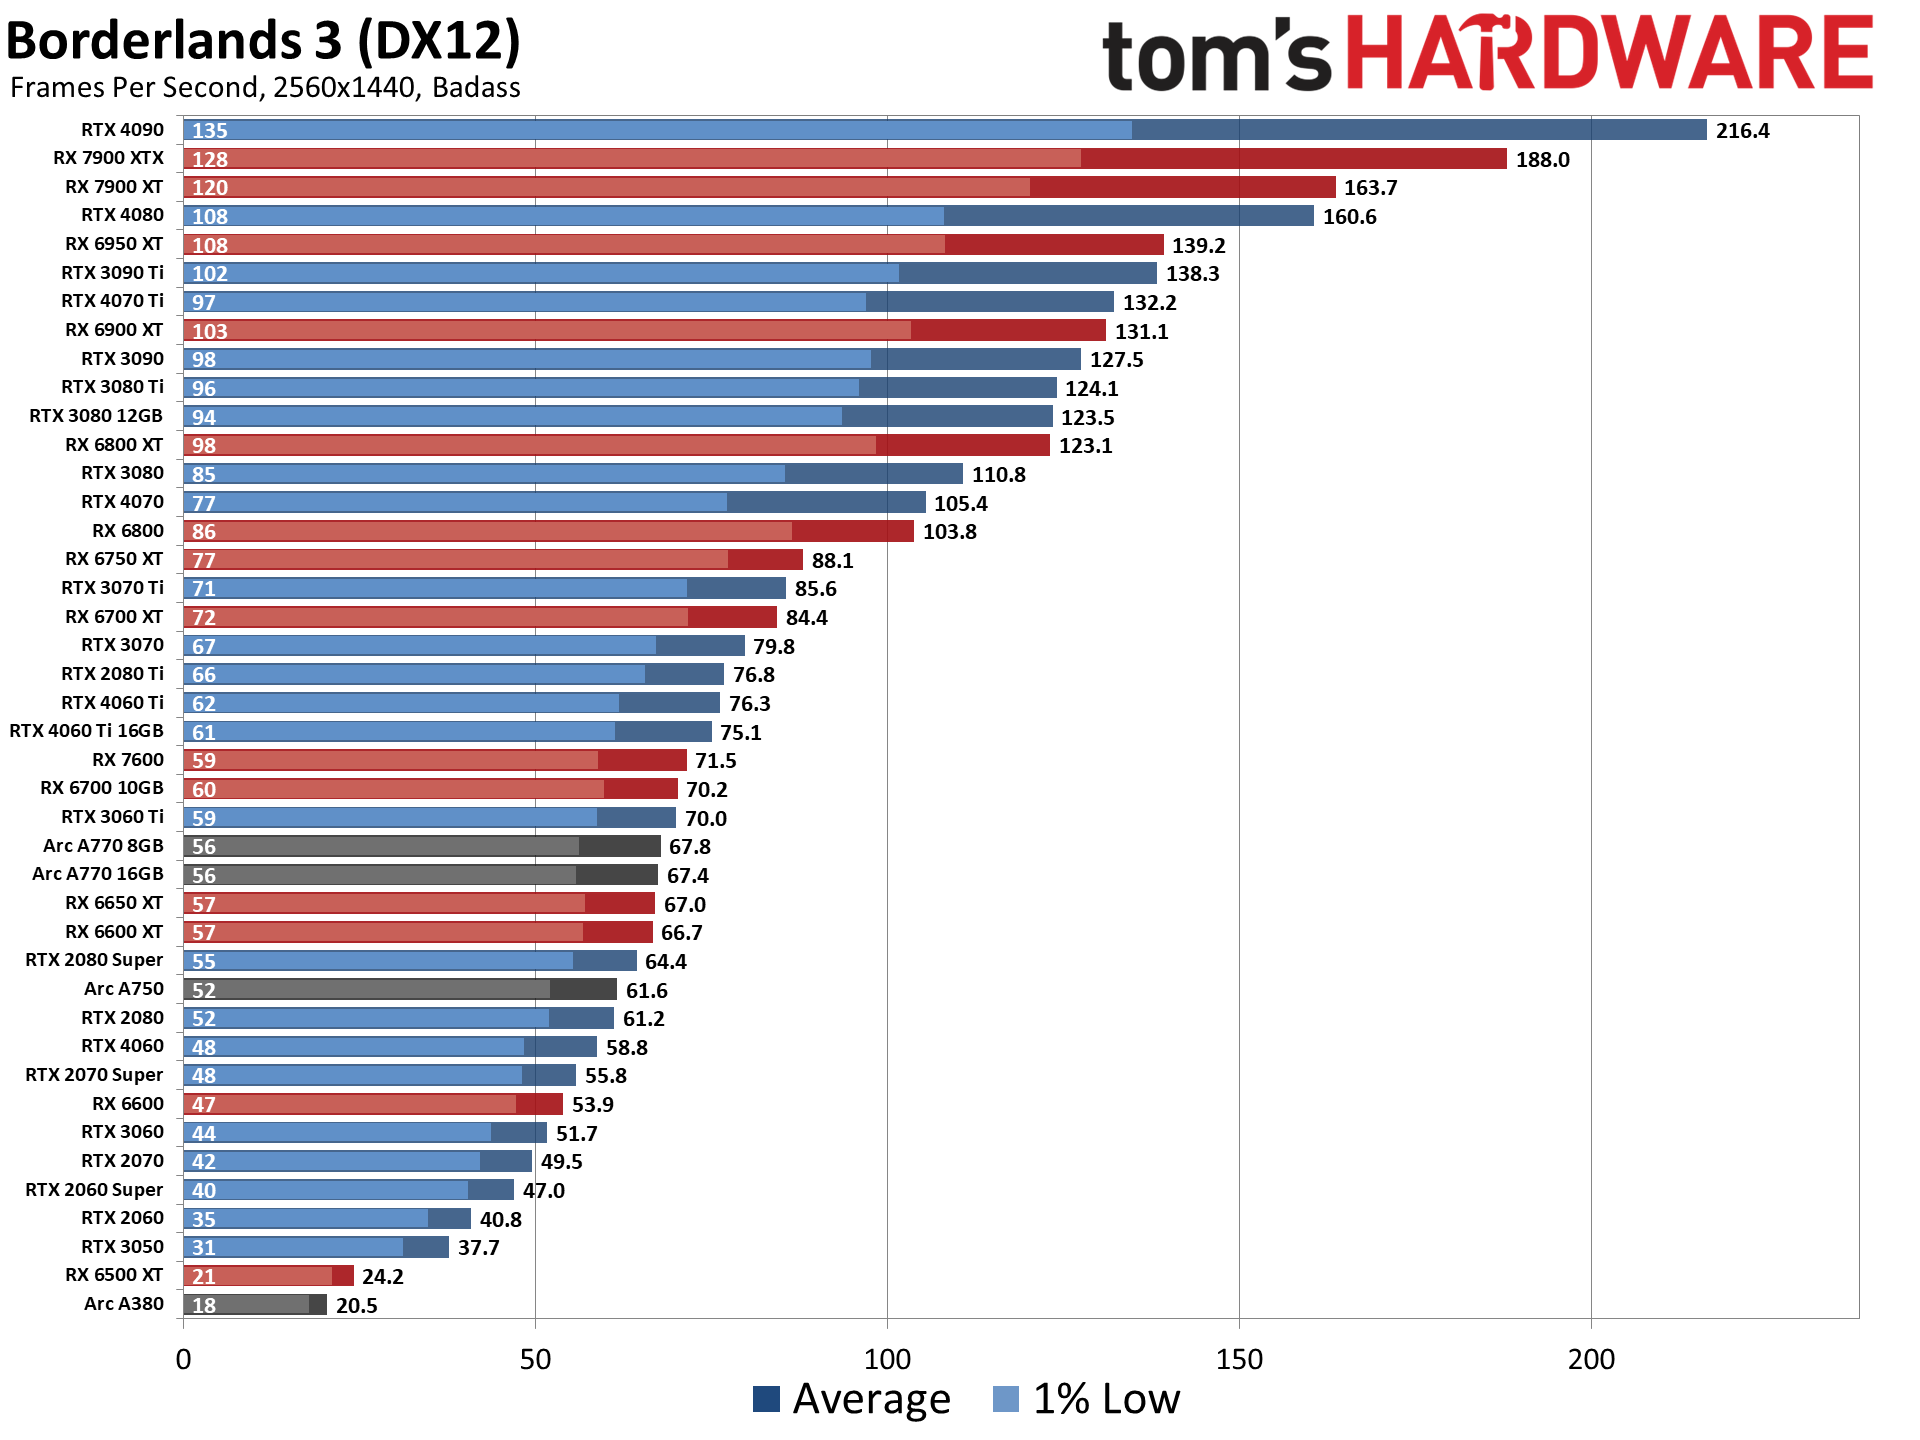
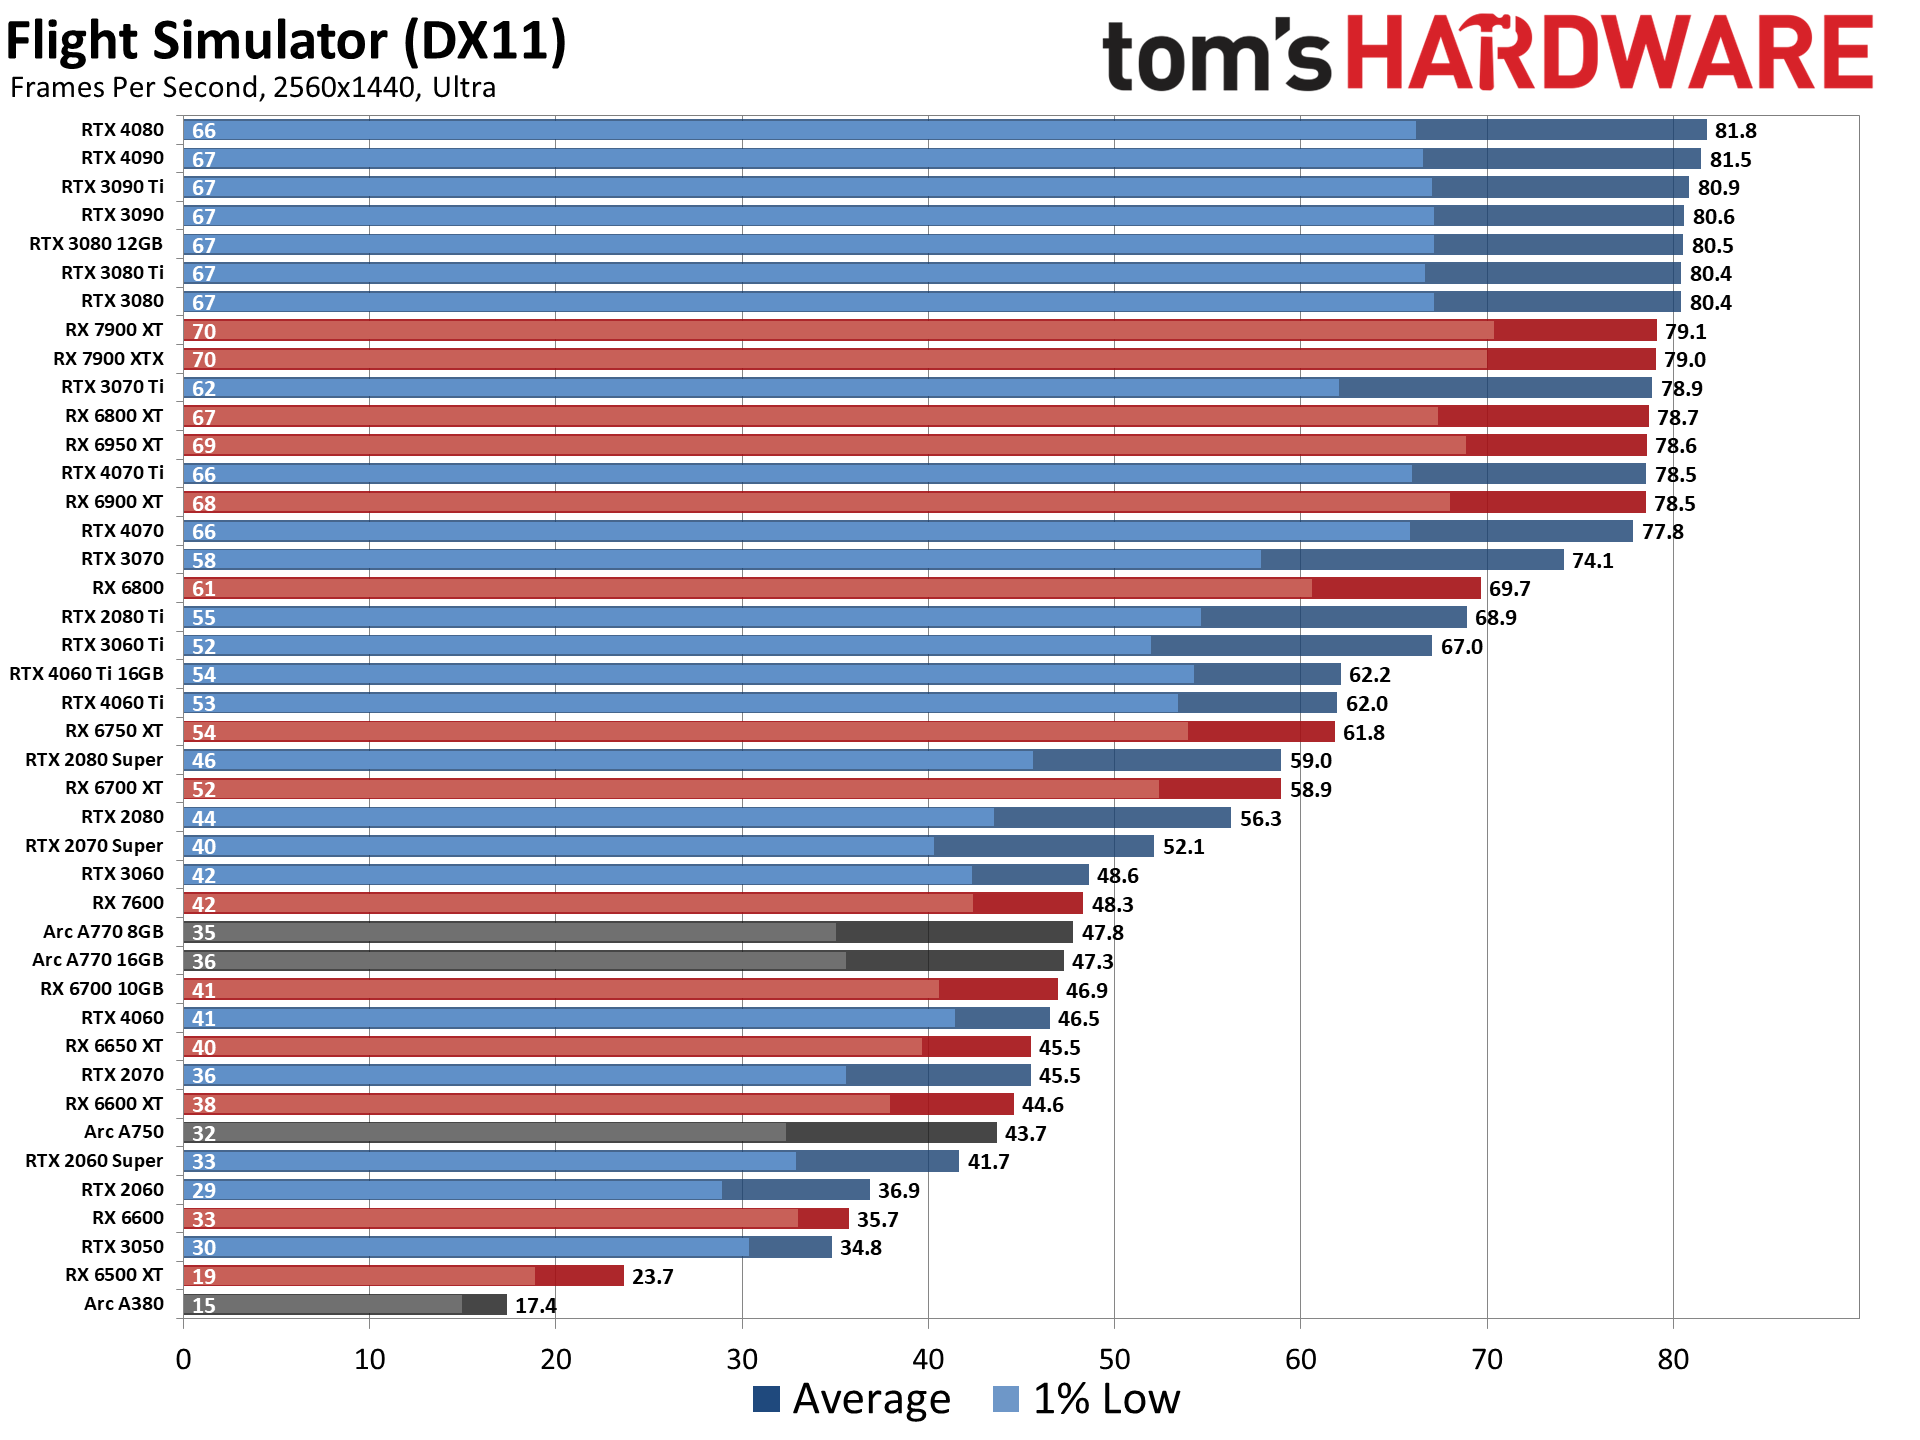
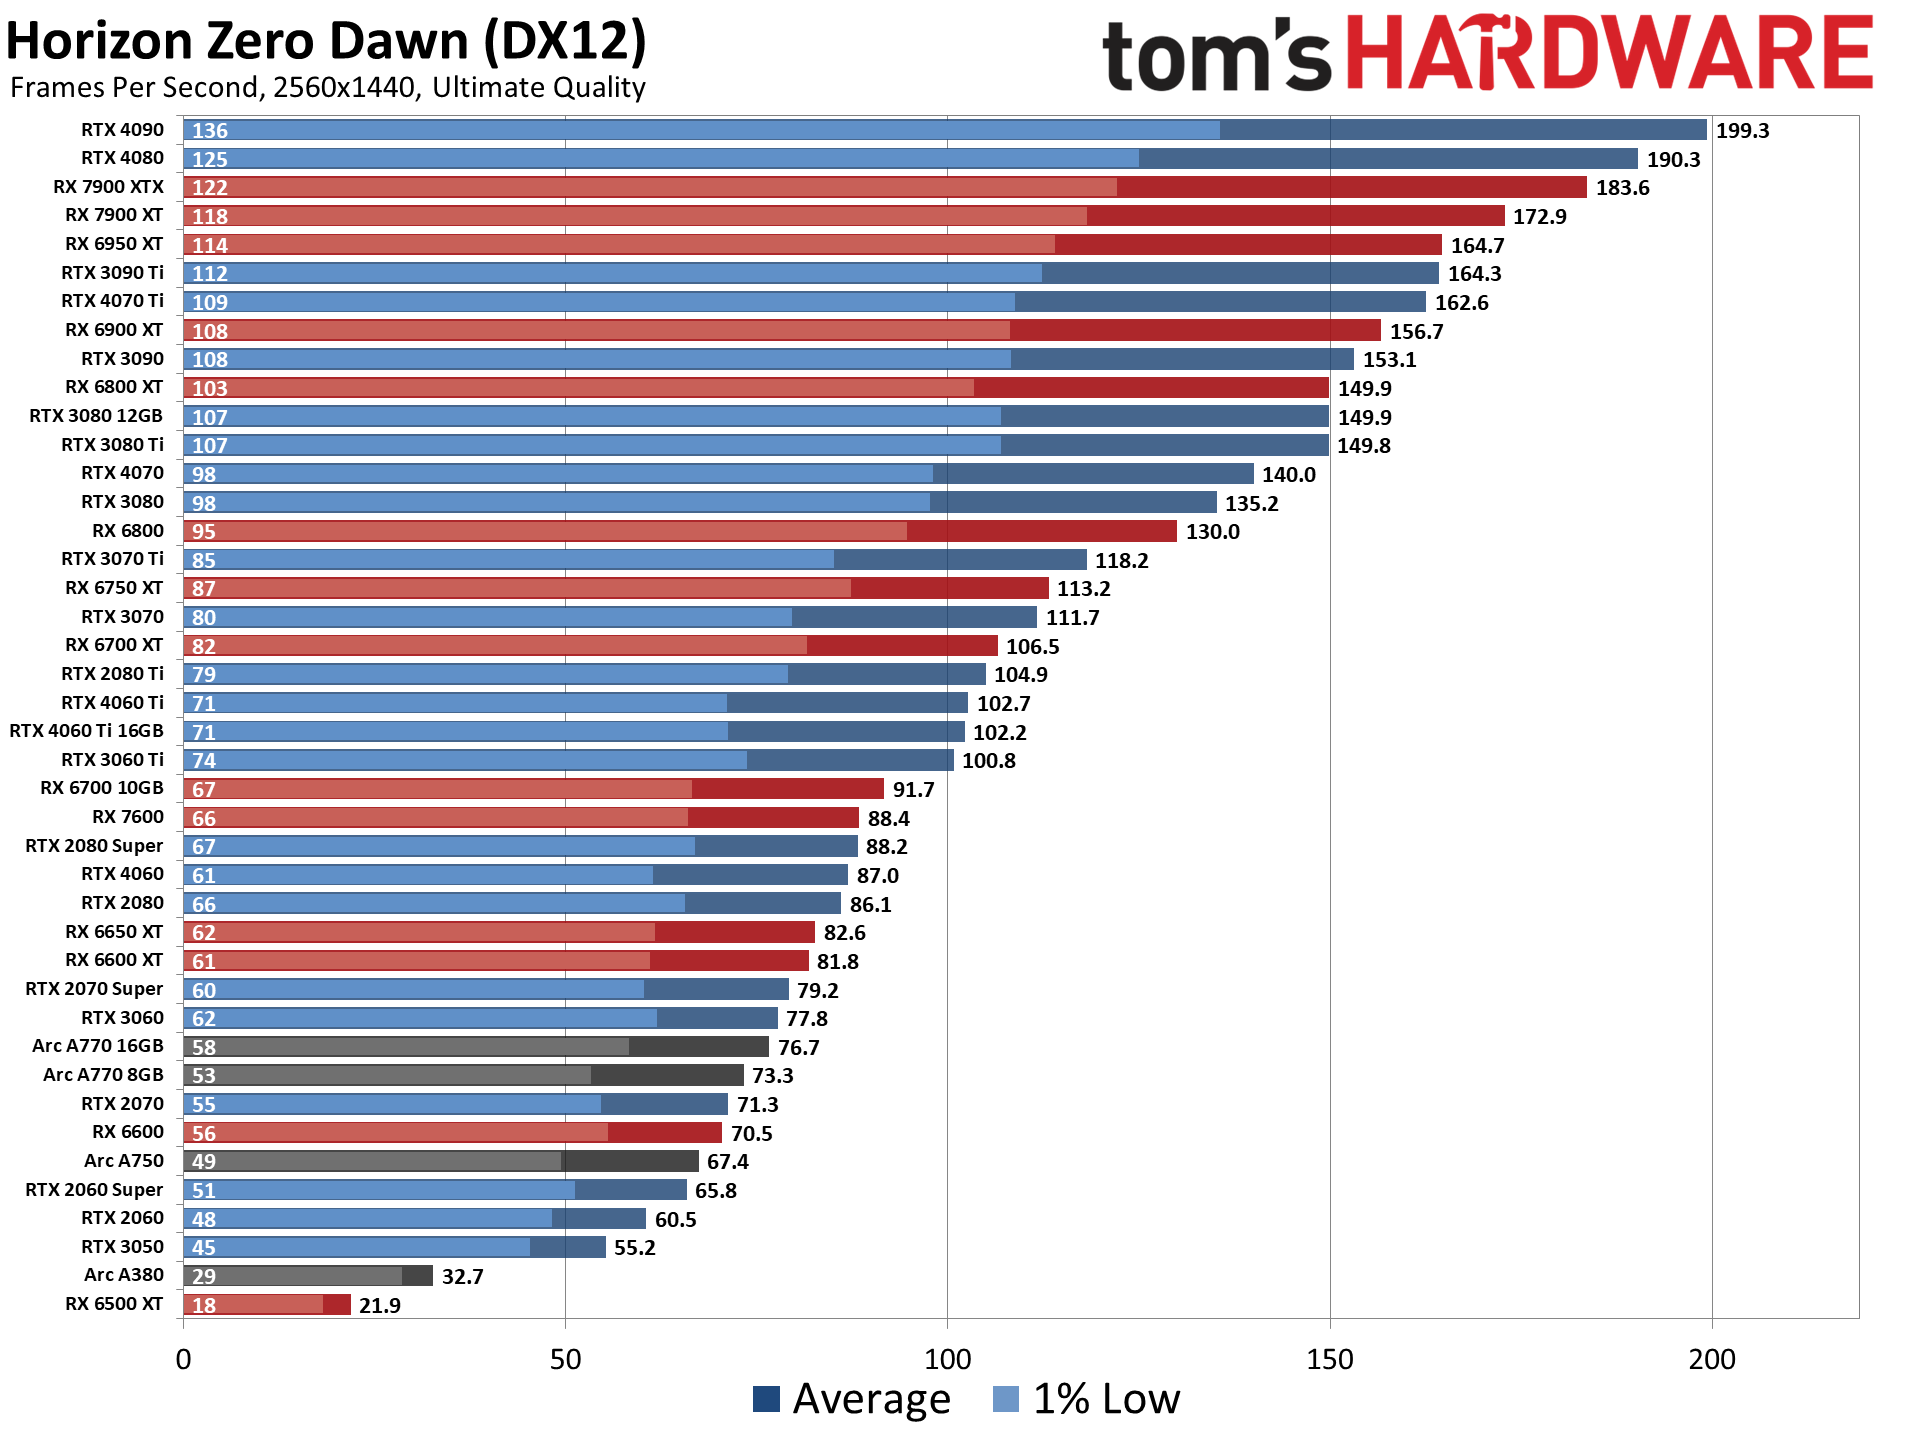
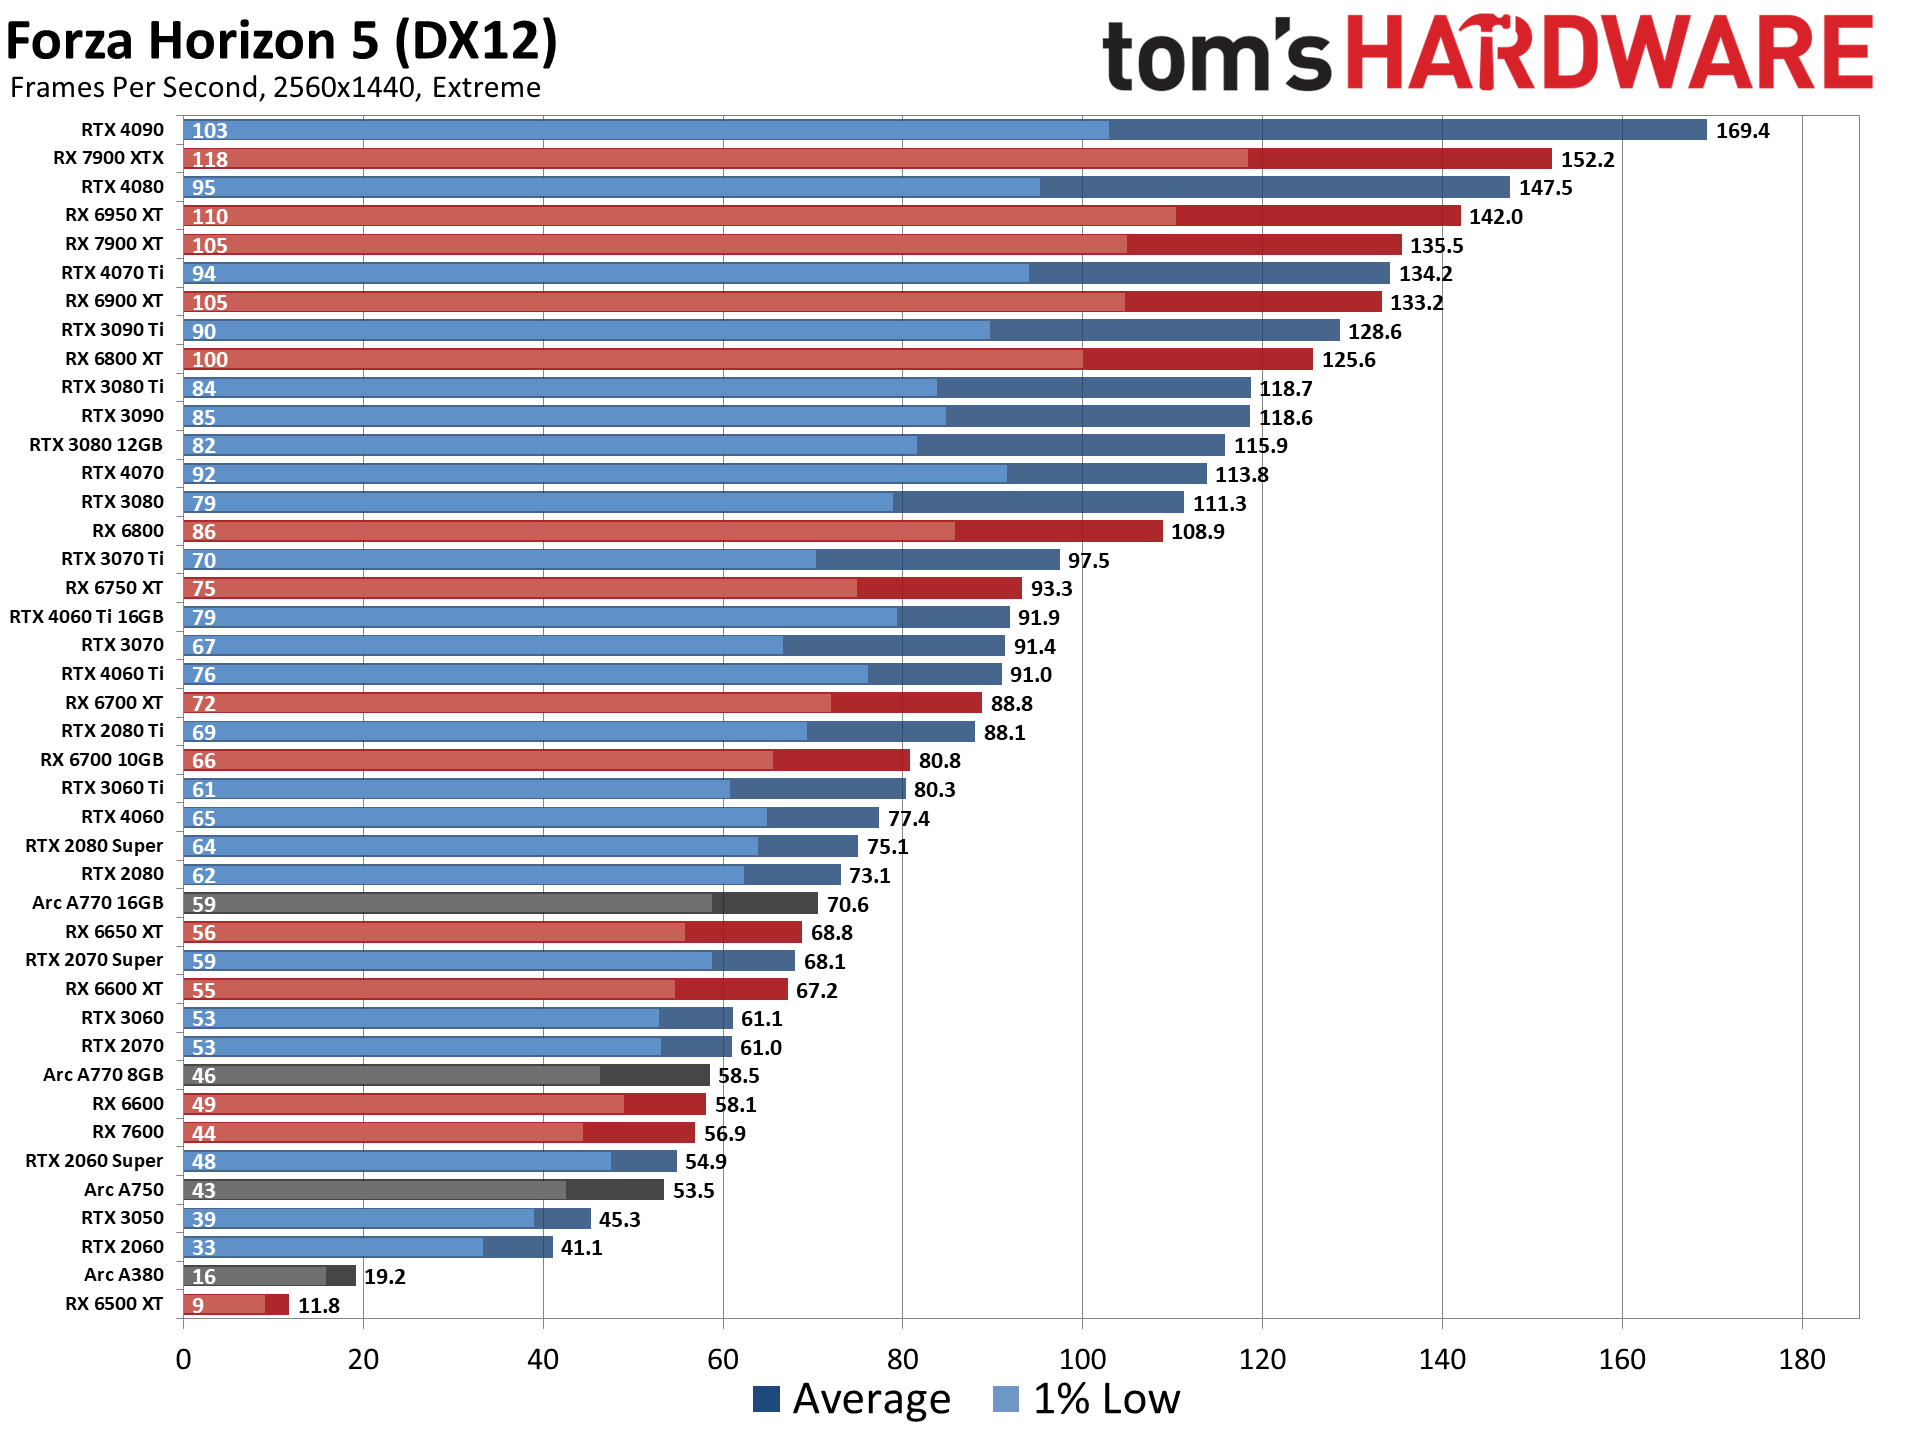
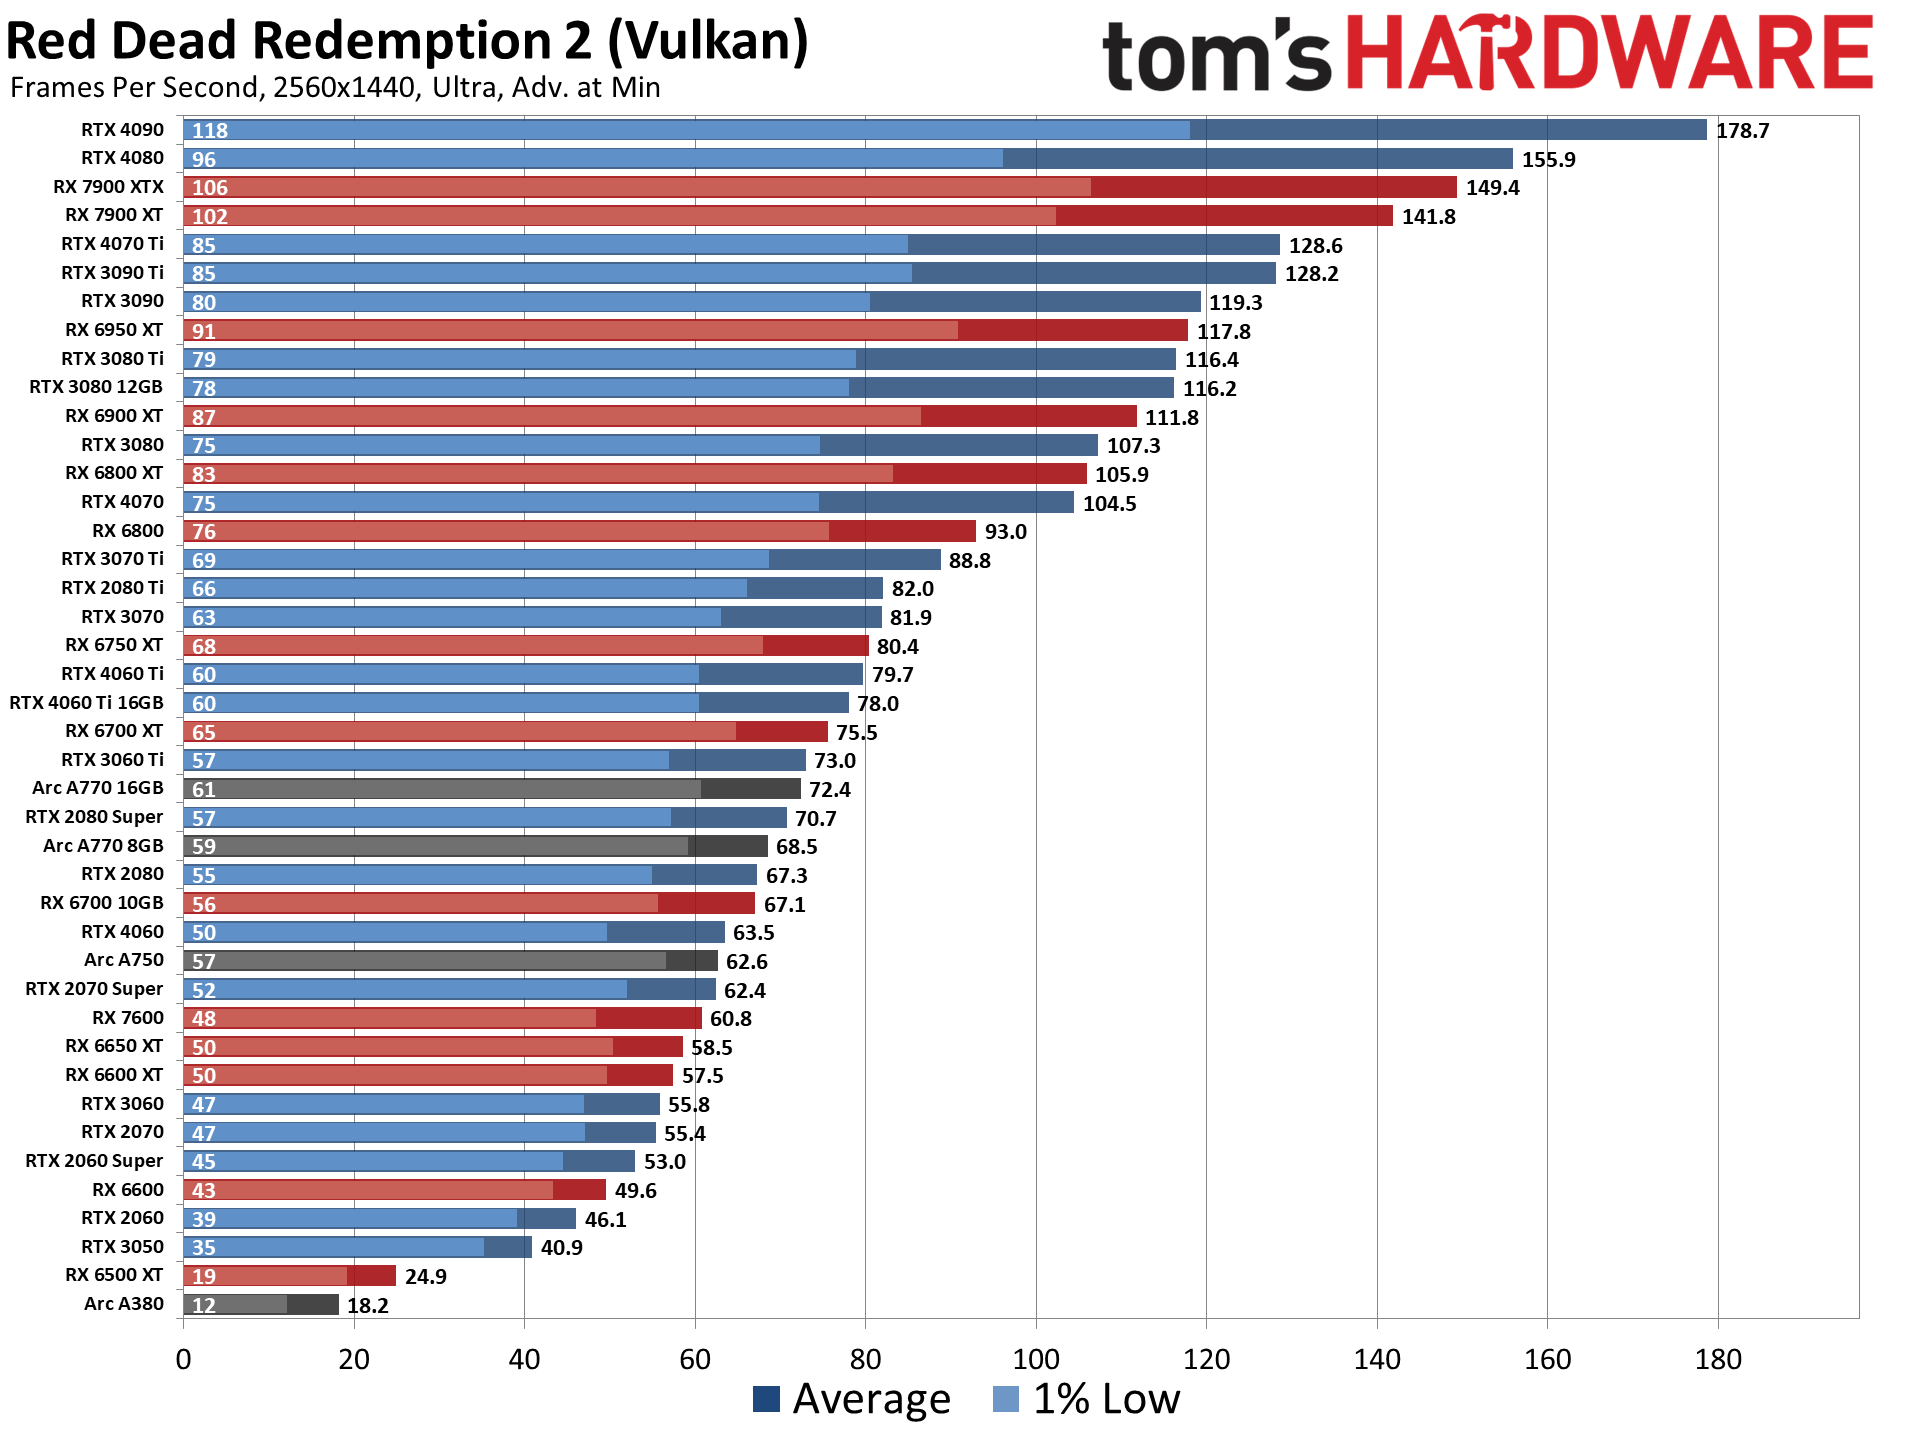
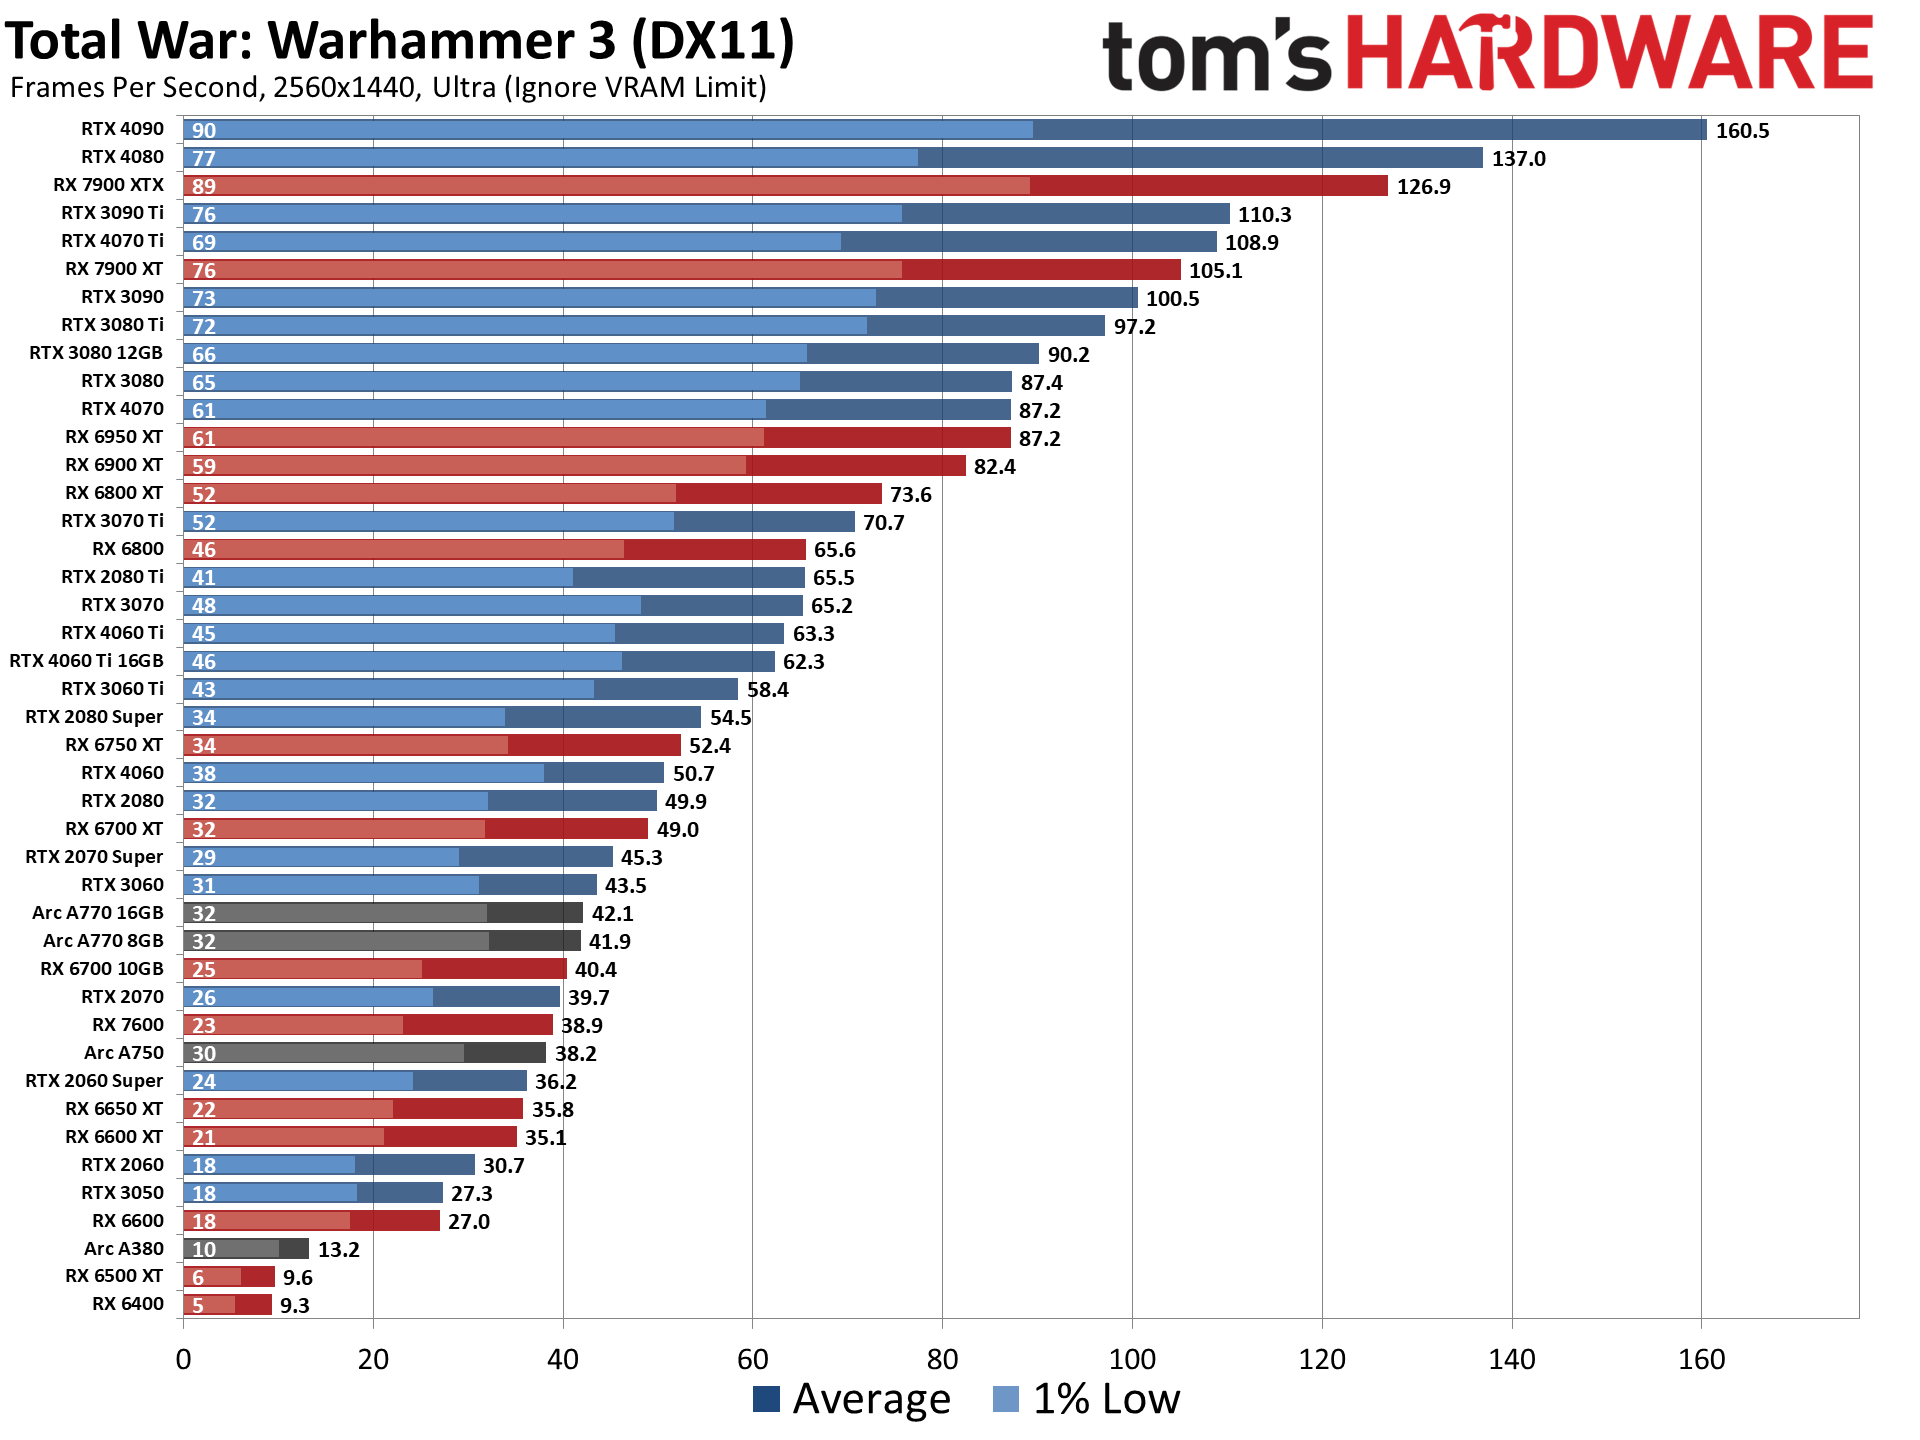
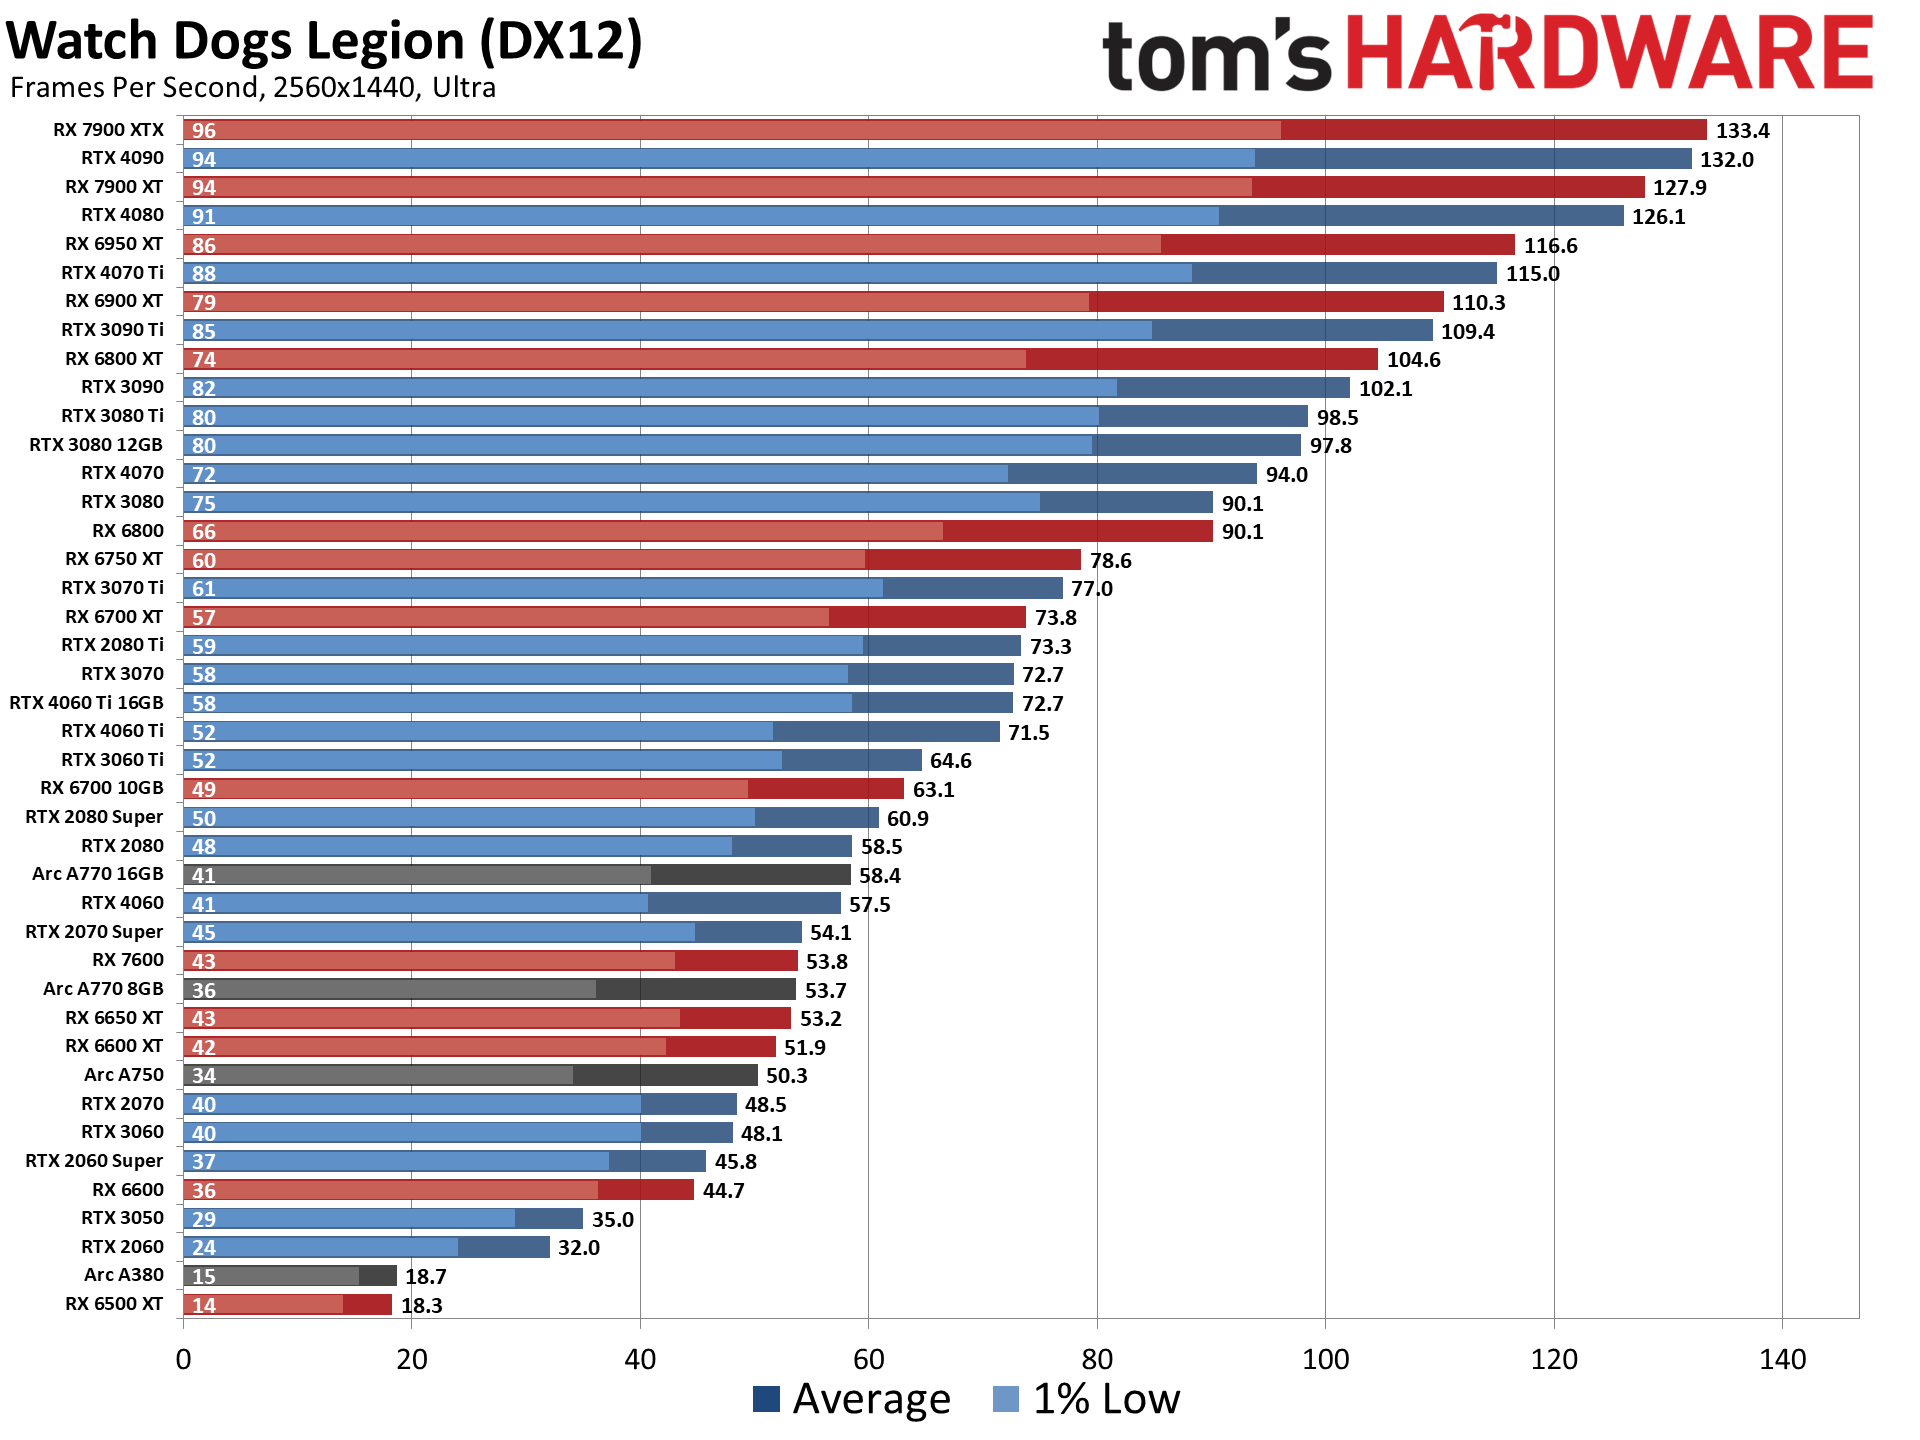
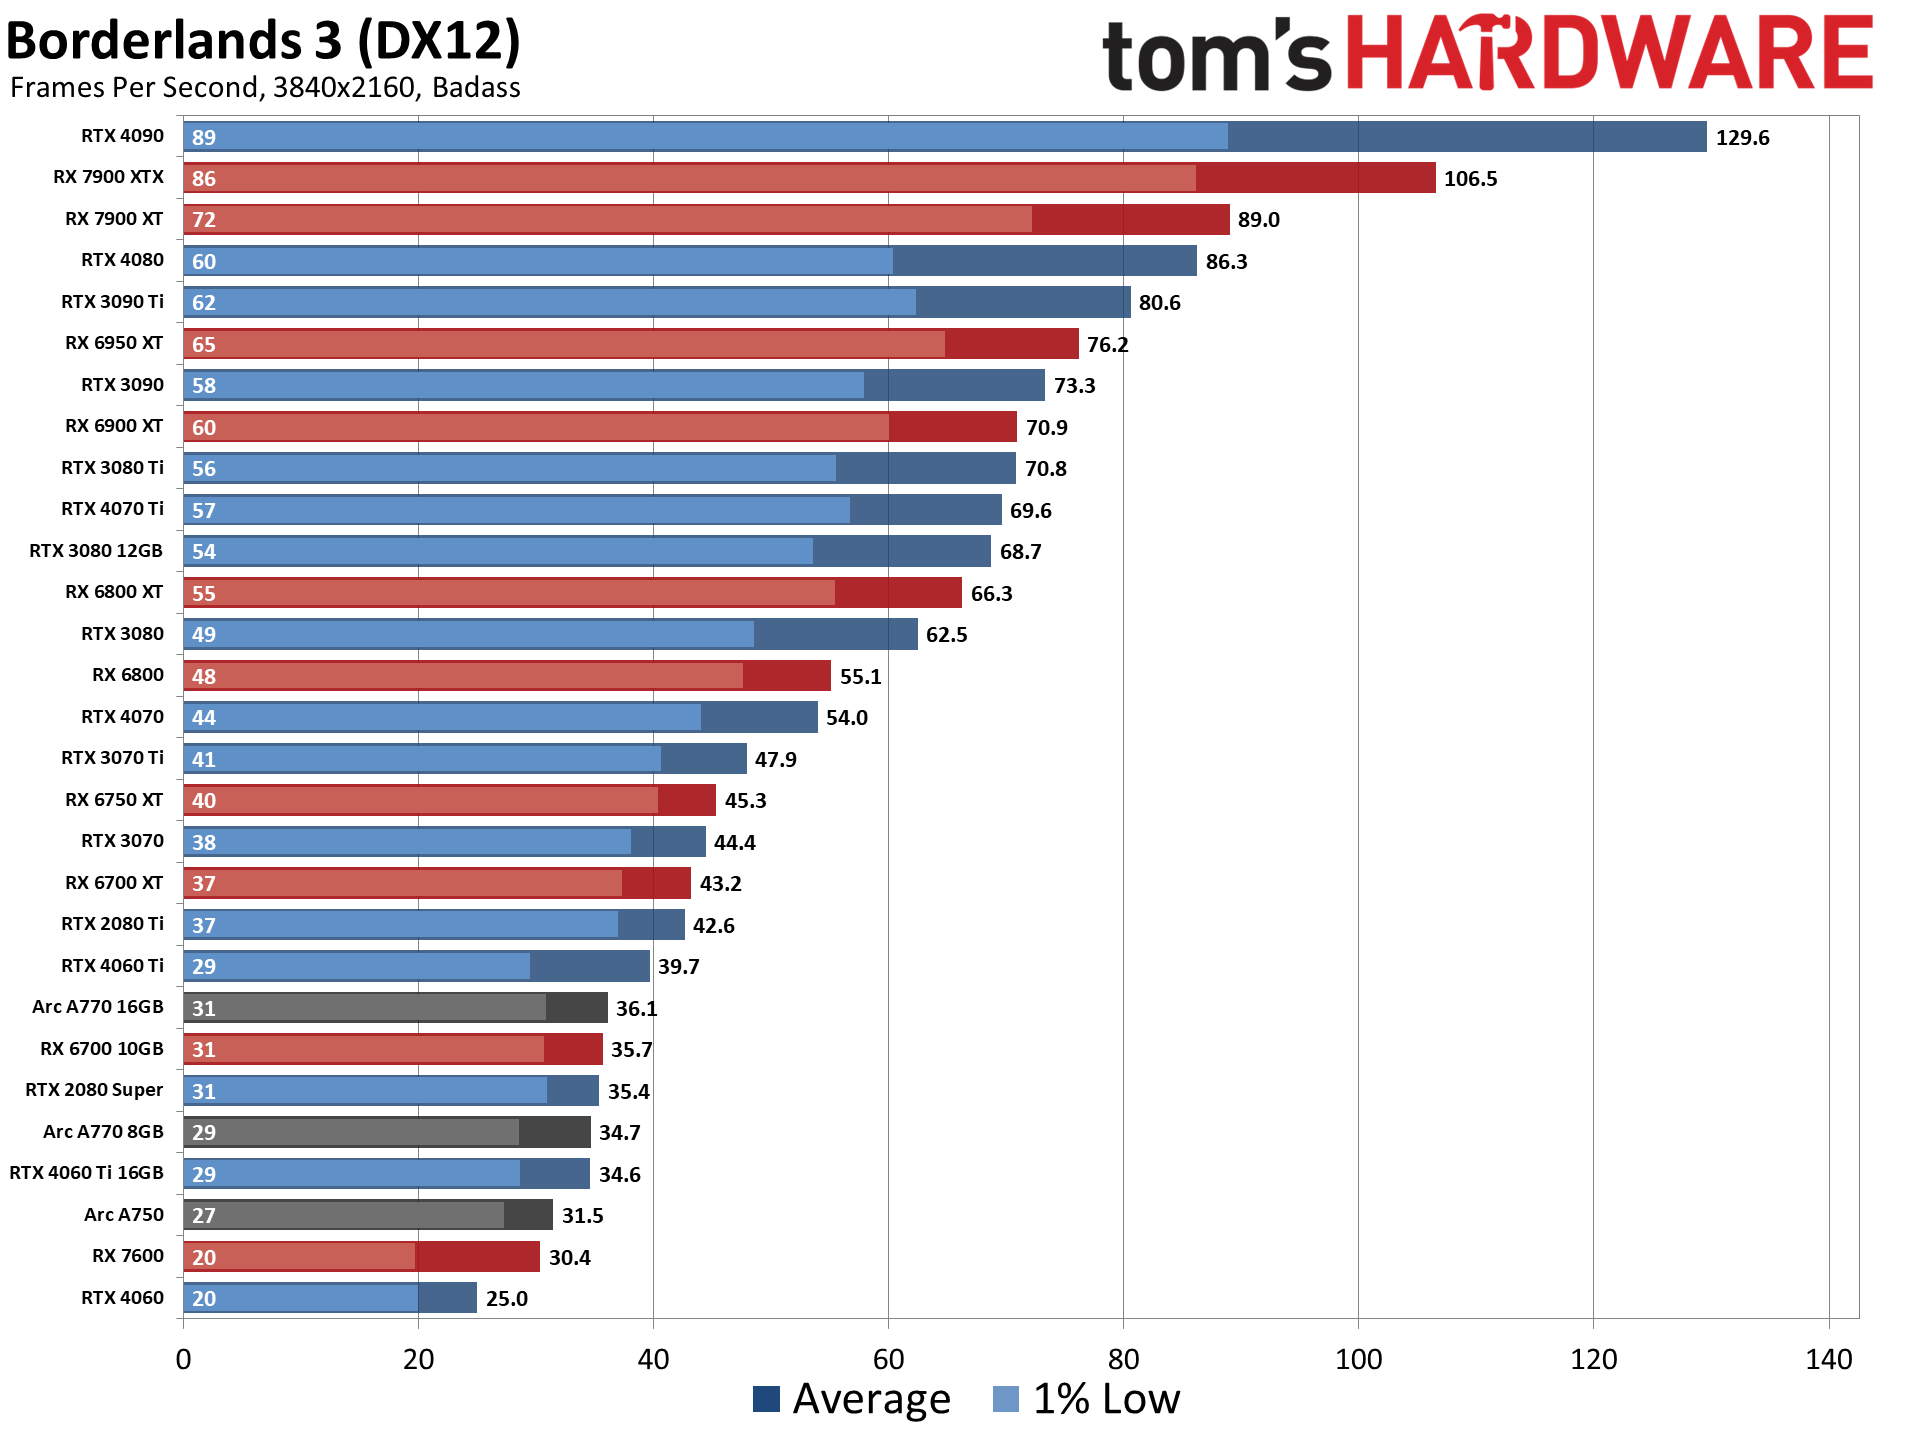
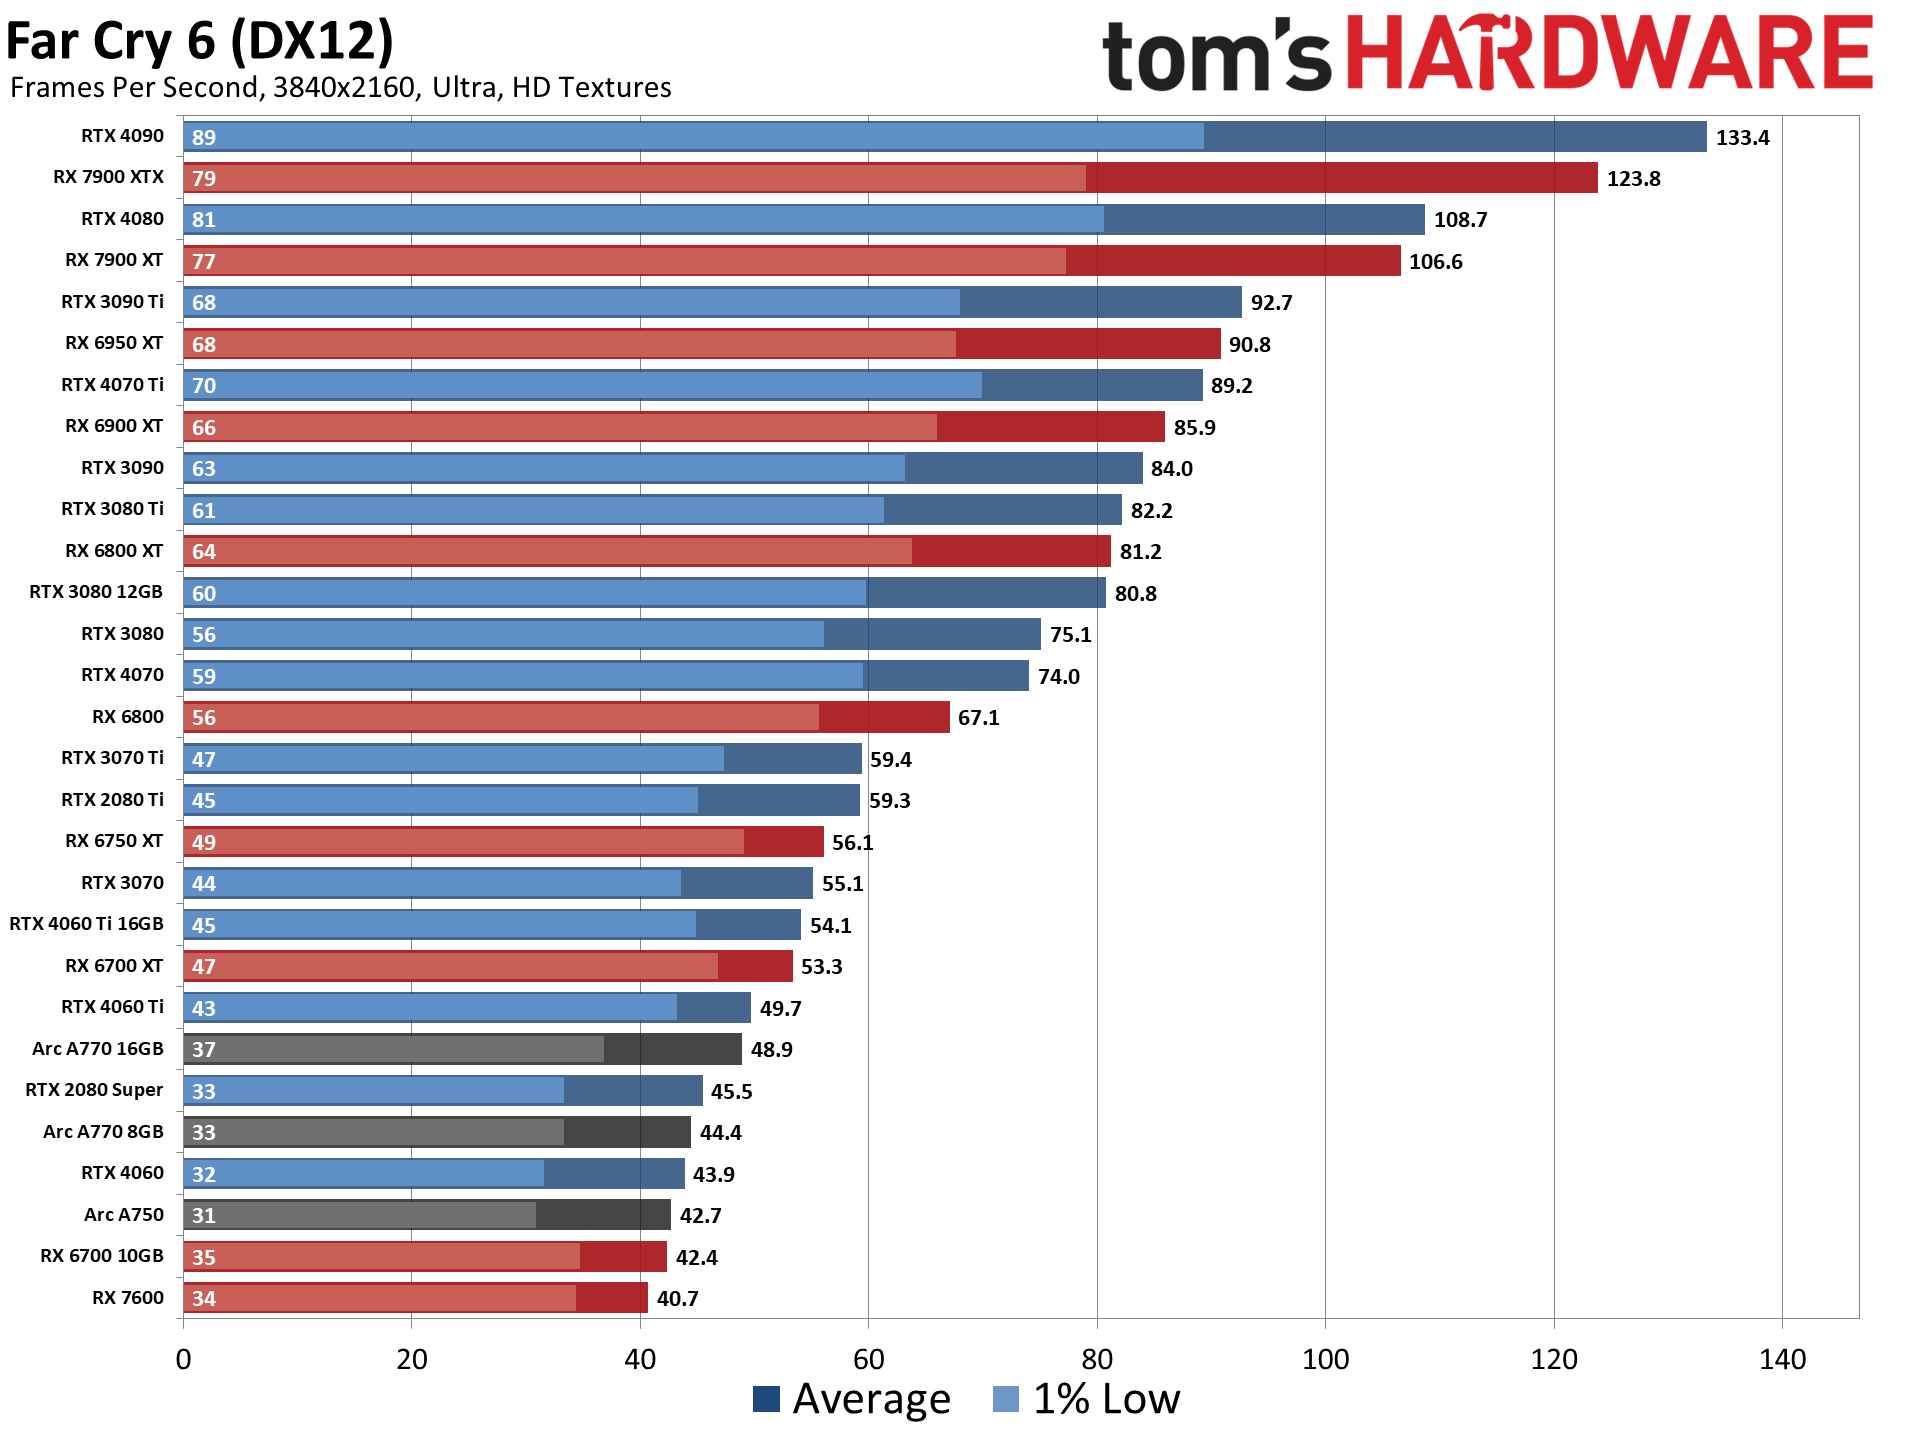
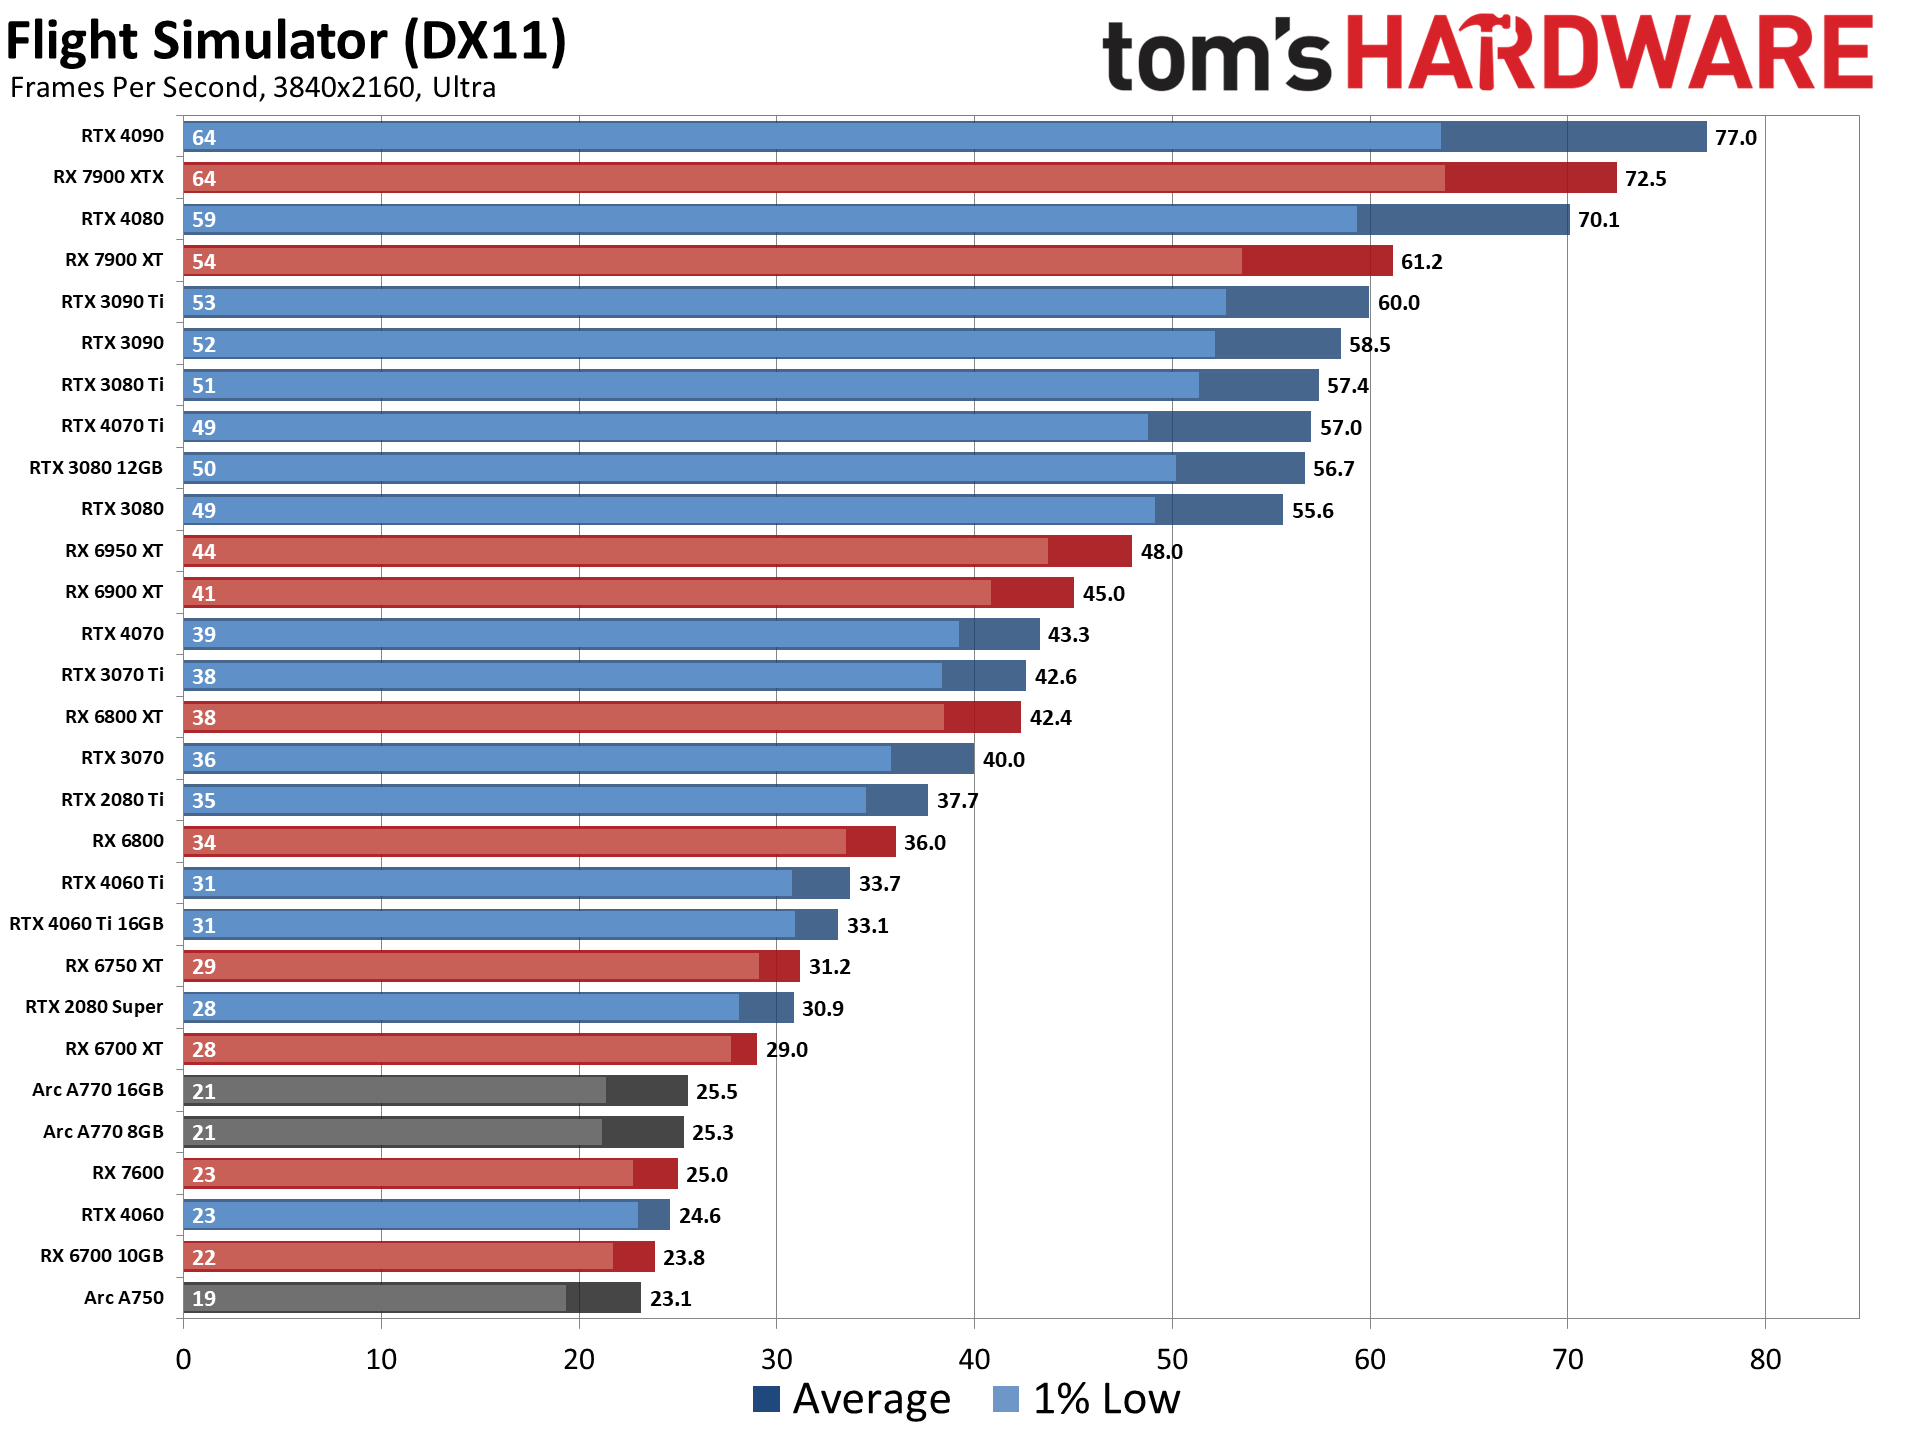
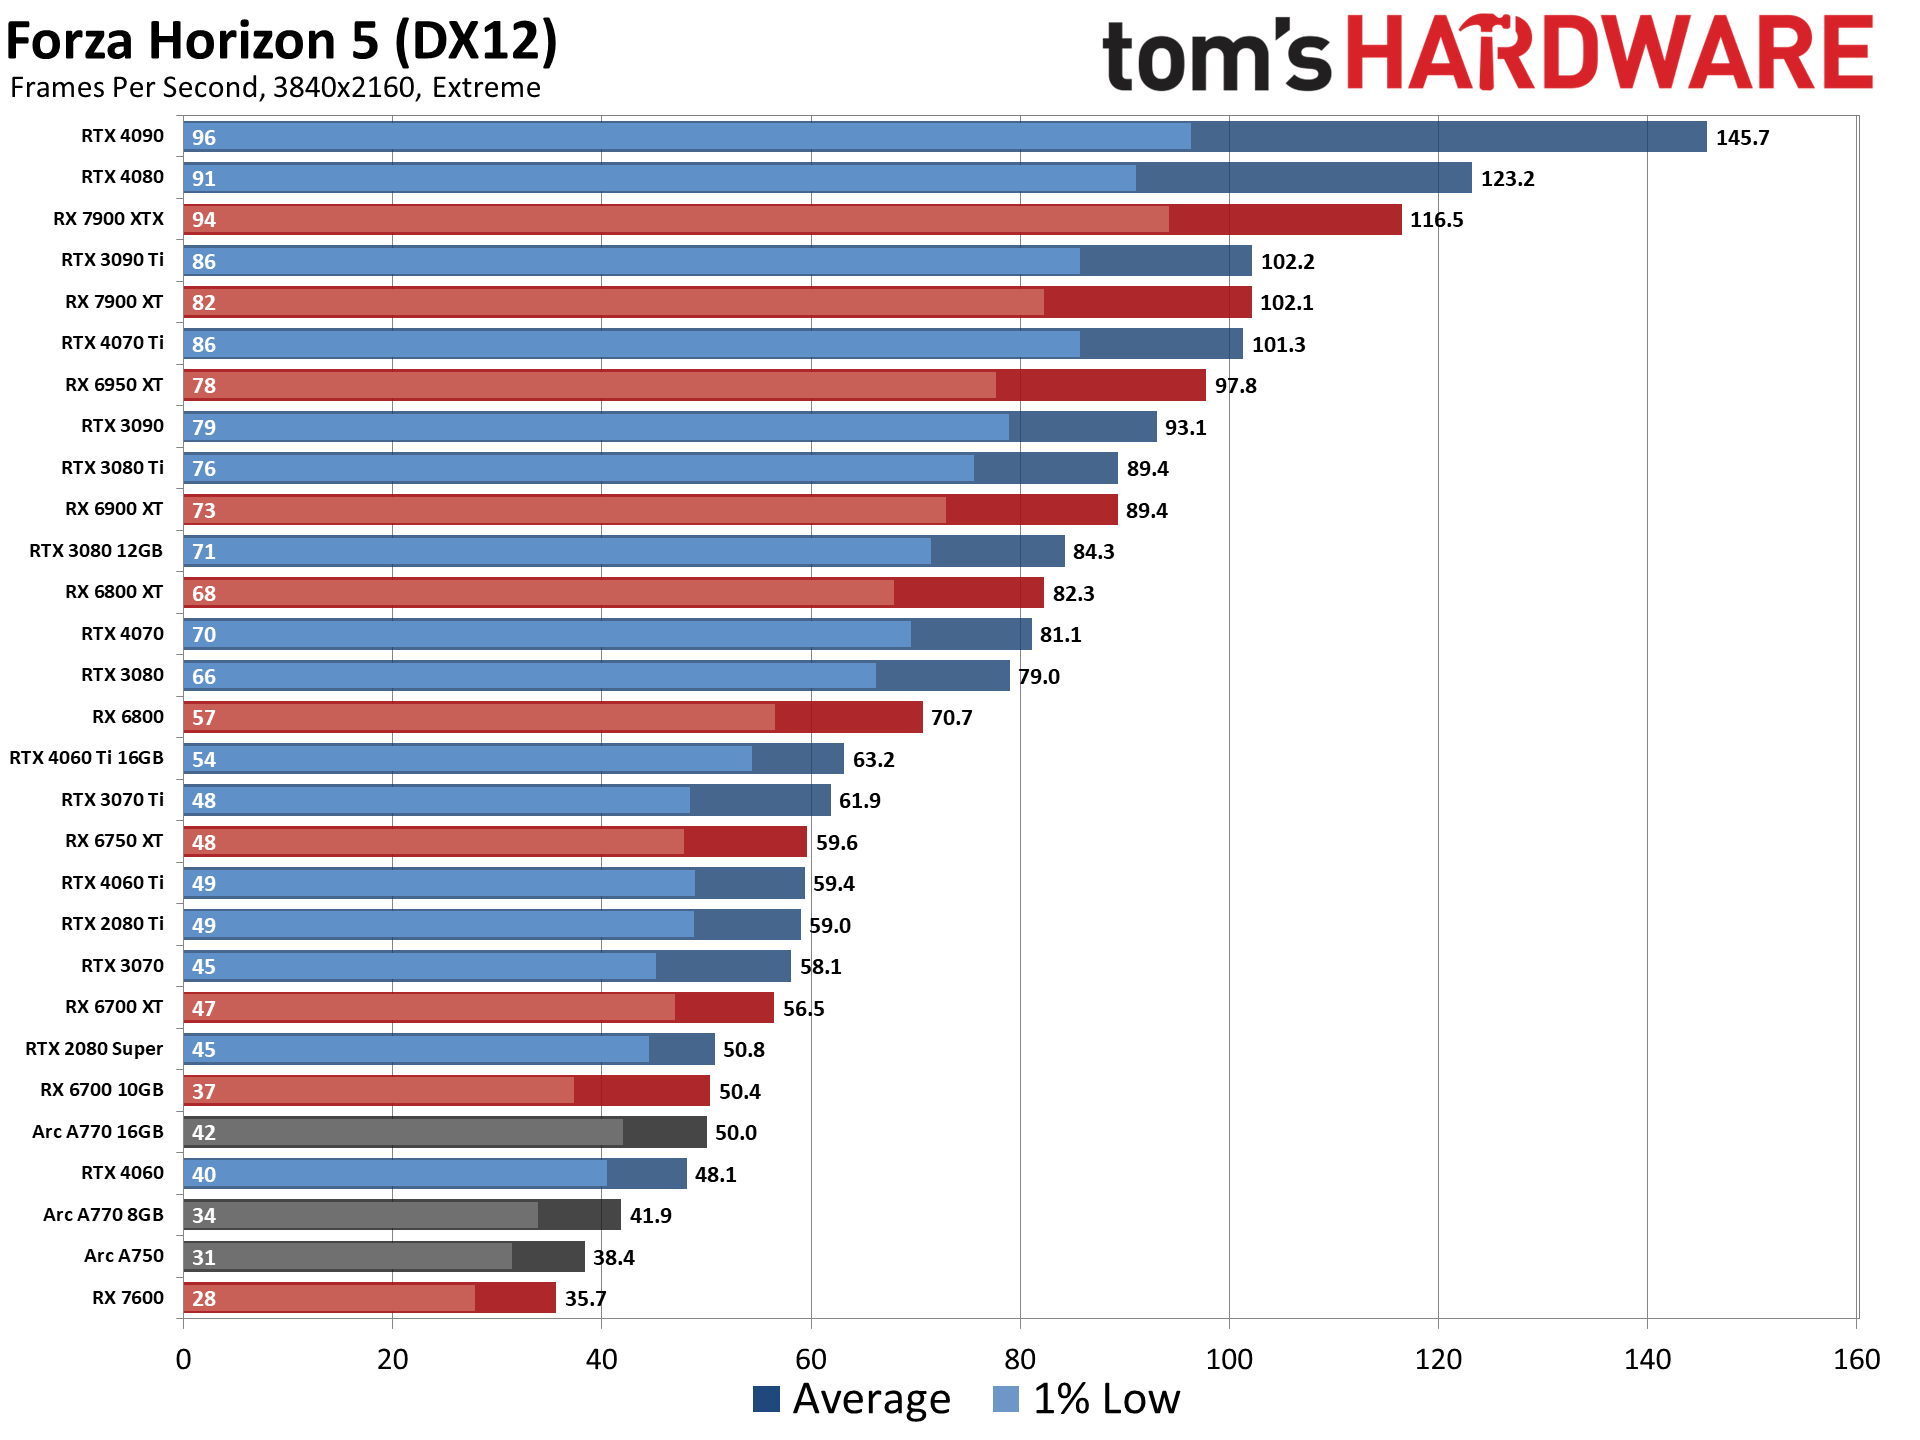
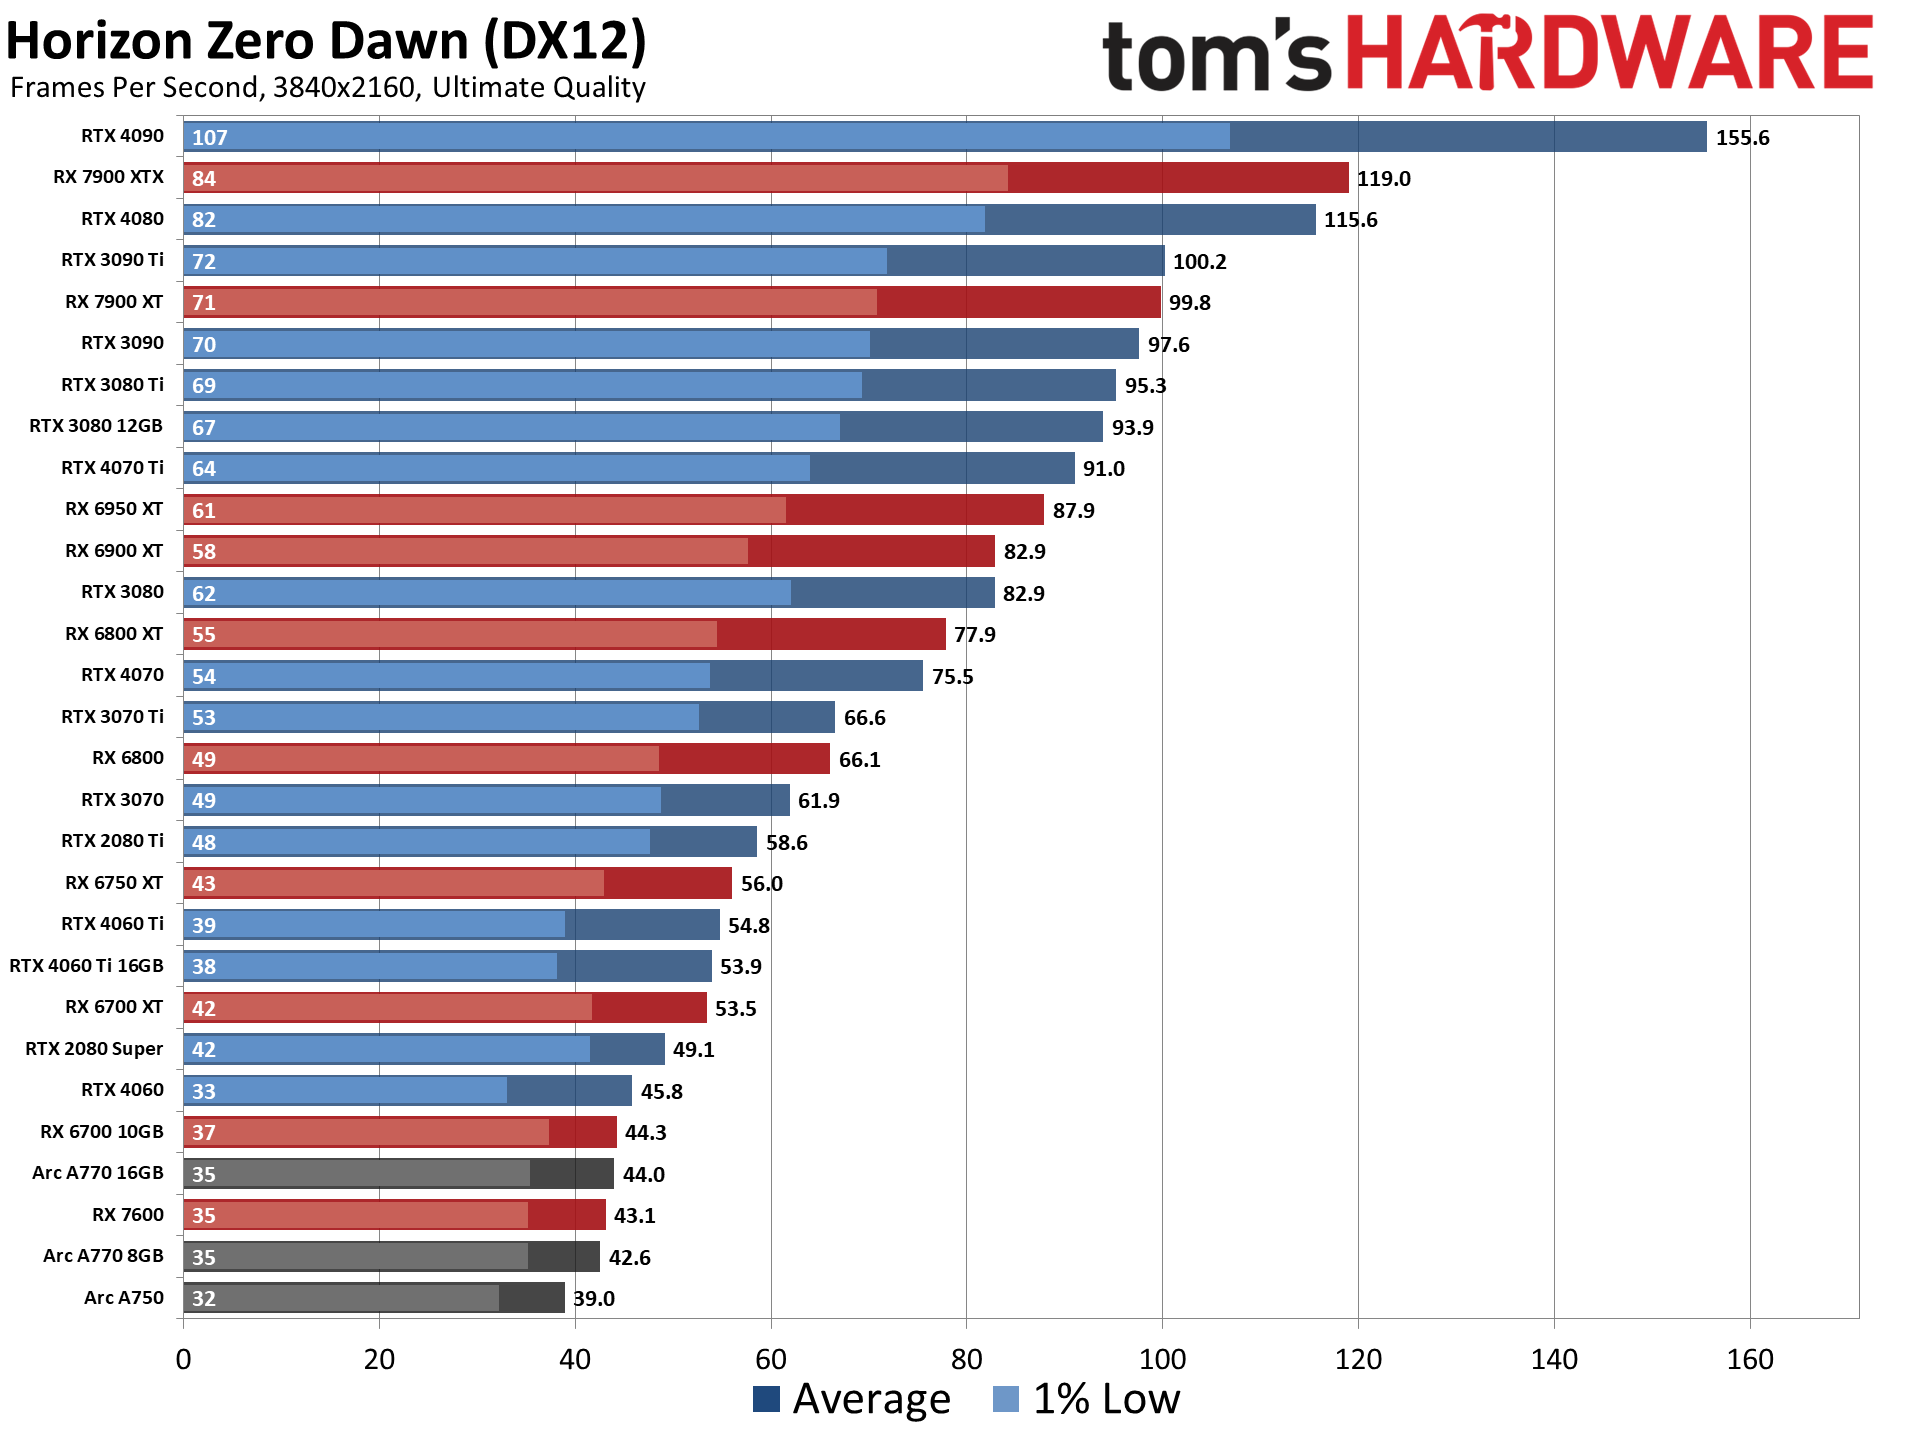
The eight games we're using for our standard GPU benchmarks hierarchy are Borderlands 3 (DX12), Far Cry 6 (DX12), Flight Simulator (DX11 AMD/DX12 Intel/Nvidia), Forza Horizon 5 (DX12), Horizon Zero Dawn (DX12), Red Dead Redemption 2 (Vulkan), Total War Warhammer 3 (DX11), and Watch Dogs Legion (DX12). The fps score is the geometric mean (equal weighting) of the eight games. Note that the specifications column links directly to our original review for the various GPUs.
GPU Rasterization Hierarchy, Key Takeaways
- Nvidia RTX 4090 takes the top spot but costs 70% more than 2nd place AMD RX 7900 XTX.
- RTX 4090 can encounter CPU bottlenecks at 1440p and especially 1080p.
- New cards typically match previous gen GPUs that are one or two model tiers "higher" (e.g. RTX 4070 Ti vs. RTX 3090 Ti, or RX 6600 XT vs. RX 5700 XT).
- Looking just at 1440p, RTX 4080 ranks as the most efficient GPU, followed by the RTX 4090, RTX 4070, RTX 4060 Ti, RTX 4070 Ti, and RTX 4060. AMD's most efficient GPU is the RX 7900 XT. Intel's Arc GPUs rank at the very bottom of the charts.
- The best GPU value in FPS per dollar (again, looking just at 1440p) is the RTX 4060, followed by the RX 6600, RX 6650 XT, and Arc A750. The worst values (not counting the RTX 30-series) are the RTX 4090, RTX 4080, and RTX 4060 Ti 16GB.
*: GPU couldn't run all tests, so the overall score is slightly skewed at 1080p ultra.
While the RTX 4090 does technically take first place at 1080p ultra, it's the 1440p and especially 4K numbers that impress. It's only 3% faster than the next closest RX 7900 XTX at 1080p ultra, but that increases to 8% at 1440p and then 23% at 4K. Against the RTX 3090 Ti, it's also a major upgrade: 14% faster at 1080p, 27% faster at 1440p, and 51% faster at 4K.
(Note that the above fps numbers incorporate both the average and minimum fps into a single score — with the average given more weight than the 1% low fps.)
Again, keep in mind that we're not including any ray tracing or DLSS results in the above table, as we intend to use the same test suite with the same settings on all current and previous generation graphics cards. Since only RTX cards support DLSS (and RTX 40-series if you want DLSS 3), that would drastically limit which cards we could directly compare. You can see DLSS 2/3 and FSR 2 upscaling results in our RTX 4070 review if you want to check out the various upscaling modes might help.
Of course the RTX 4090 comes at a steep price, though it's not that much worse than the previous generation RTX 3090. In fact, we'd say it's a lot better in some respects, as the 3090 was only a minor improvement in performance compared to the 3080 at the time of launch, but with more than double the VRAM. Nvidia pulled out all the stops with the 4090, increasing the core counts, clock speeds, and power limits to push it beyond all contenders.
Stepping down from the RTX 4090, the RTX 4080 and RX 7900 XTX trade blows at higher resolutions, while CPU bottlenecks come into play at 1080p. We'll be switching to an i9-13900K in the near future, and you can see those results in our latest graphics card reviews — check the GeForce RTX 4060, Radeon RX 7600, and GeForce RTX 4070 for examples.
Outside of the latest releases from AMD and Nvidia, the RX 6000- and RTX 30-series chips still perform reasonably well and in some cases represent a better 'deal' — even though the hardware can be over two years old now. Intel's Arc GPUs also fall into this category and are something of a wild card.
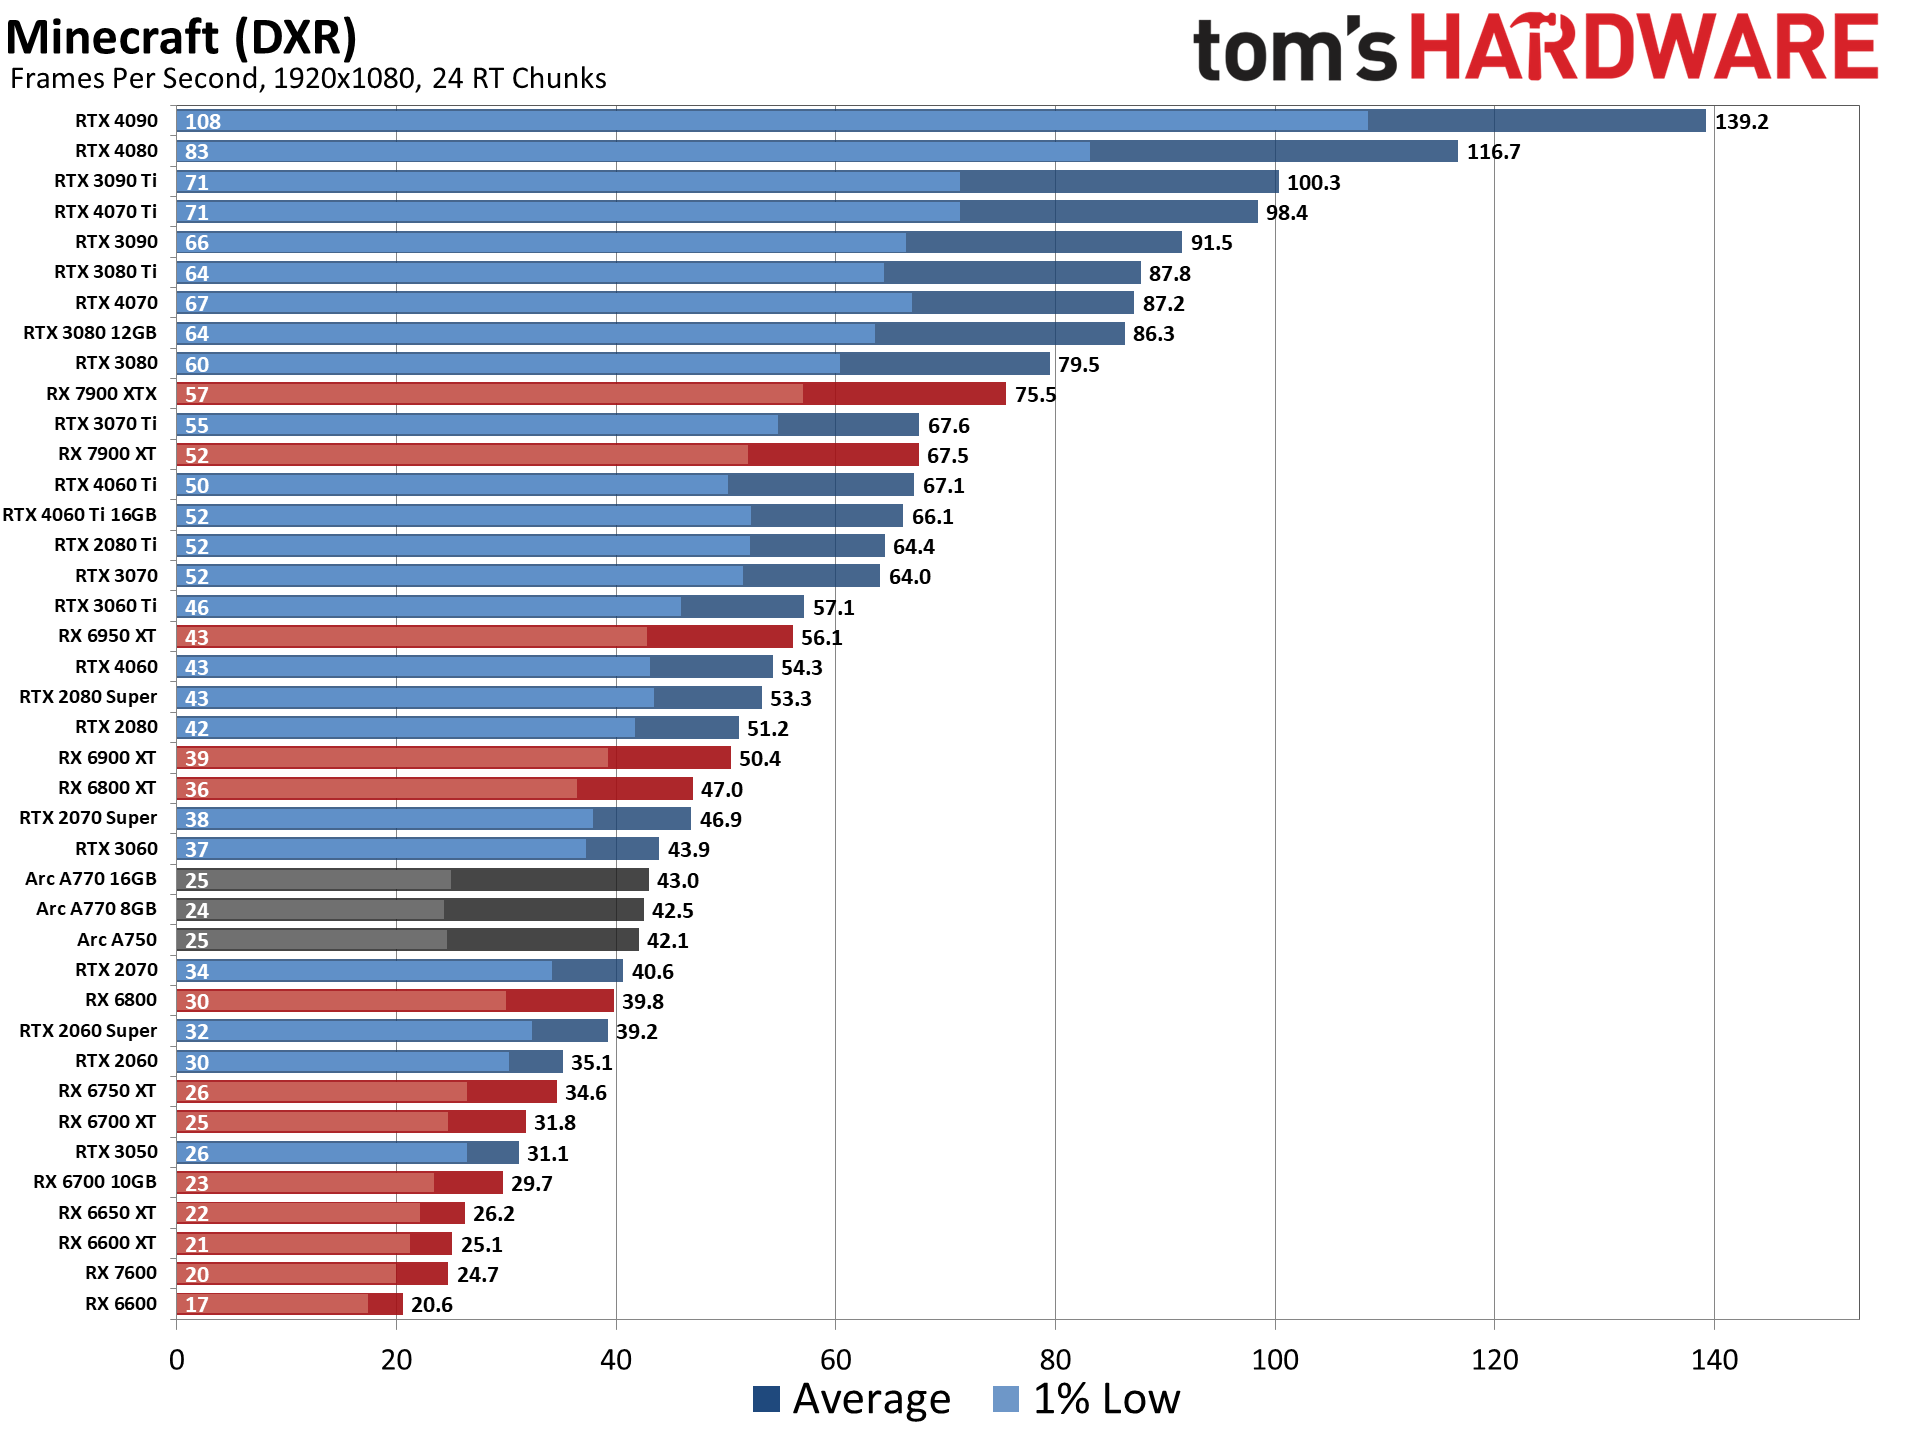
We've been testing and retesting GPUs periodically, and the Arc chips running the latest drivers now complete all of our benchmarks without any major anomalies. (Minecraft was previously a problem, though Intel has finally sorted that out.) They're not great on efficiency, but overall performance and pricing on the A750 are quite good.
Turning to the previous generation GPUs, the RTX 20-series and GTX 16-series chips end up scattered throughout the results, along with the RX 5000-series. The general rule of thumb is that you get one or two "model upgrades" with the newer architectures, so for example the RTX 2080 Super comes in just below the RTX 3060 Ti, while the RX 5700 XT lands a few percent behind the RX 6600 XT.
Go back far enough and you can see how modern games at ultra settings severely punish cards that don't have more than 4GB VRAM. We've been saying for a few years now that 4GB was just scraping by, and these days we'd avoid buying anything with less than 8GB of VRAM — 12GB or more is desirable for a mainstream or high-end GPU. The GTX 1060 3GB, GTX 1050, and GTX 780 actually failed to run some of our tests, which skews their results a bit, even though they do better at 1080p medium.
Now let's switch over to the ray tracing hierarchy.

Ray Tracing GPU Benchmarks Ranking 2023
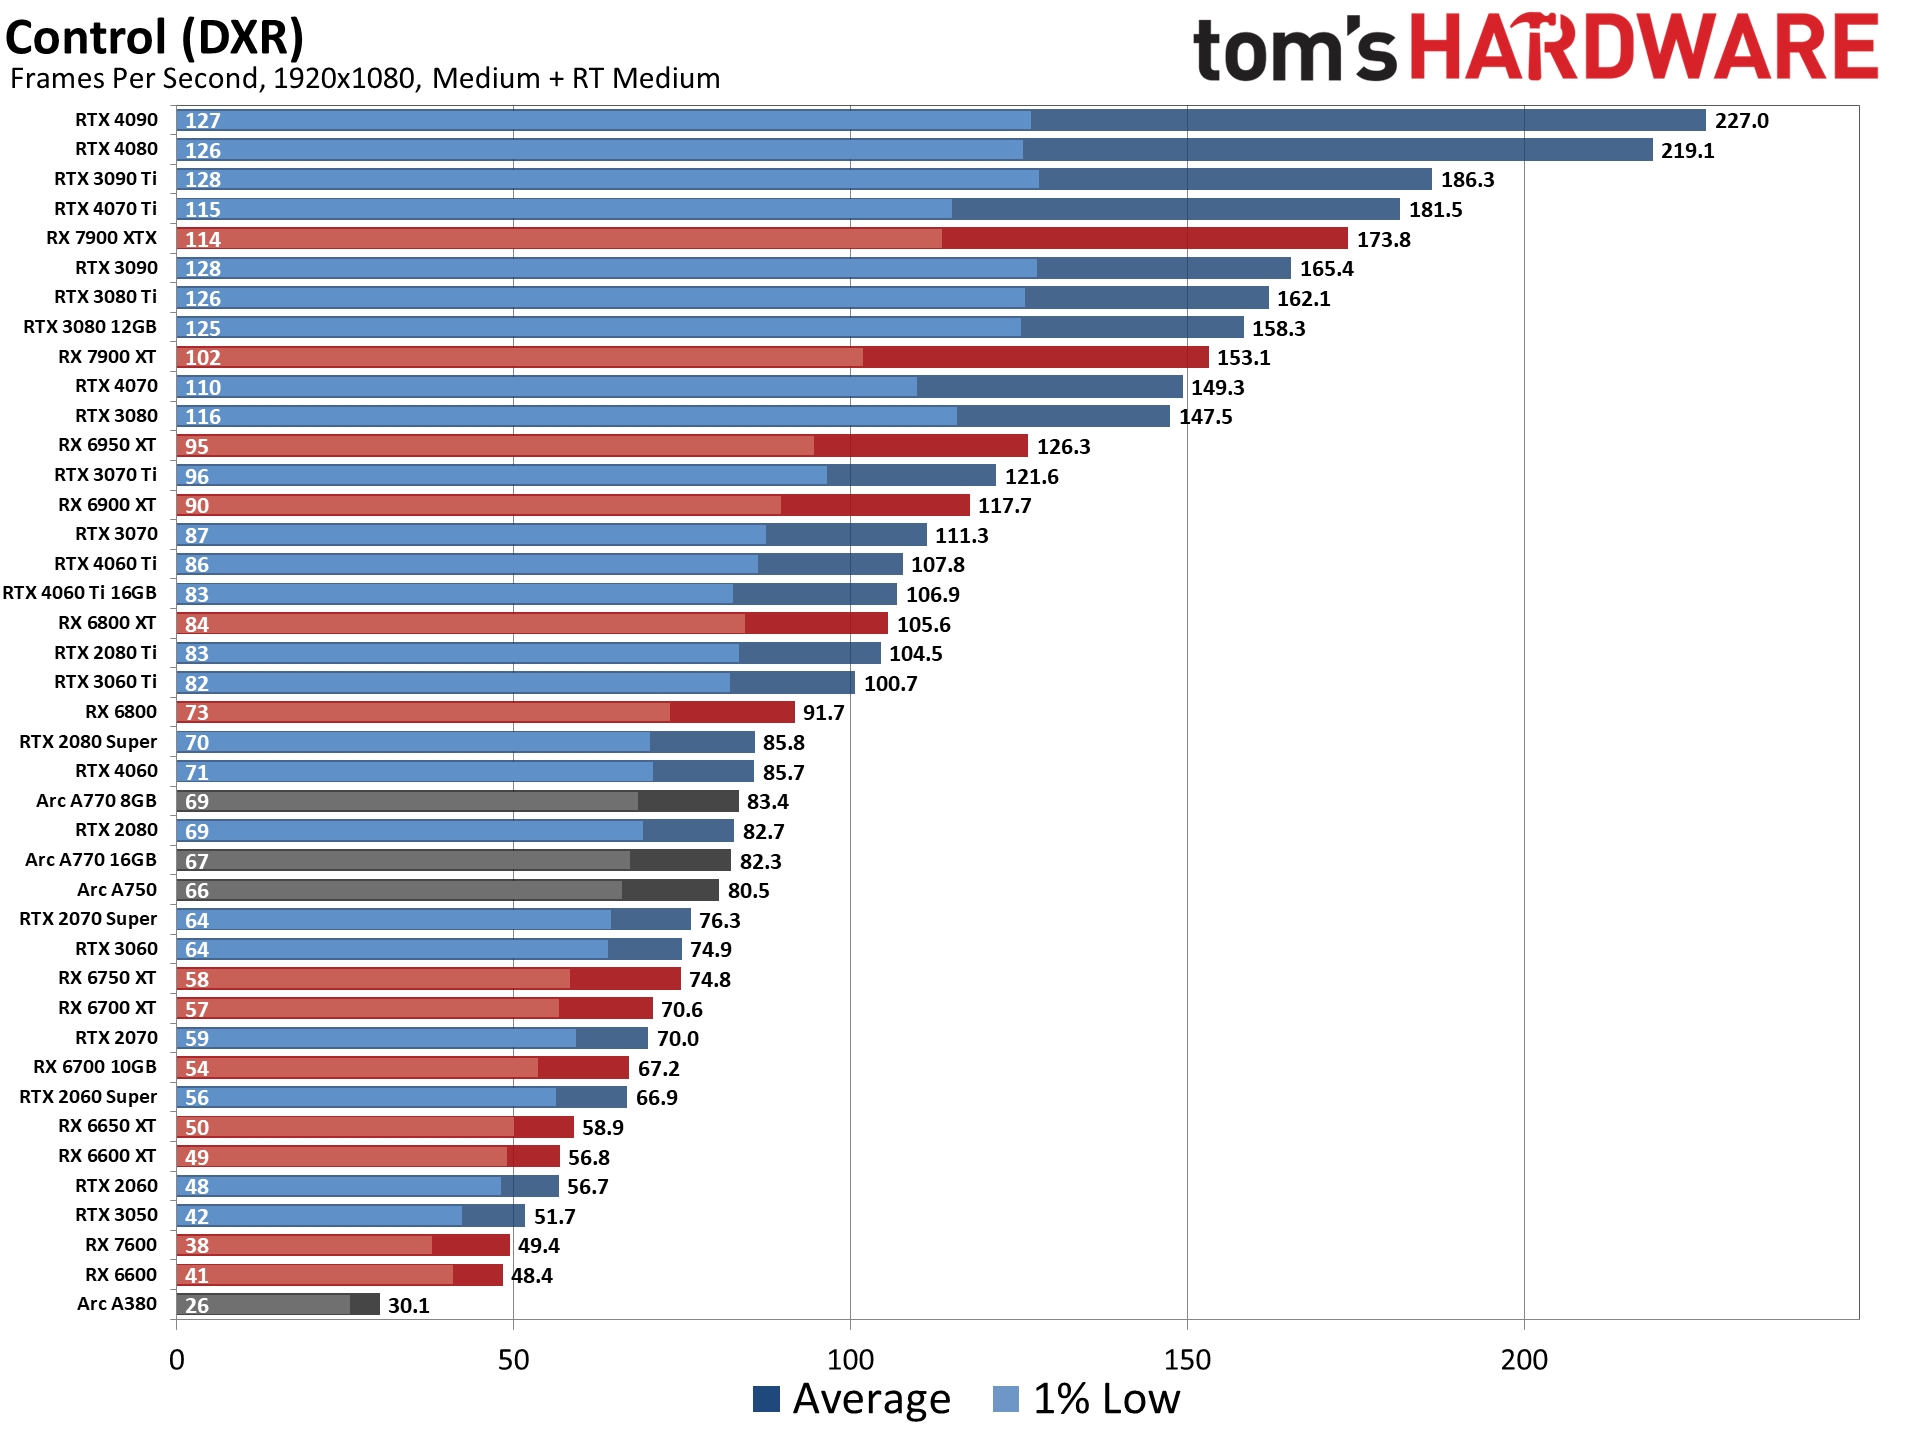
Enabling ray tracing, particularly with demanding games like those we're using in our DXR test suite, can cause framerates to drop off a cliff. We're testing with "medium" and "ultra" ray tracing settings. Medium means using the medium graphics preset but turning on ray tracing effects (set to "medium" if that's an option; otherwise, "on"), while ultra turns on all of the RT options at more or less maximum quality.
Because ray tracing is so much more demanding, we're sorting these results by the 1080p medium scores. That's also because the RX 6500 XT and RX 6400 along with the Arc A380 basically can't handle ray tracing even at these settings, and testing at anything more than 1080p medium would be fruitless.
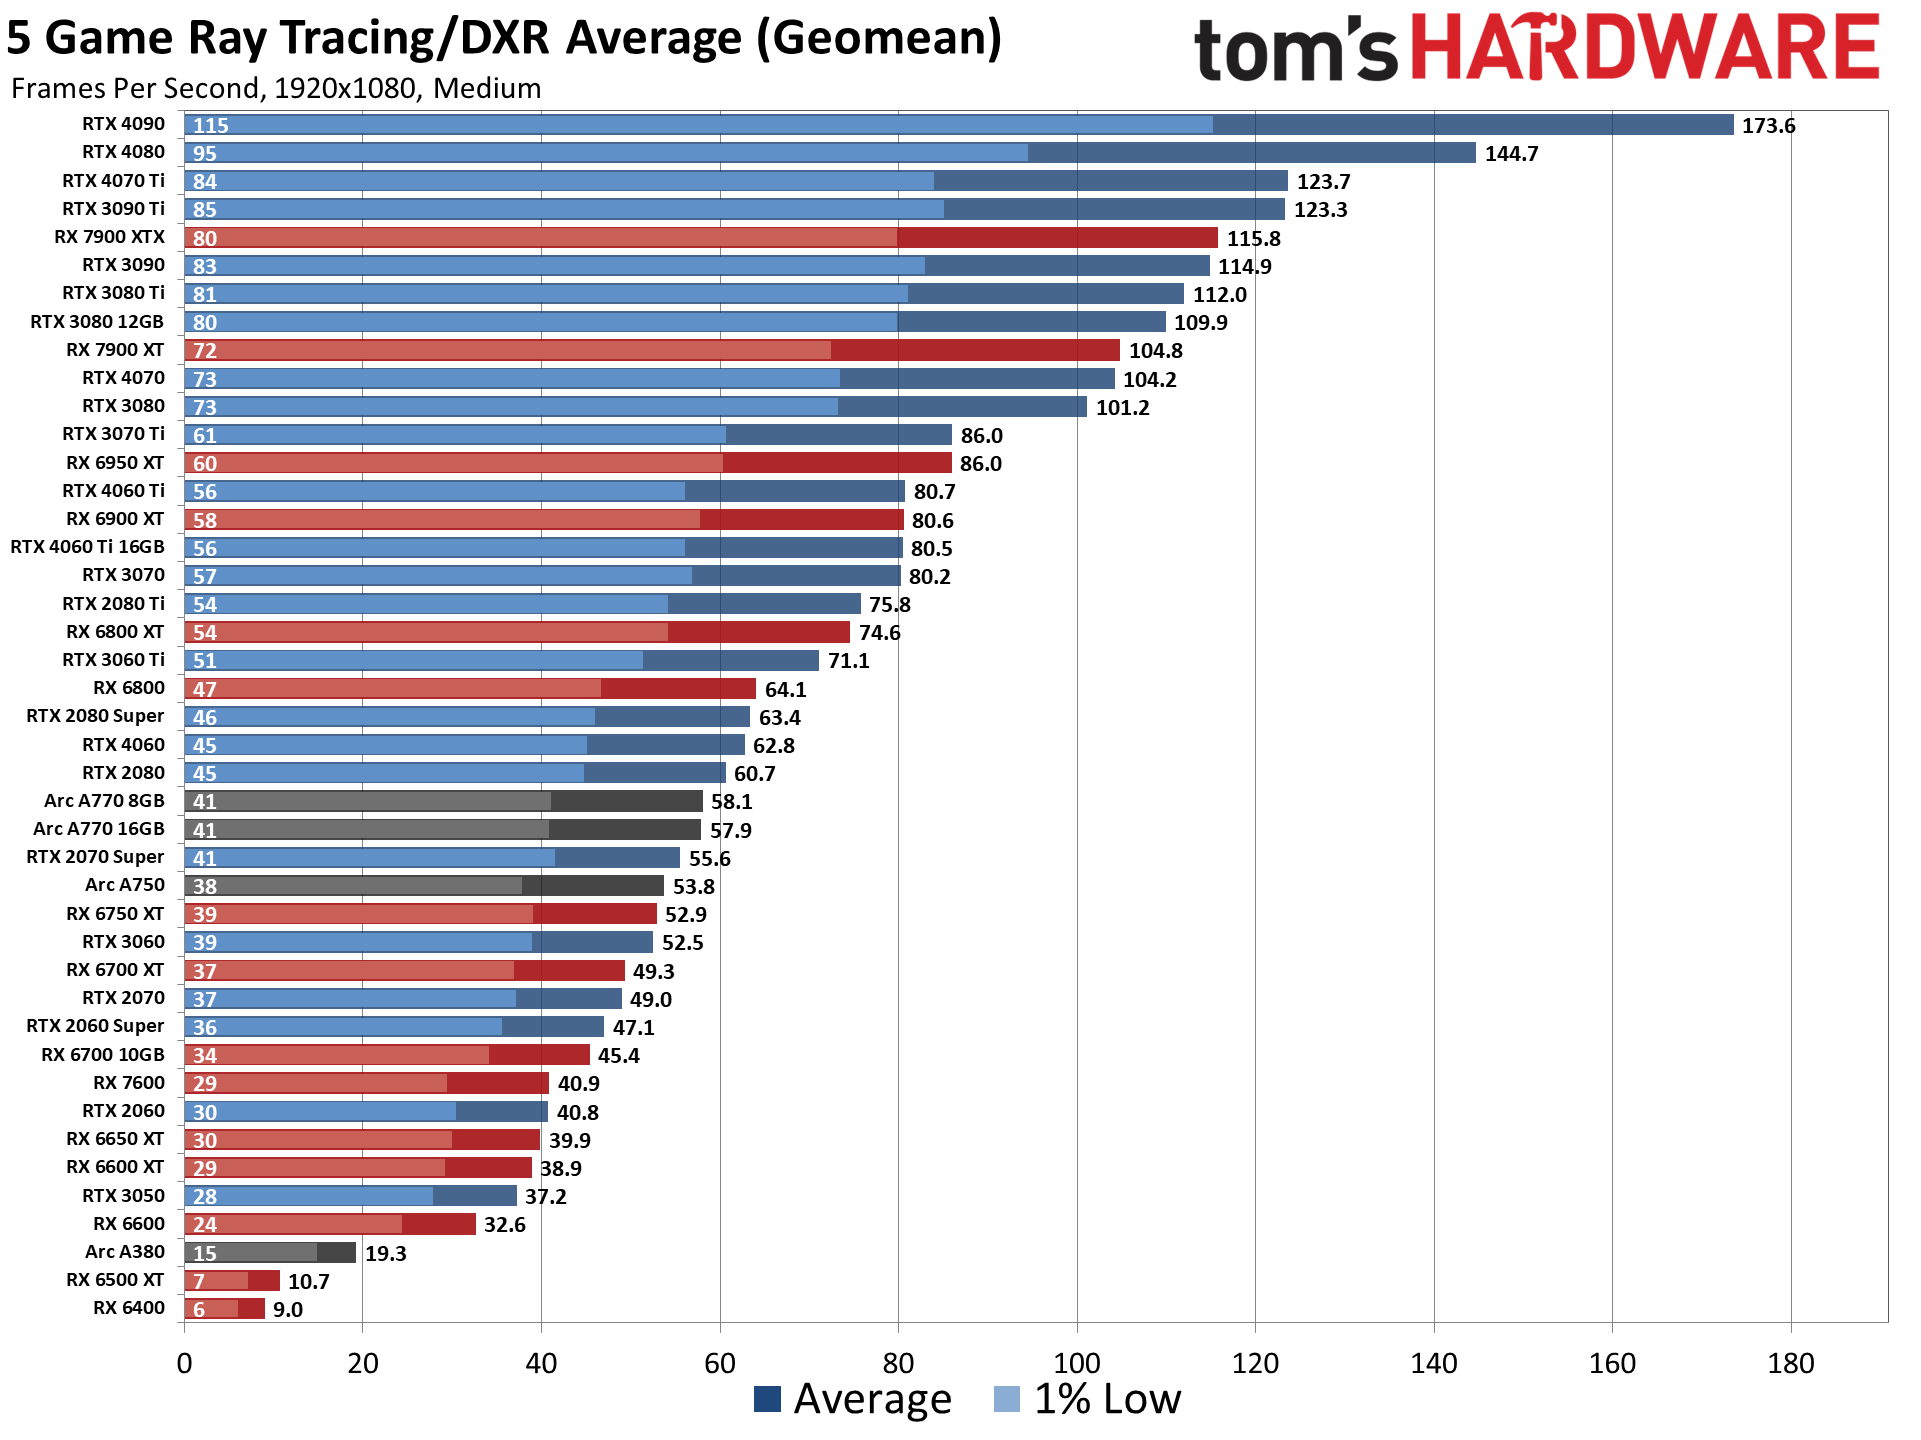
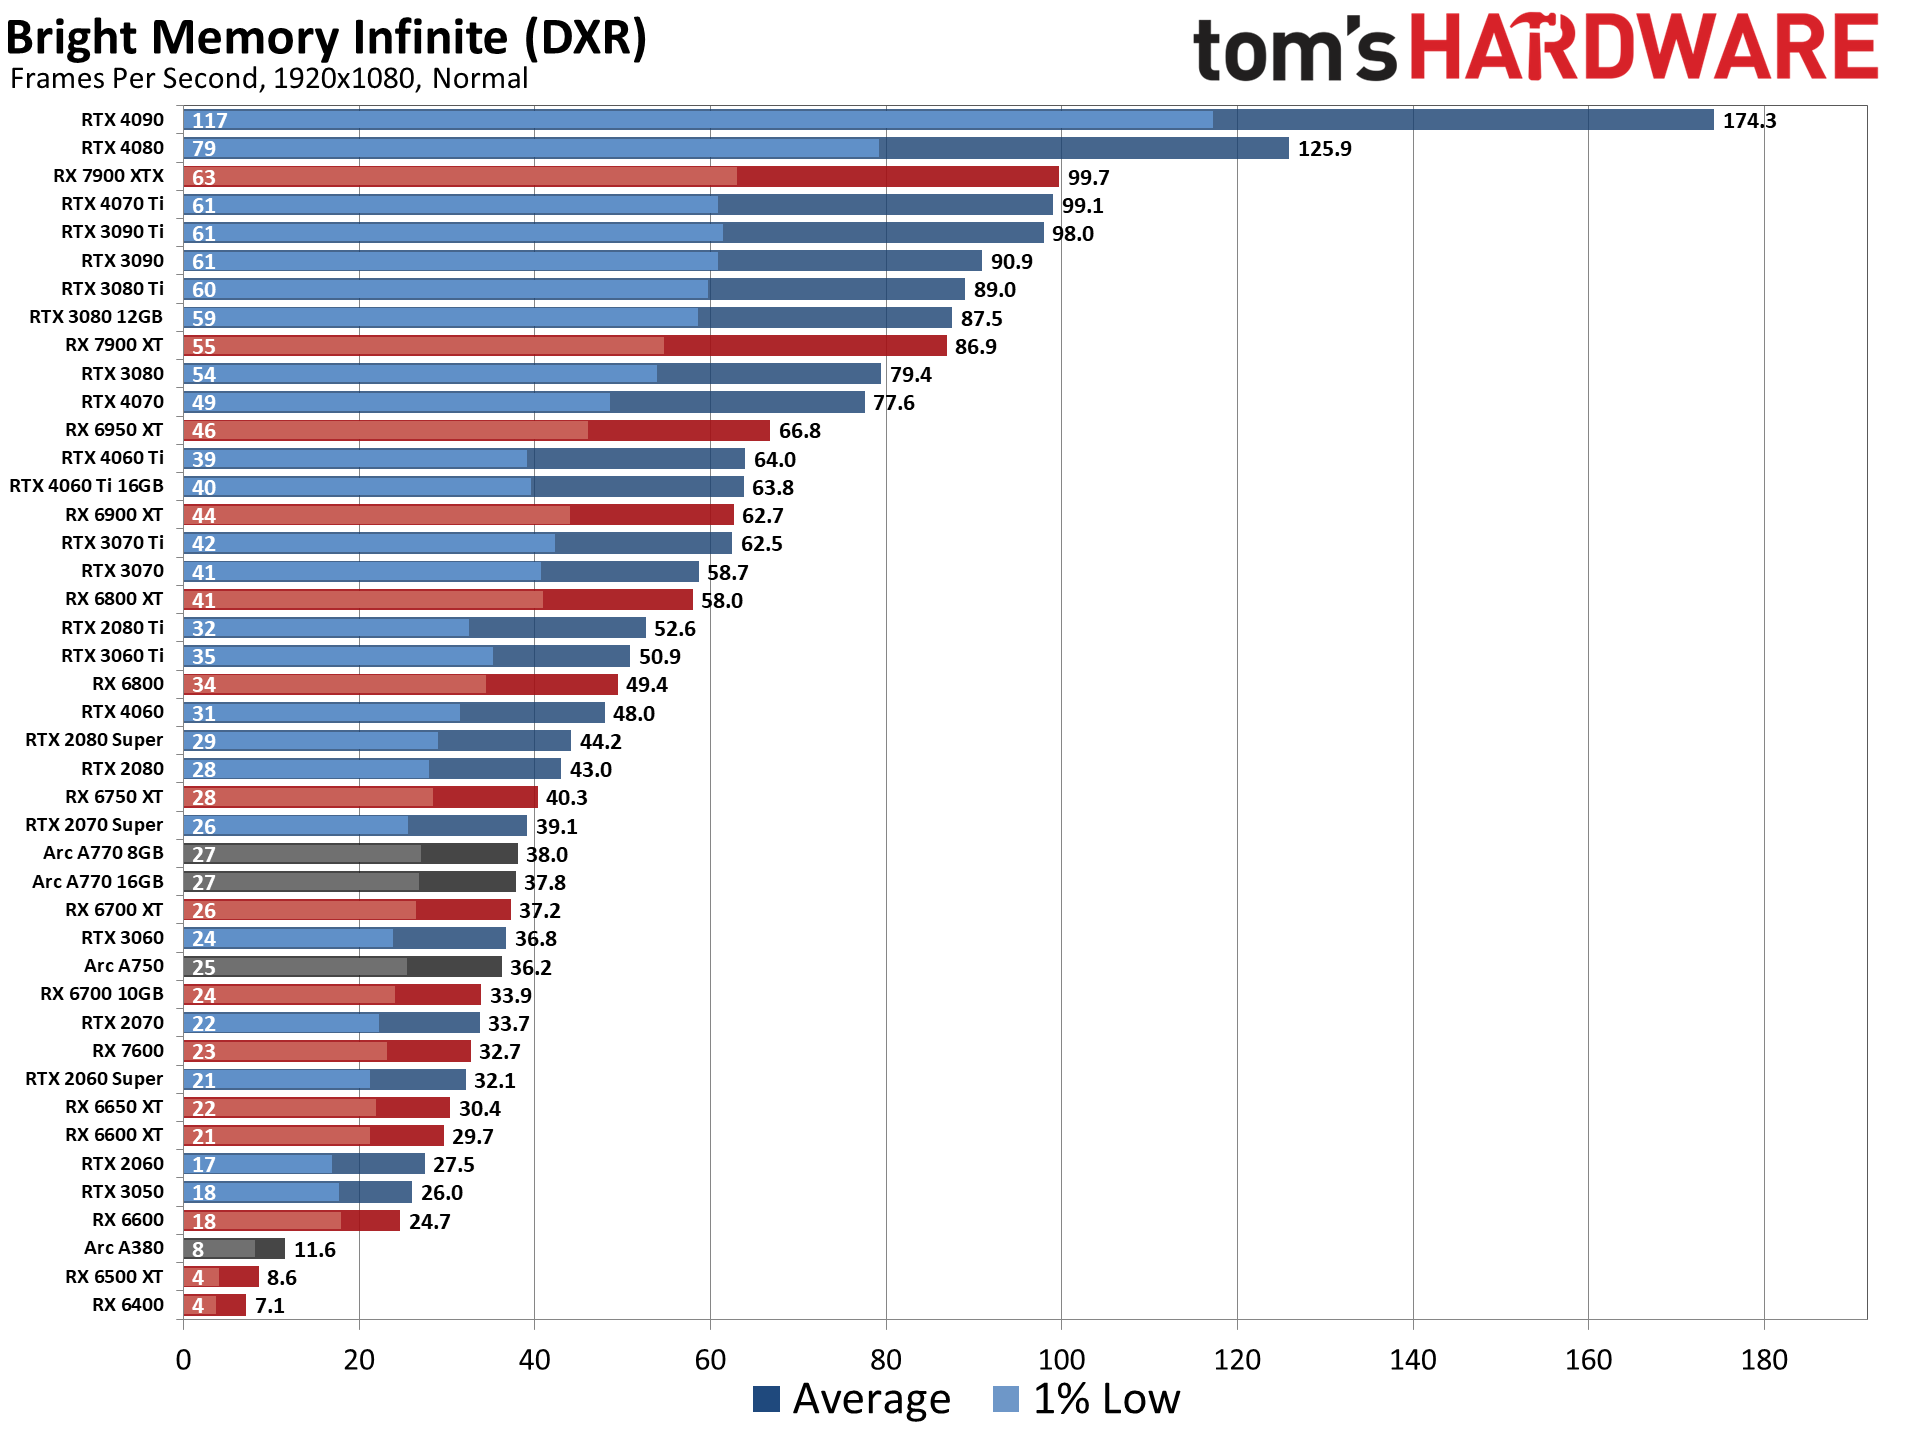
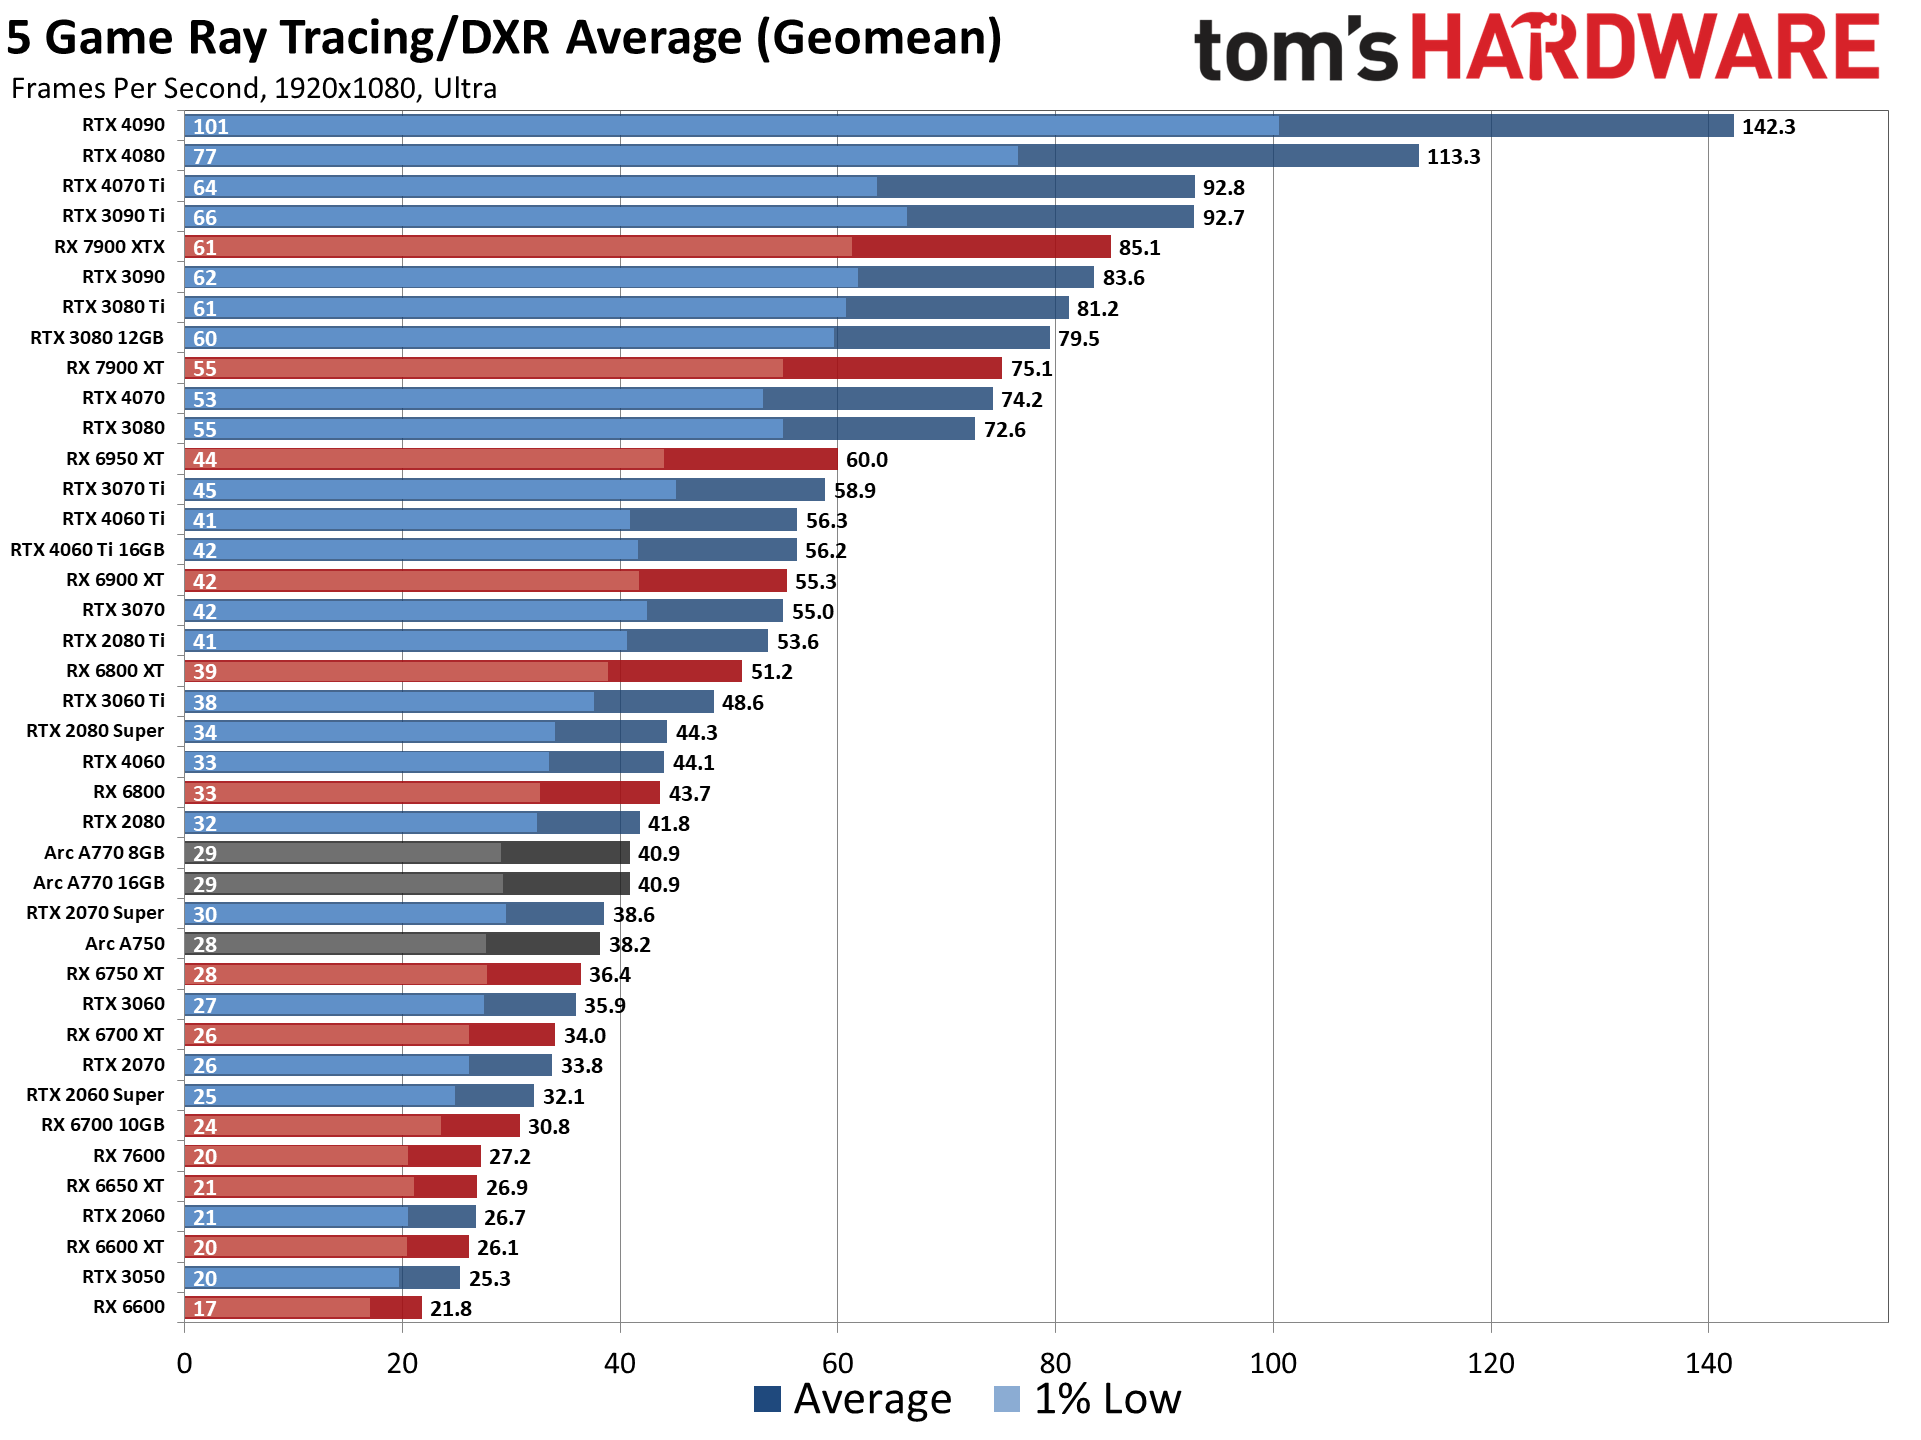
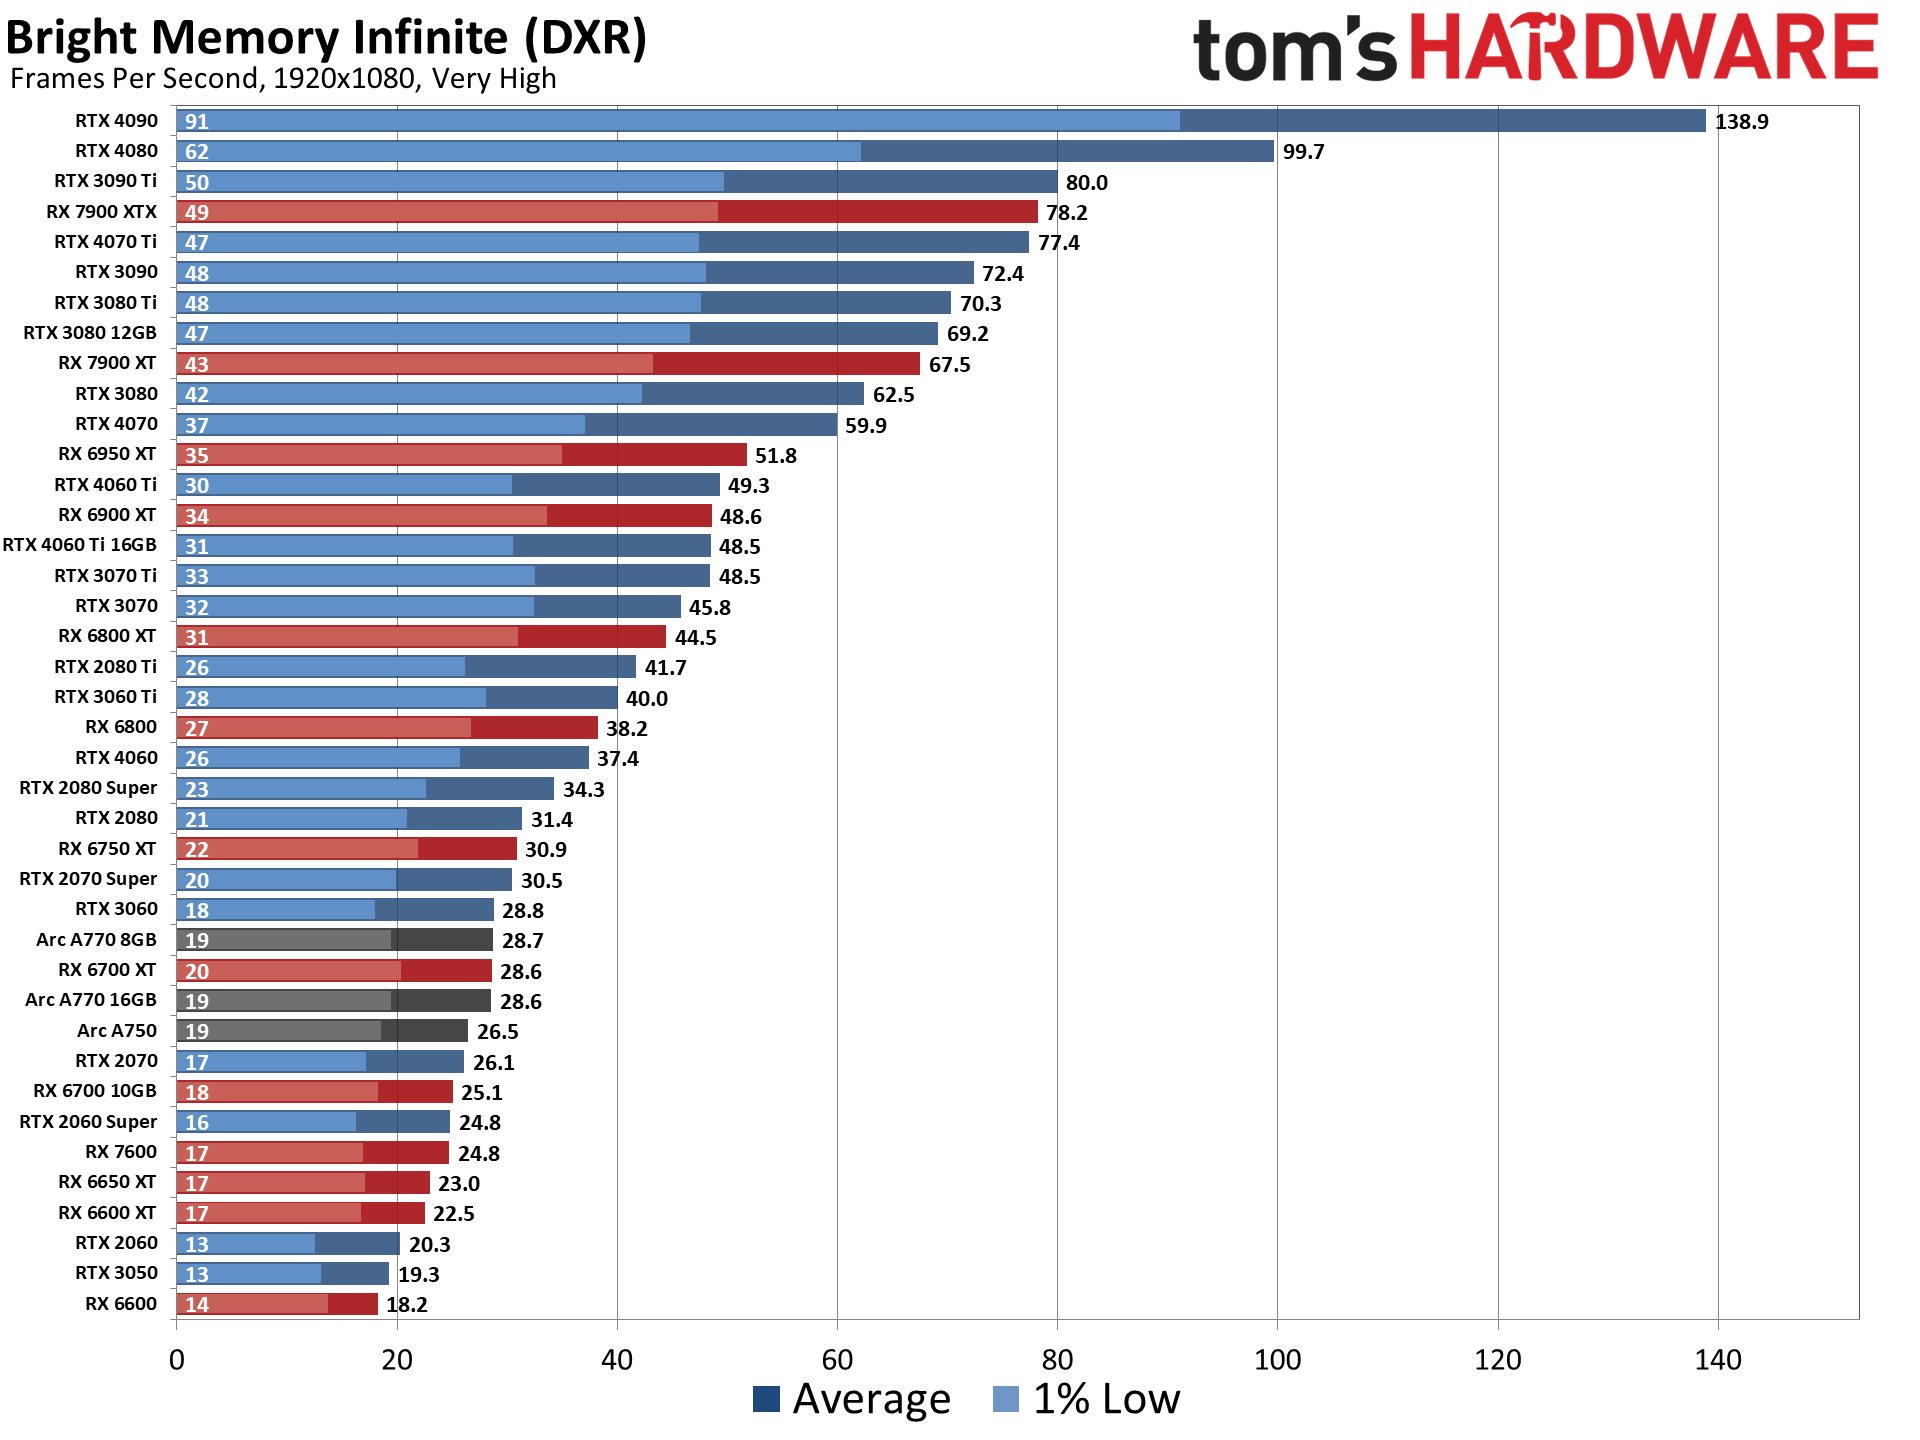
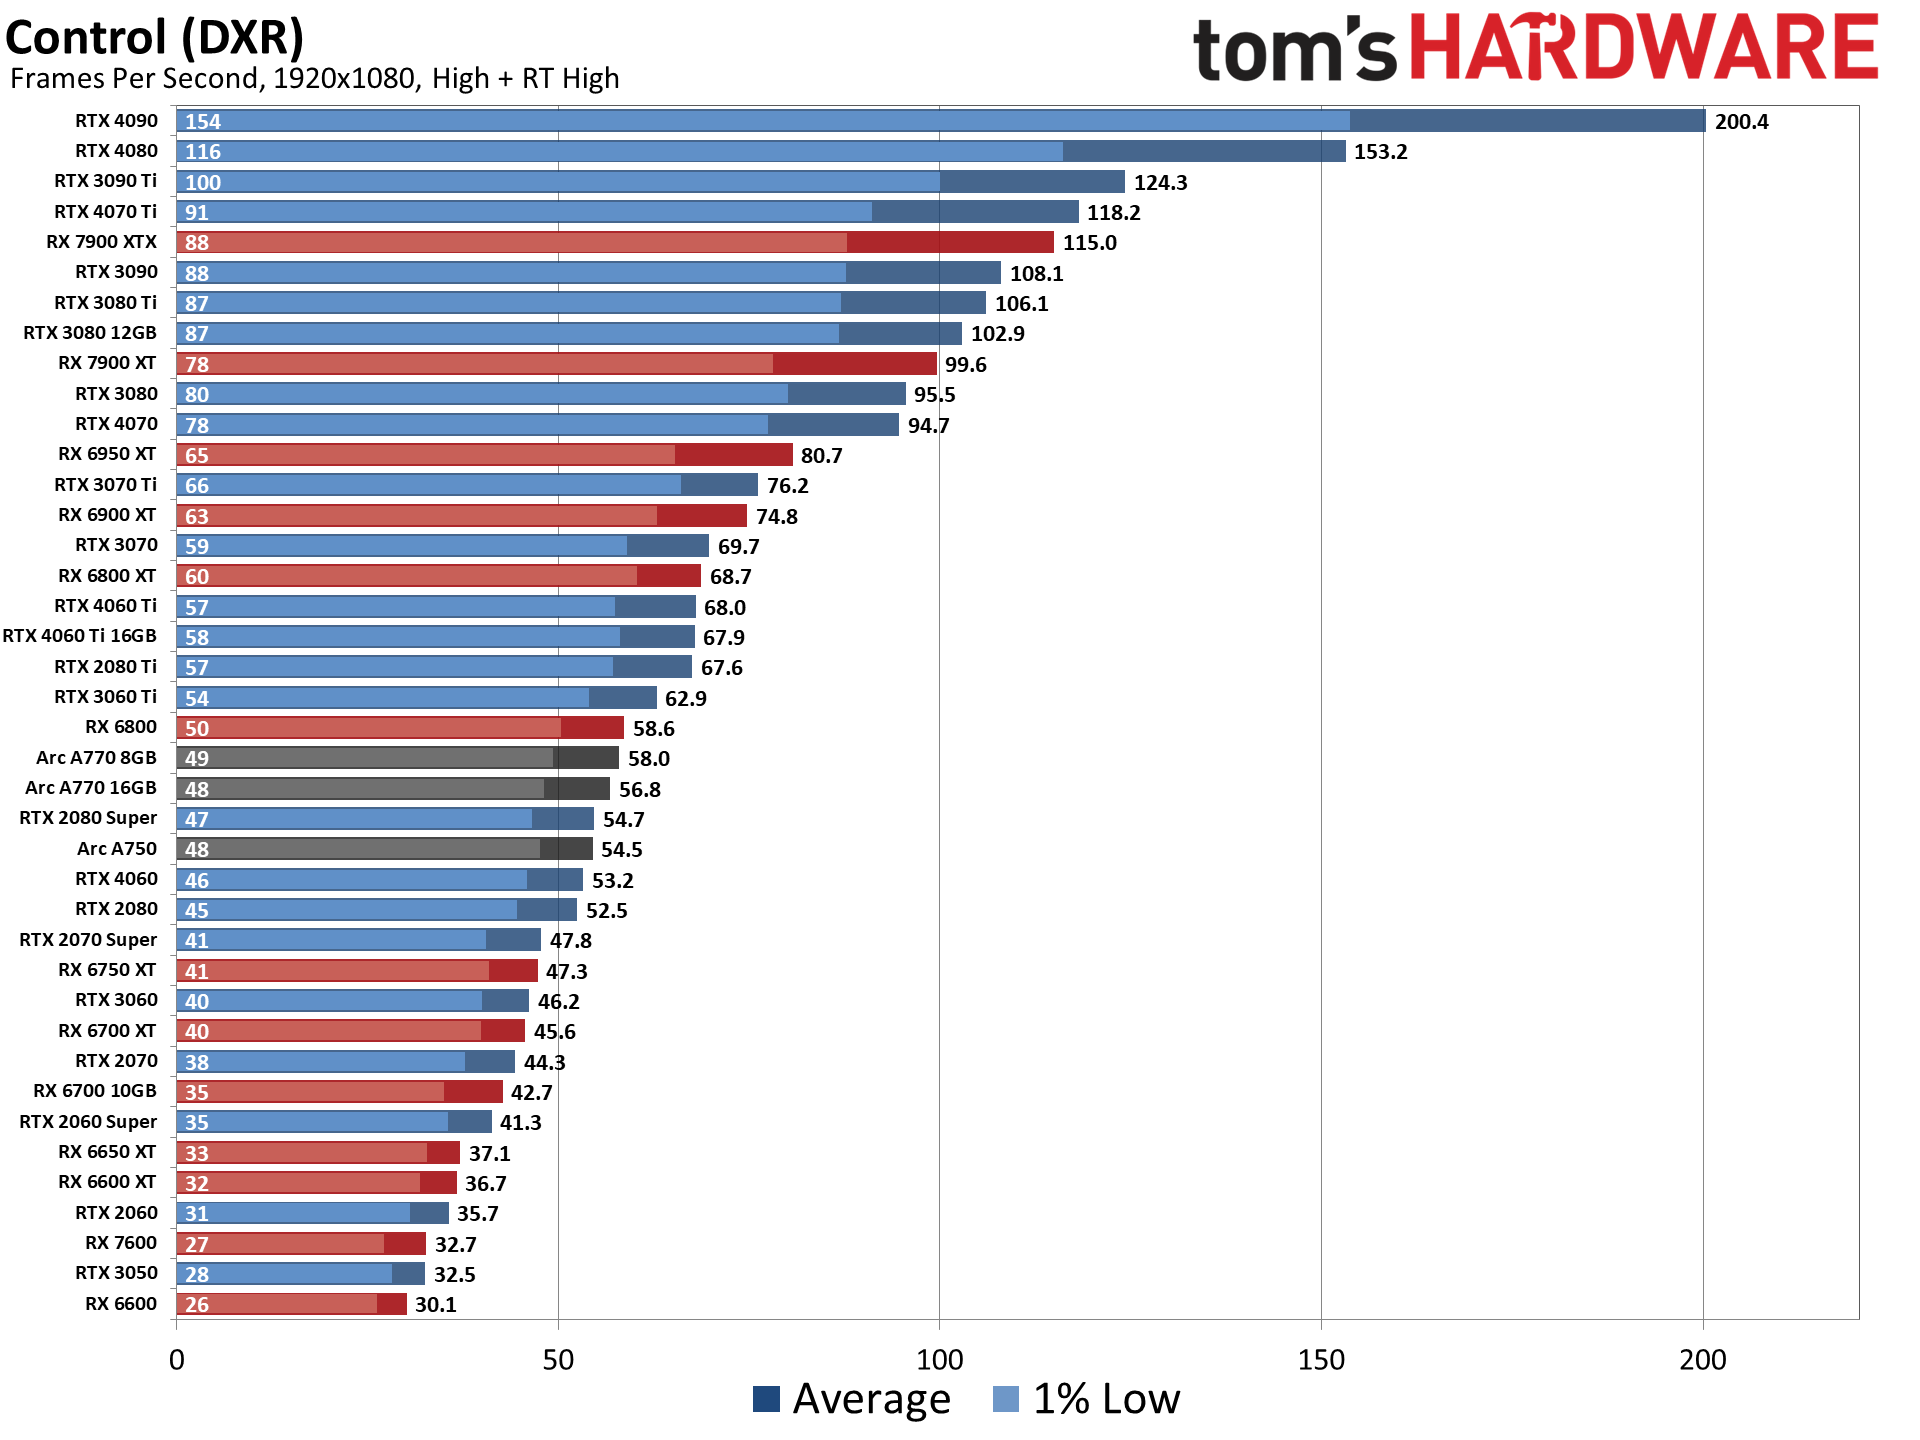
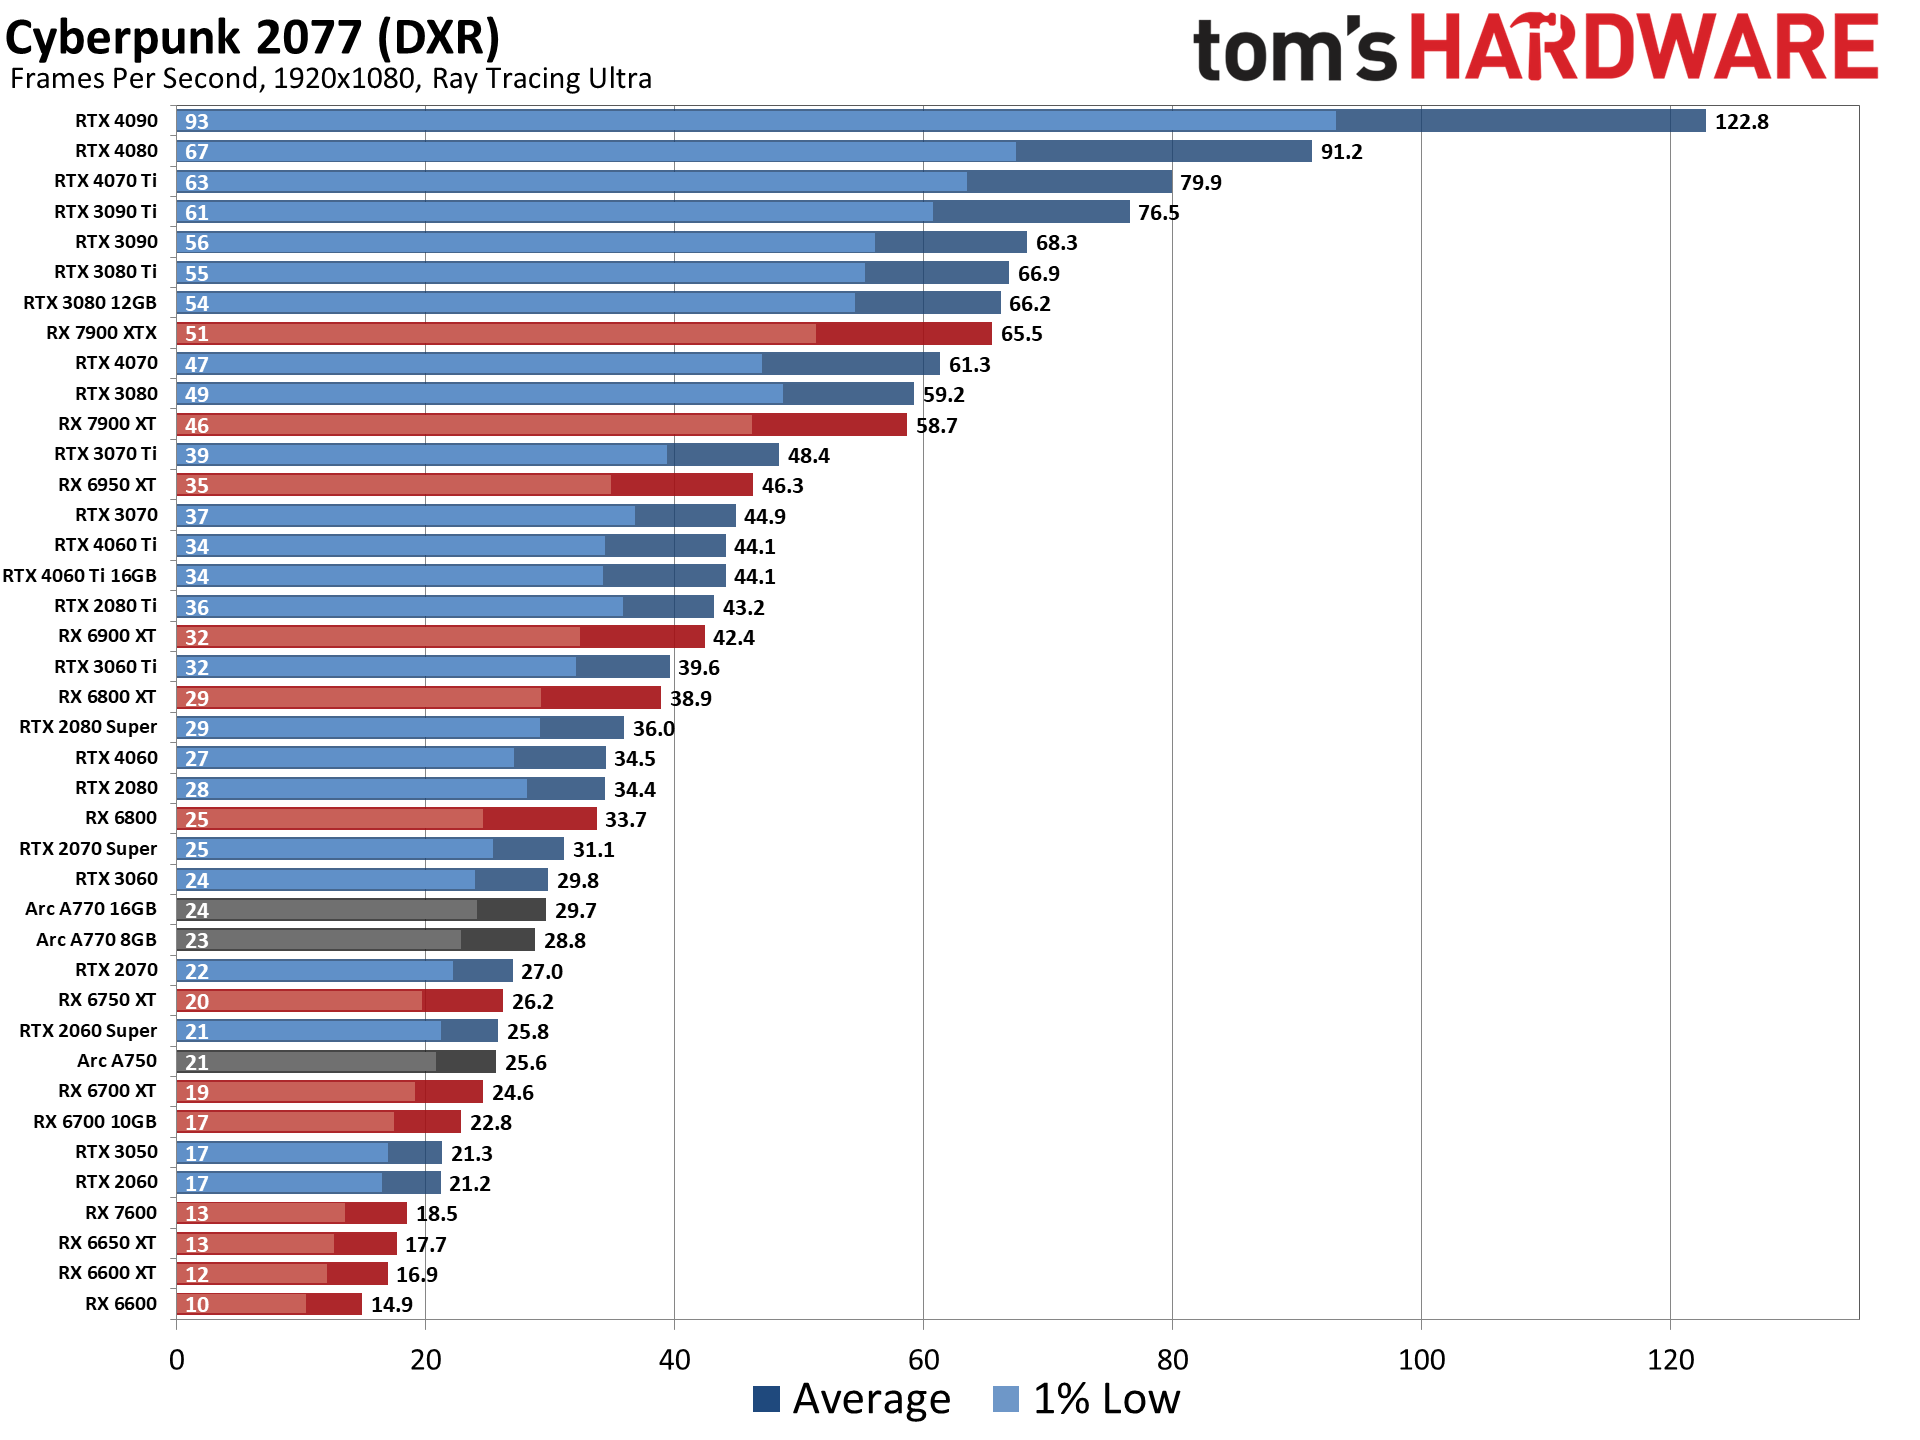
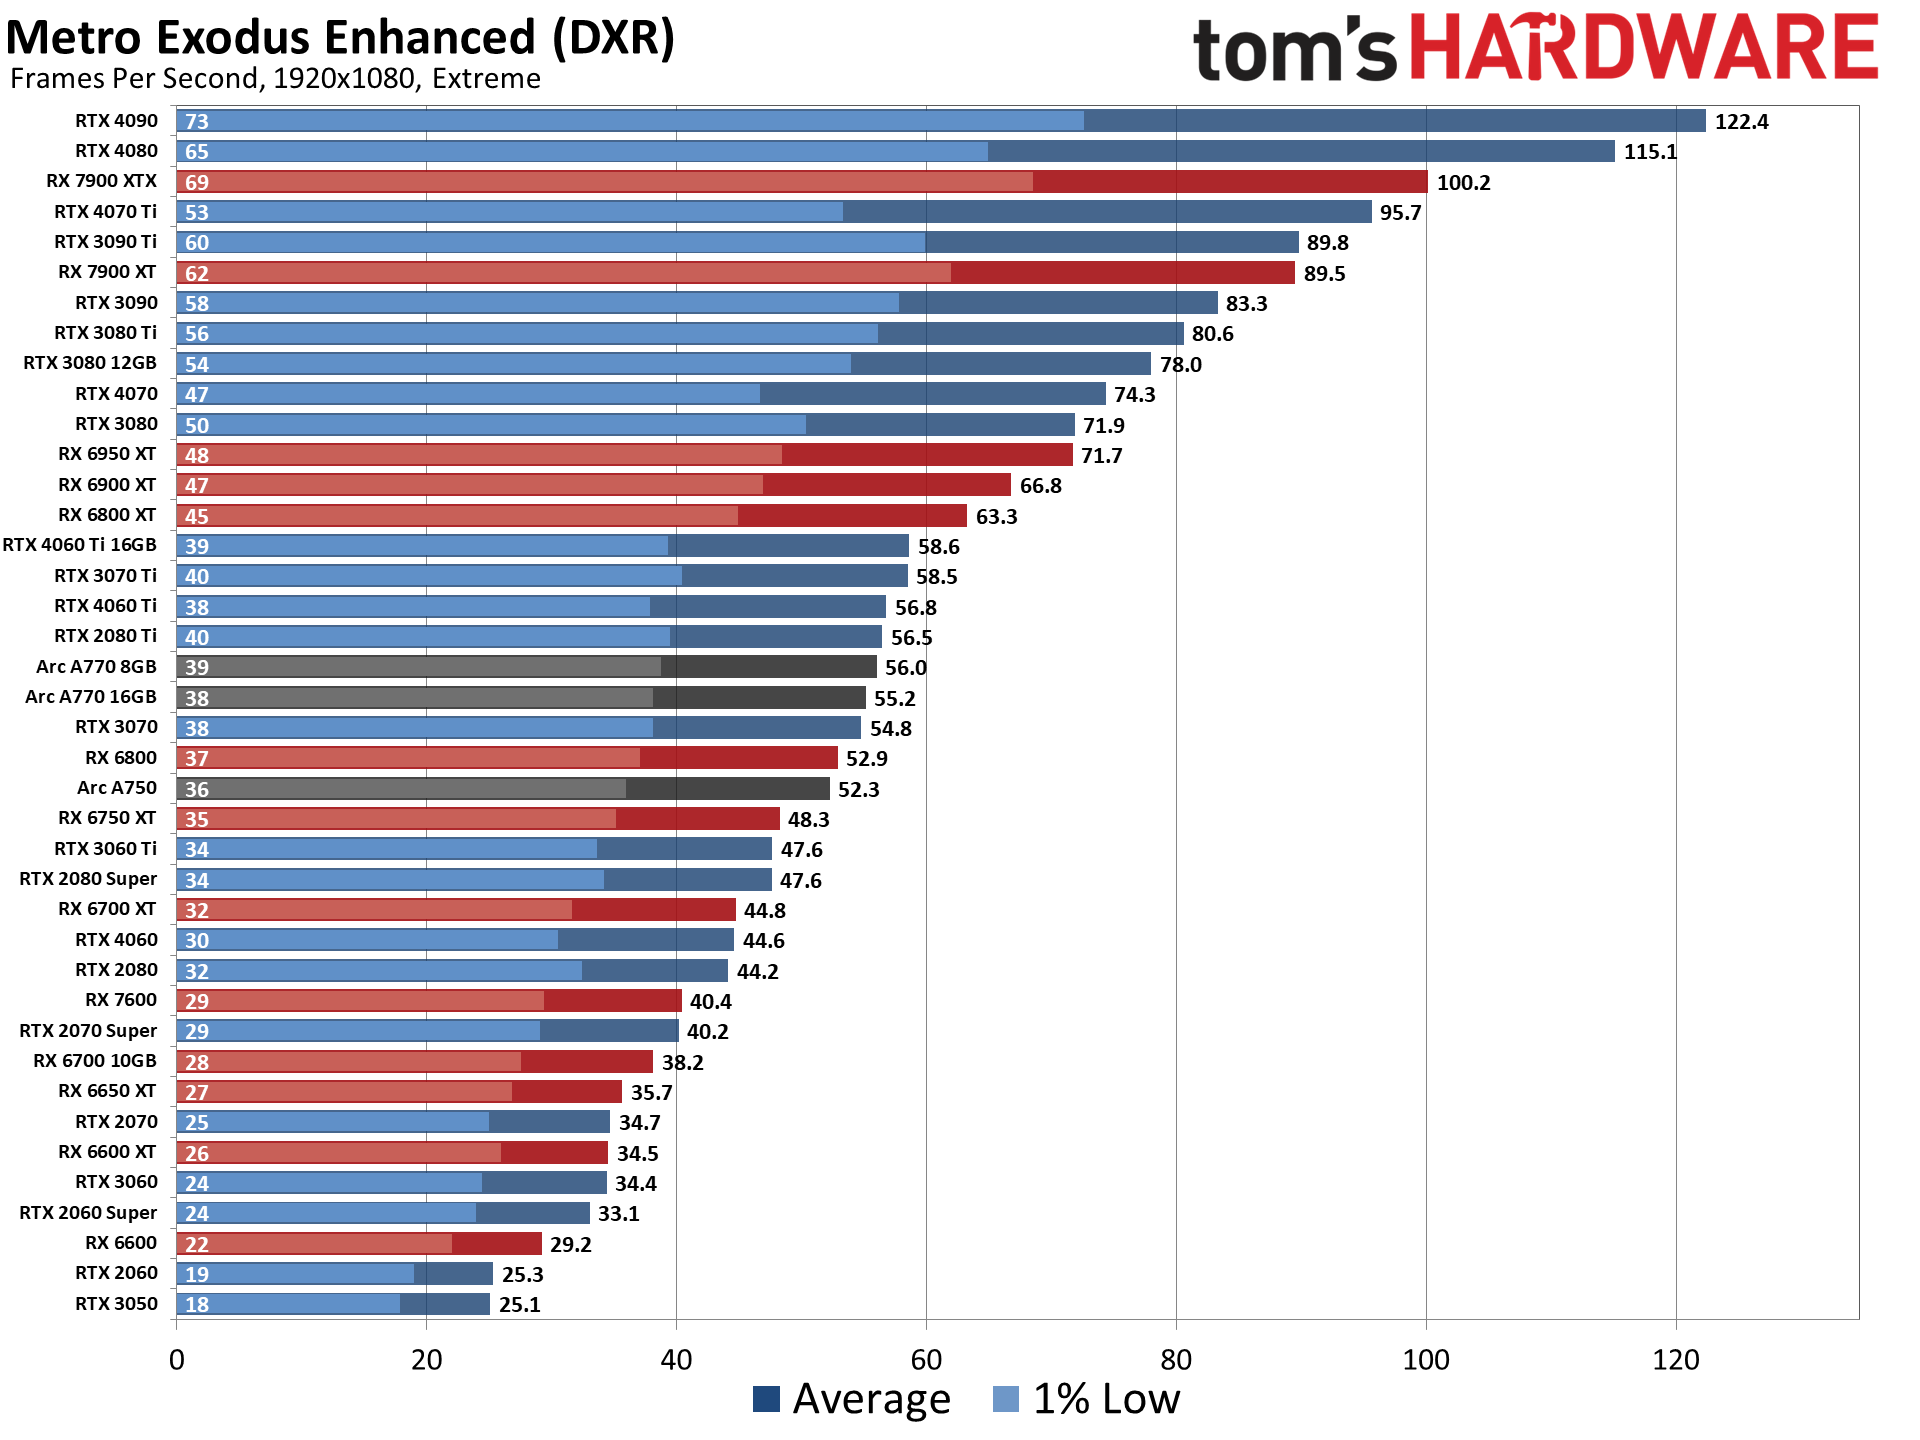
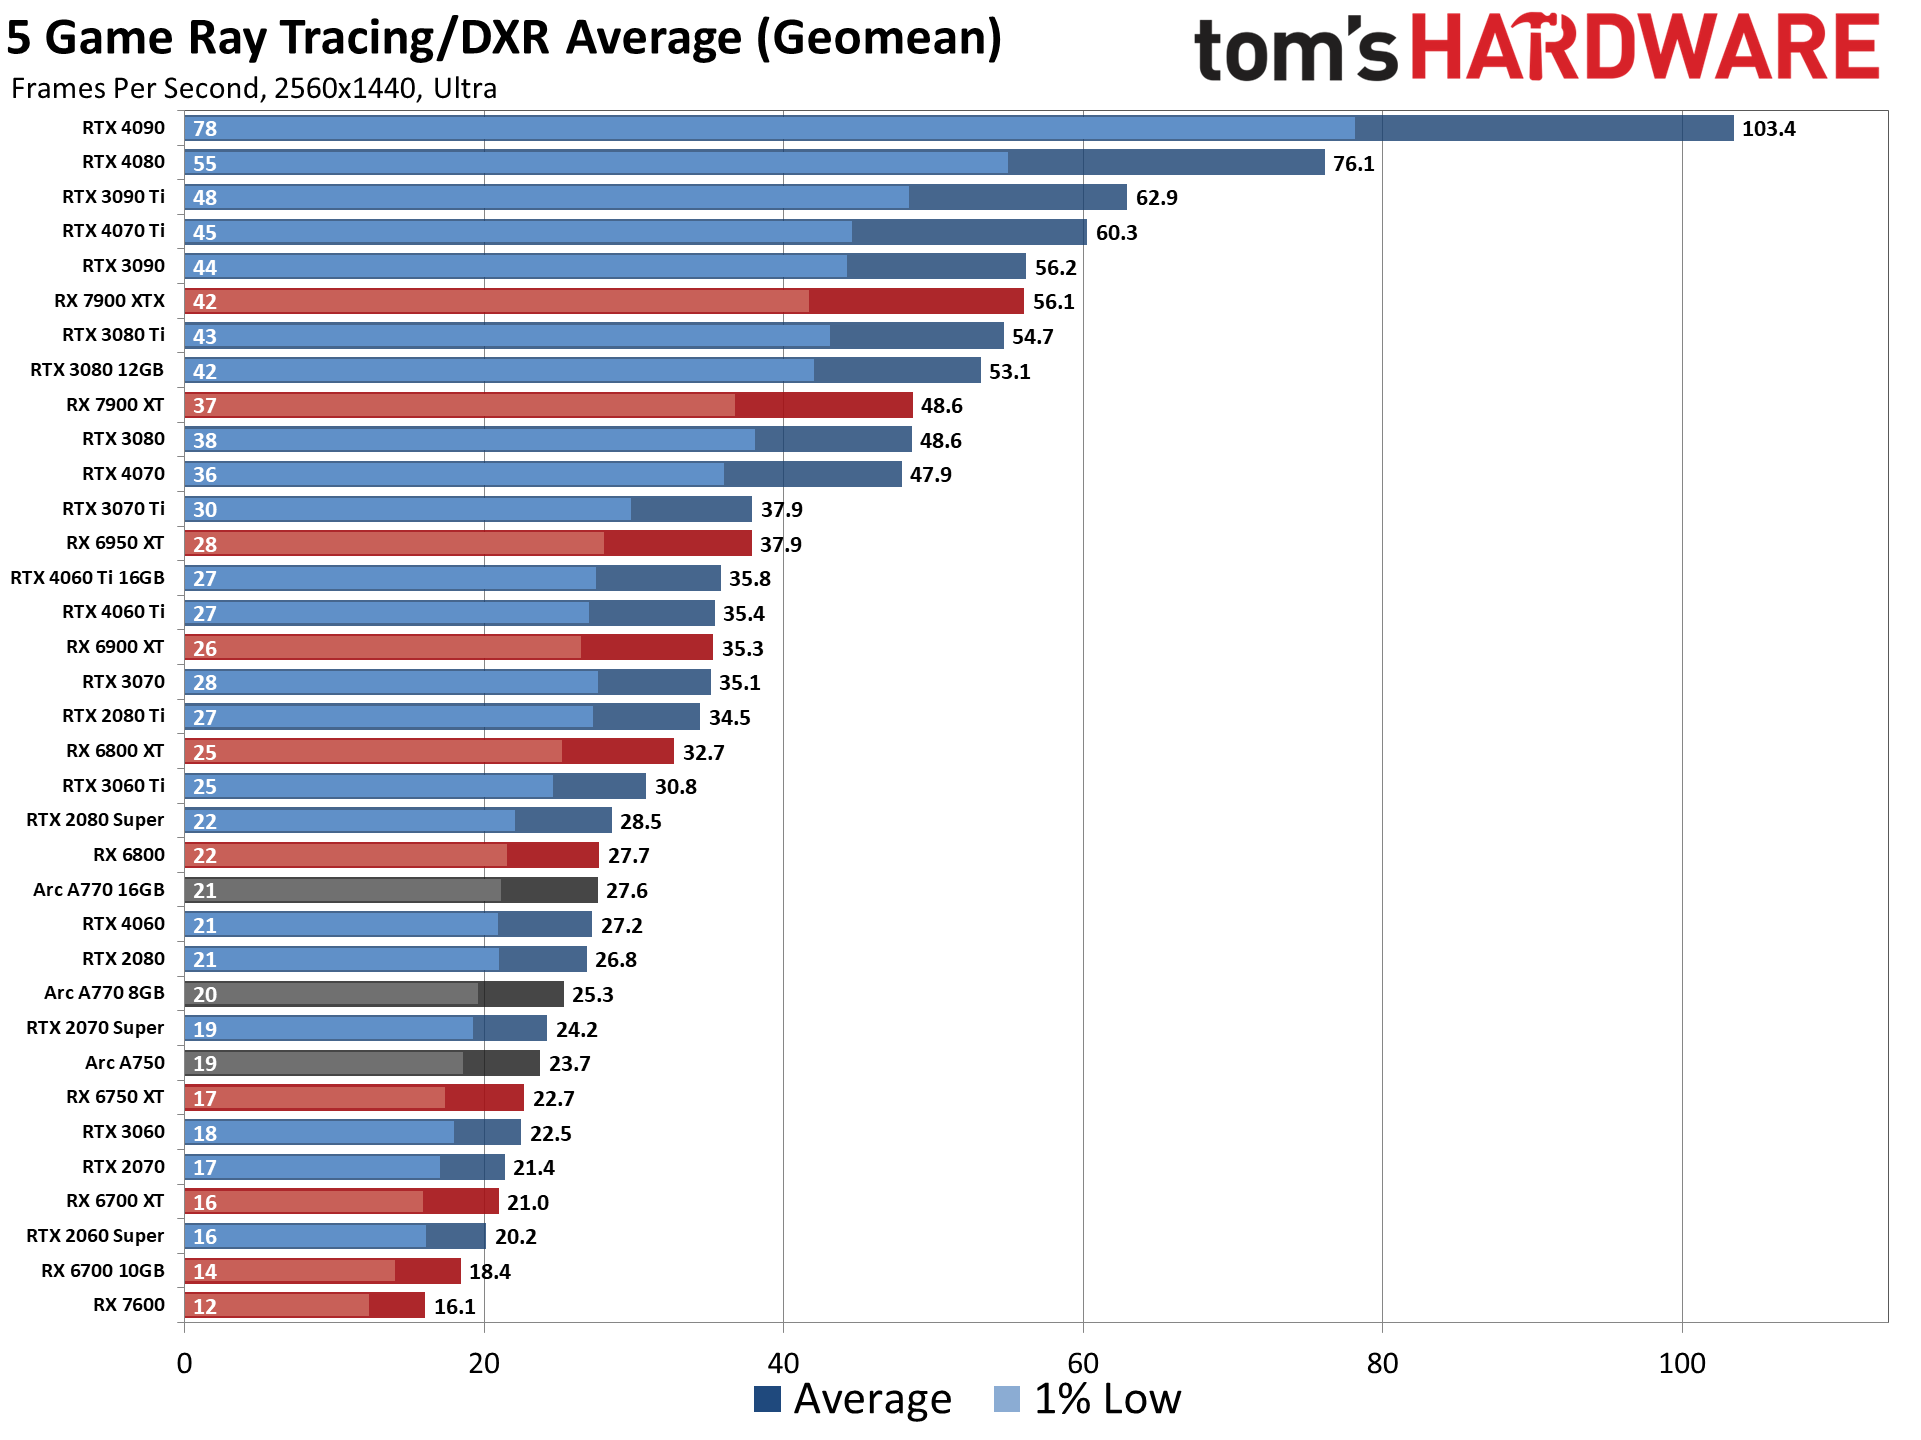
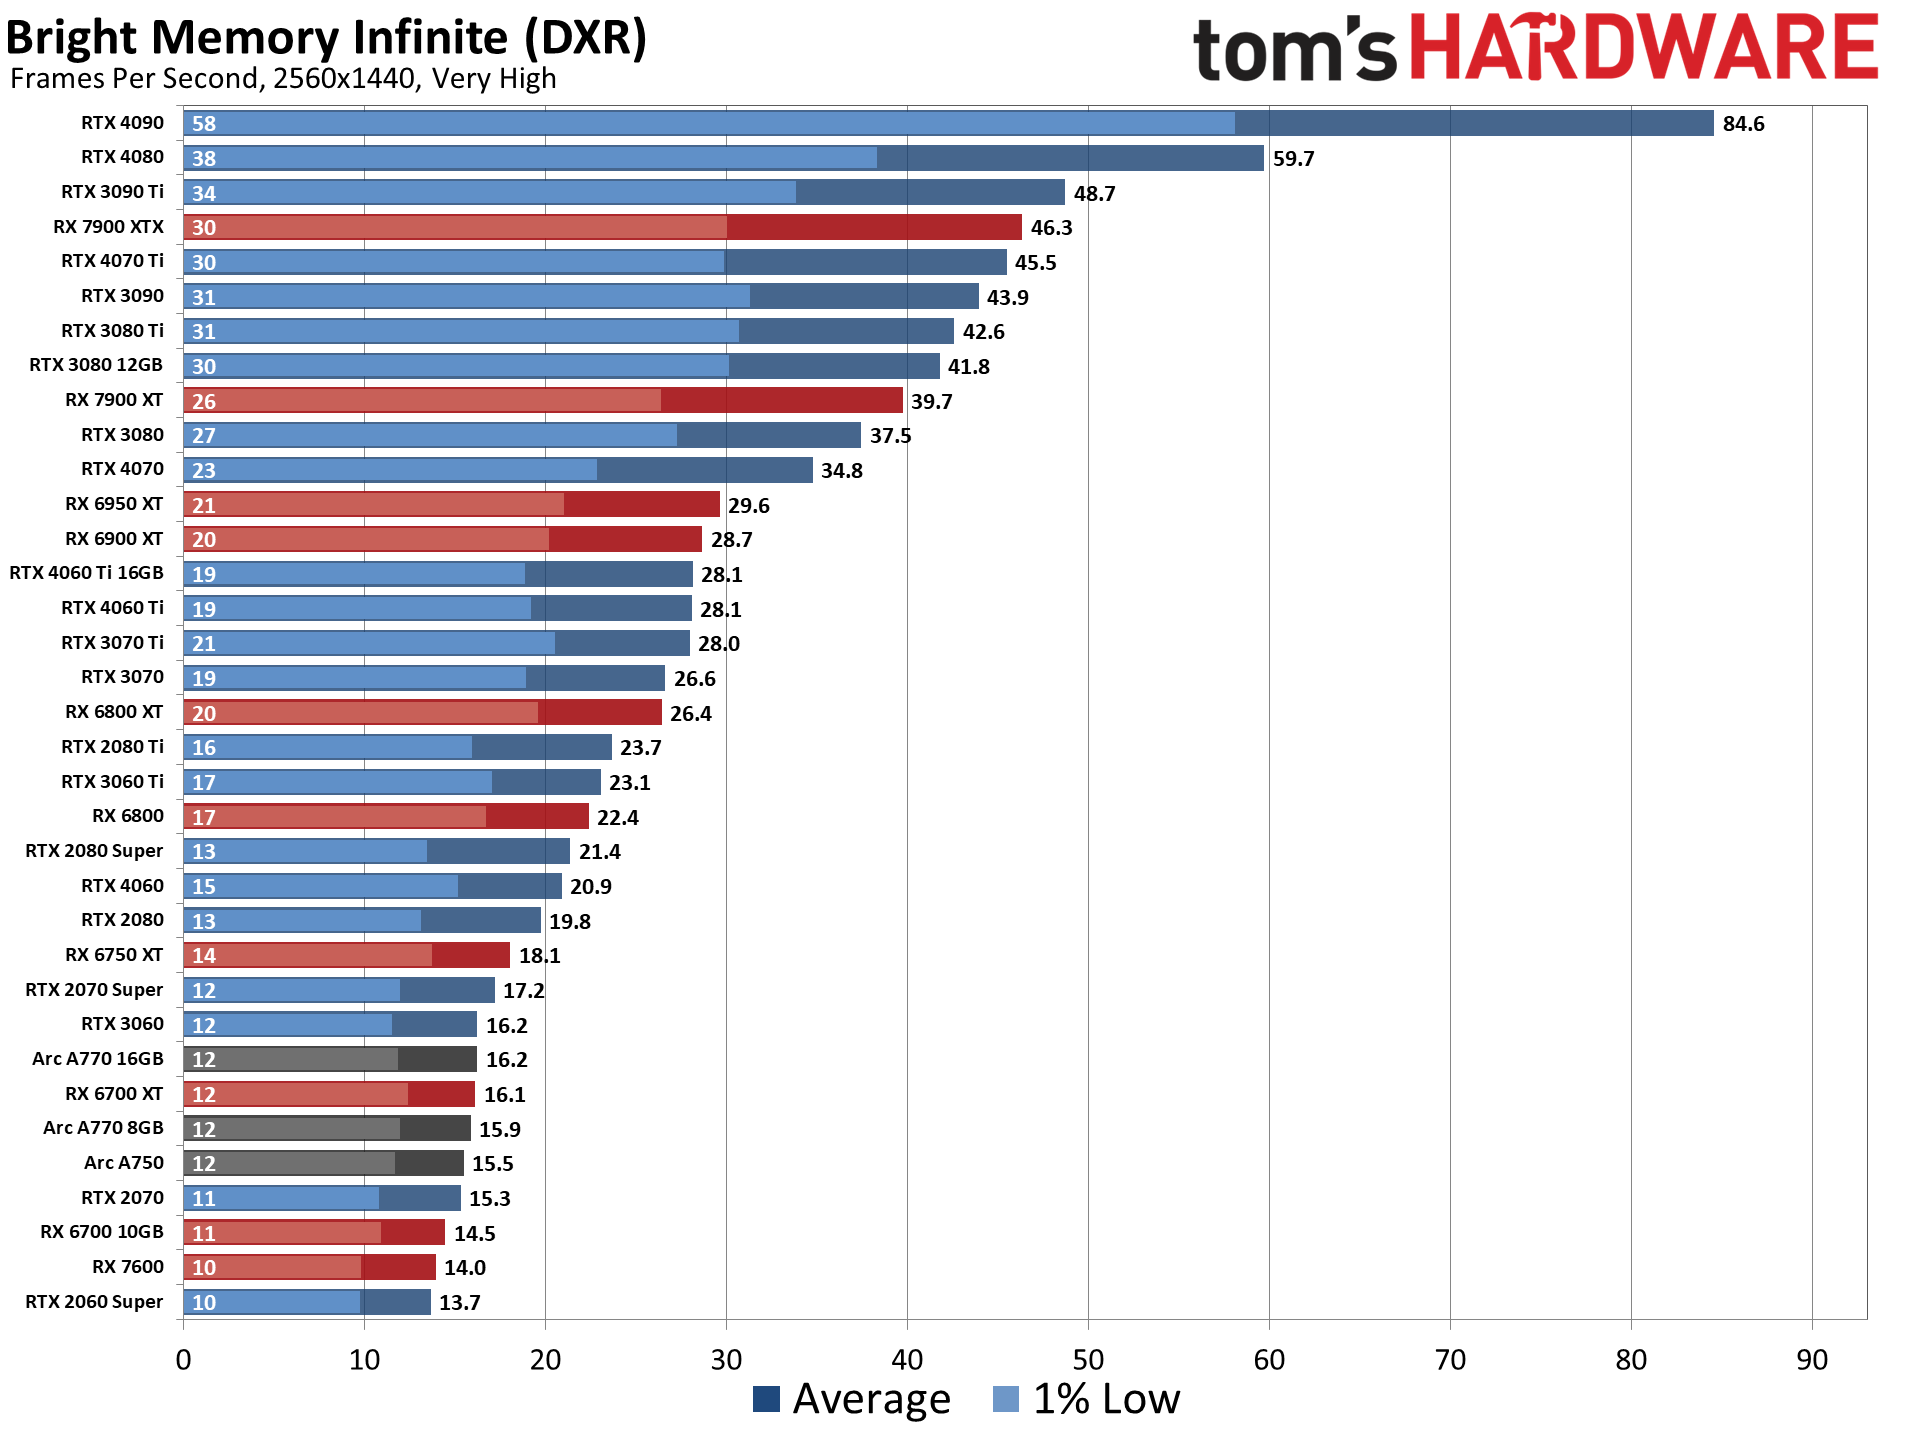
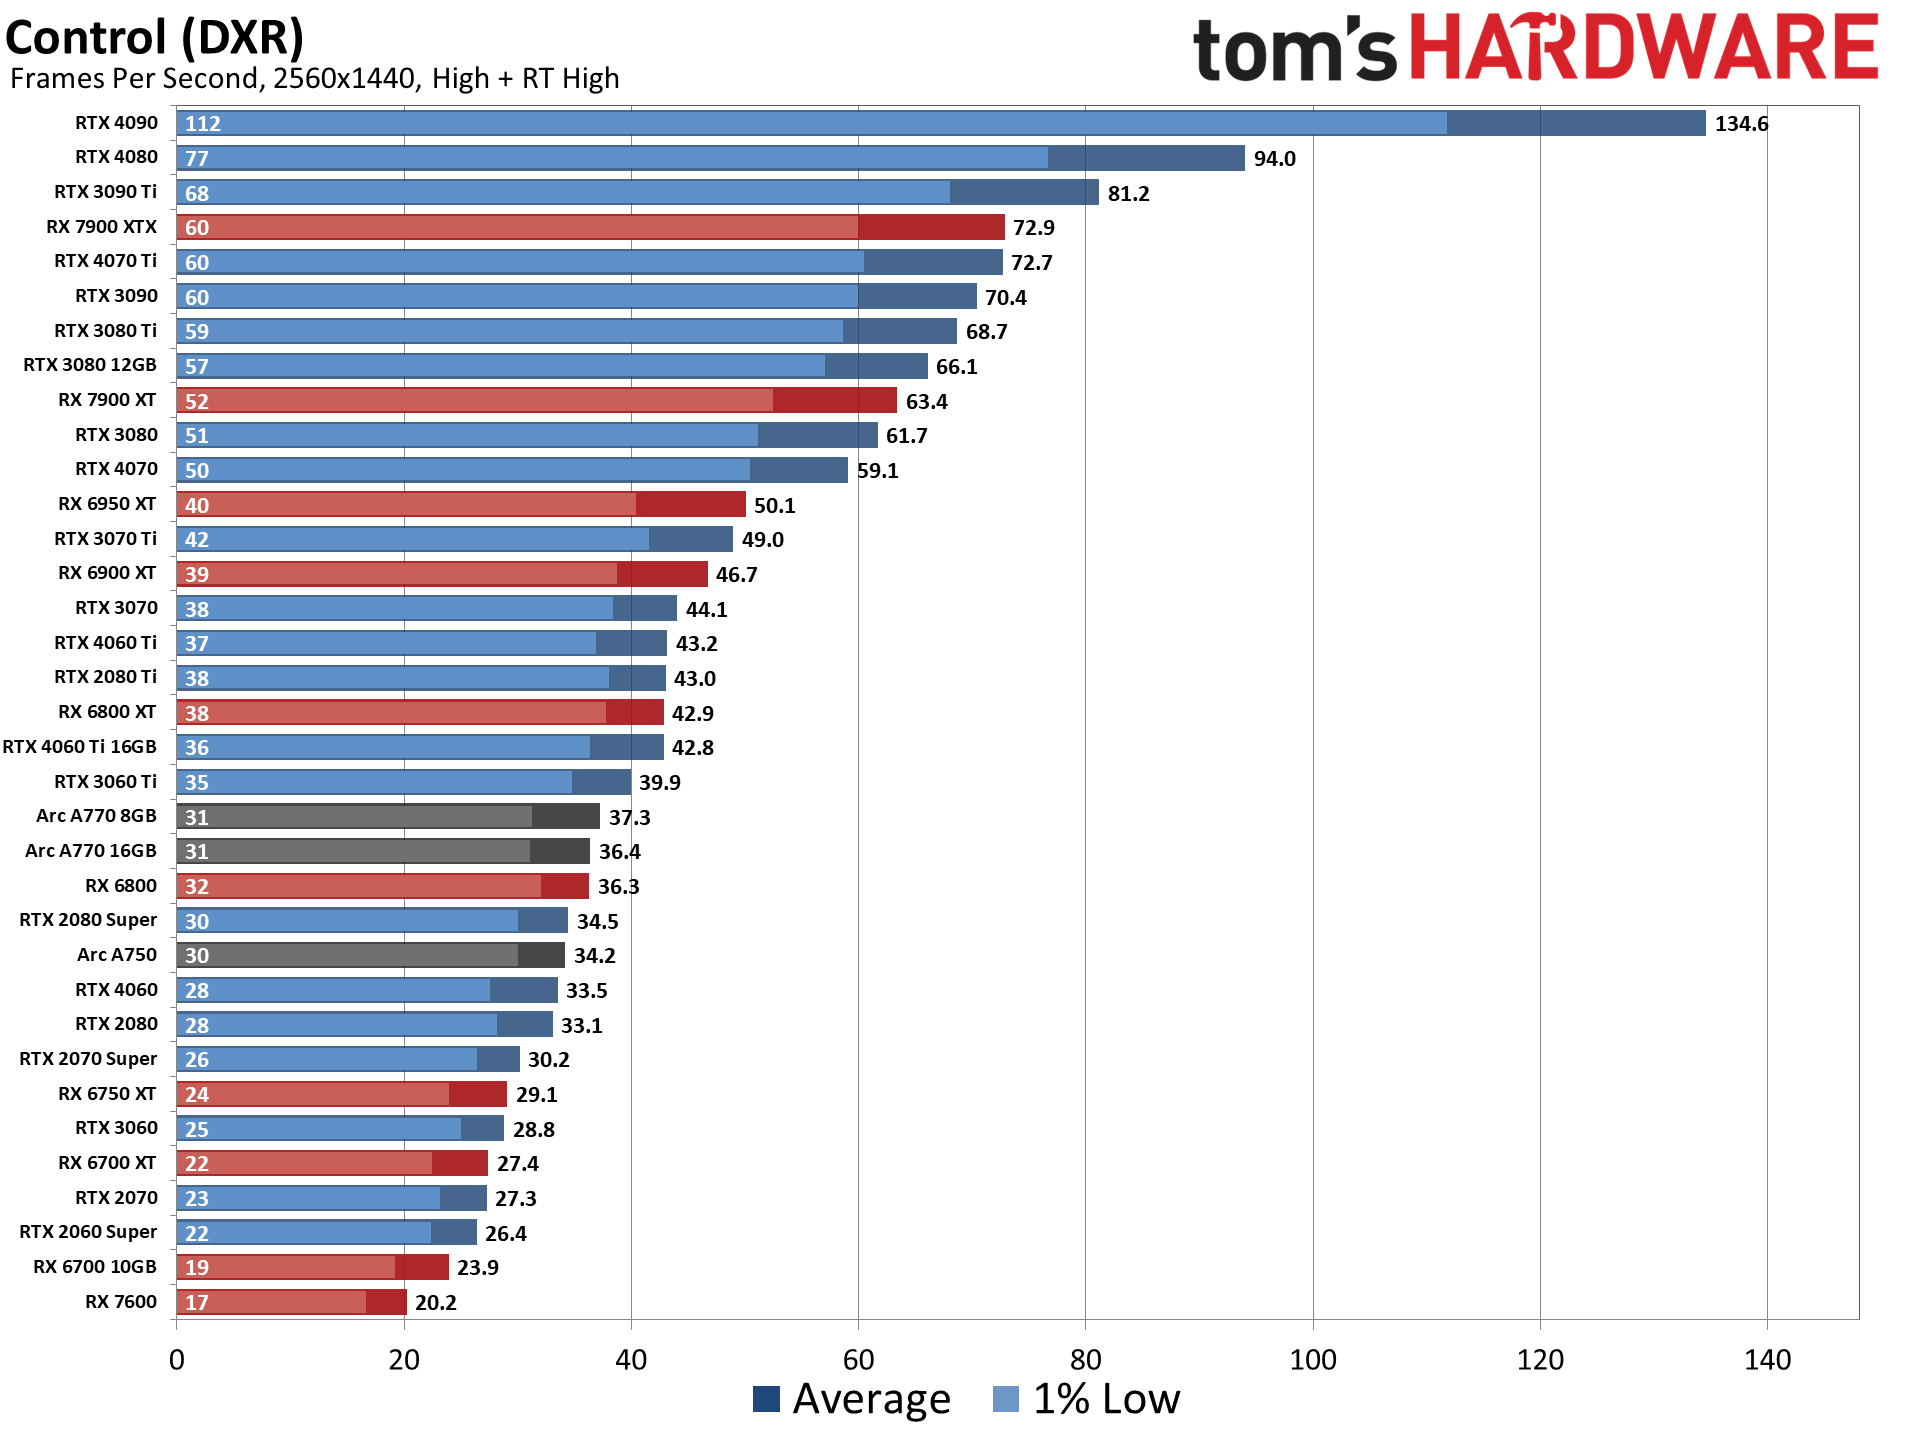
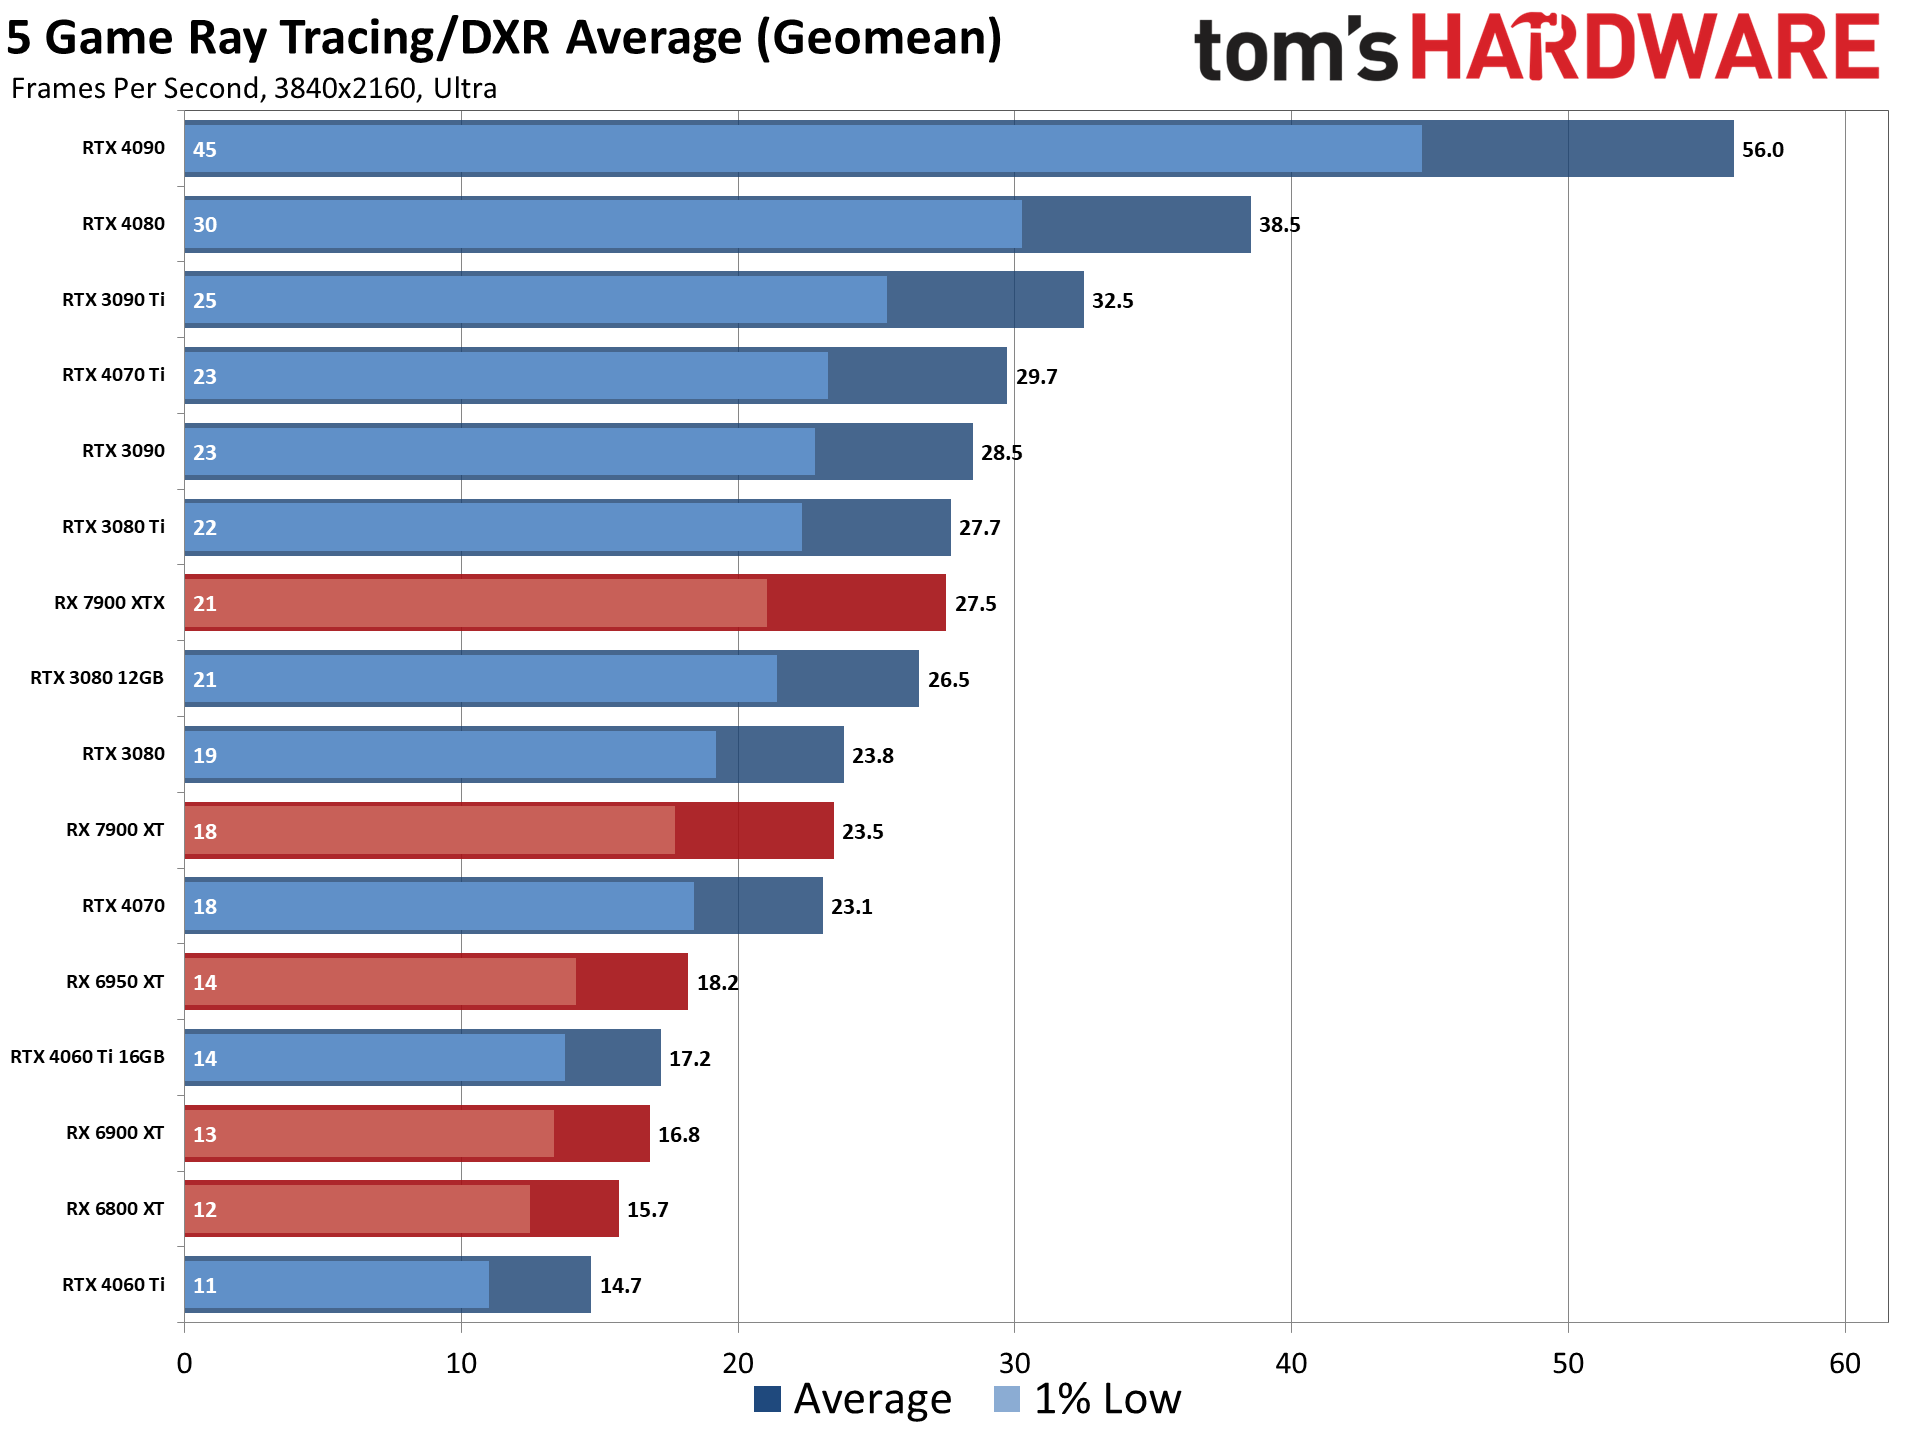
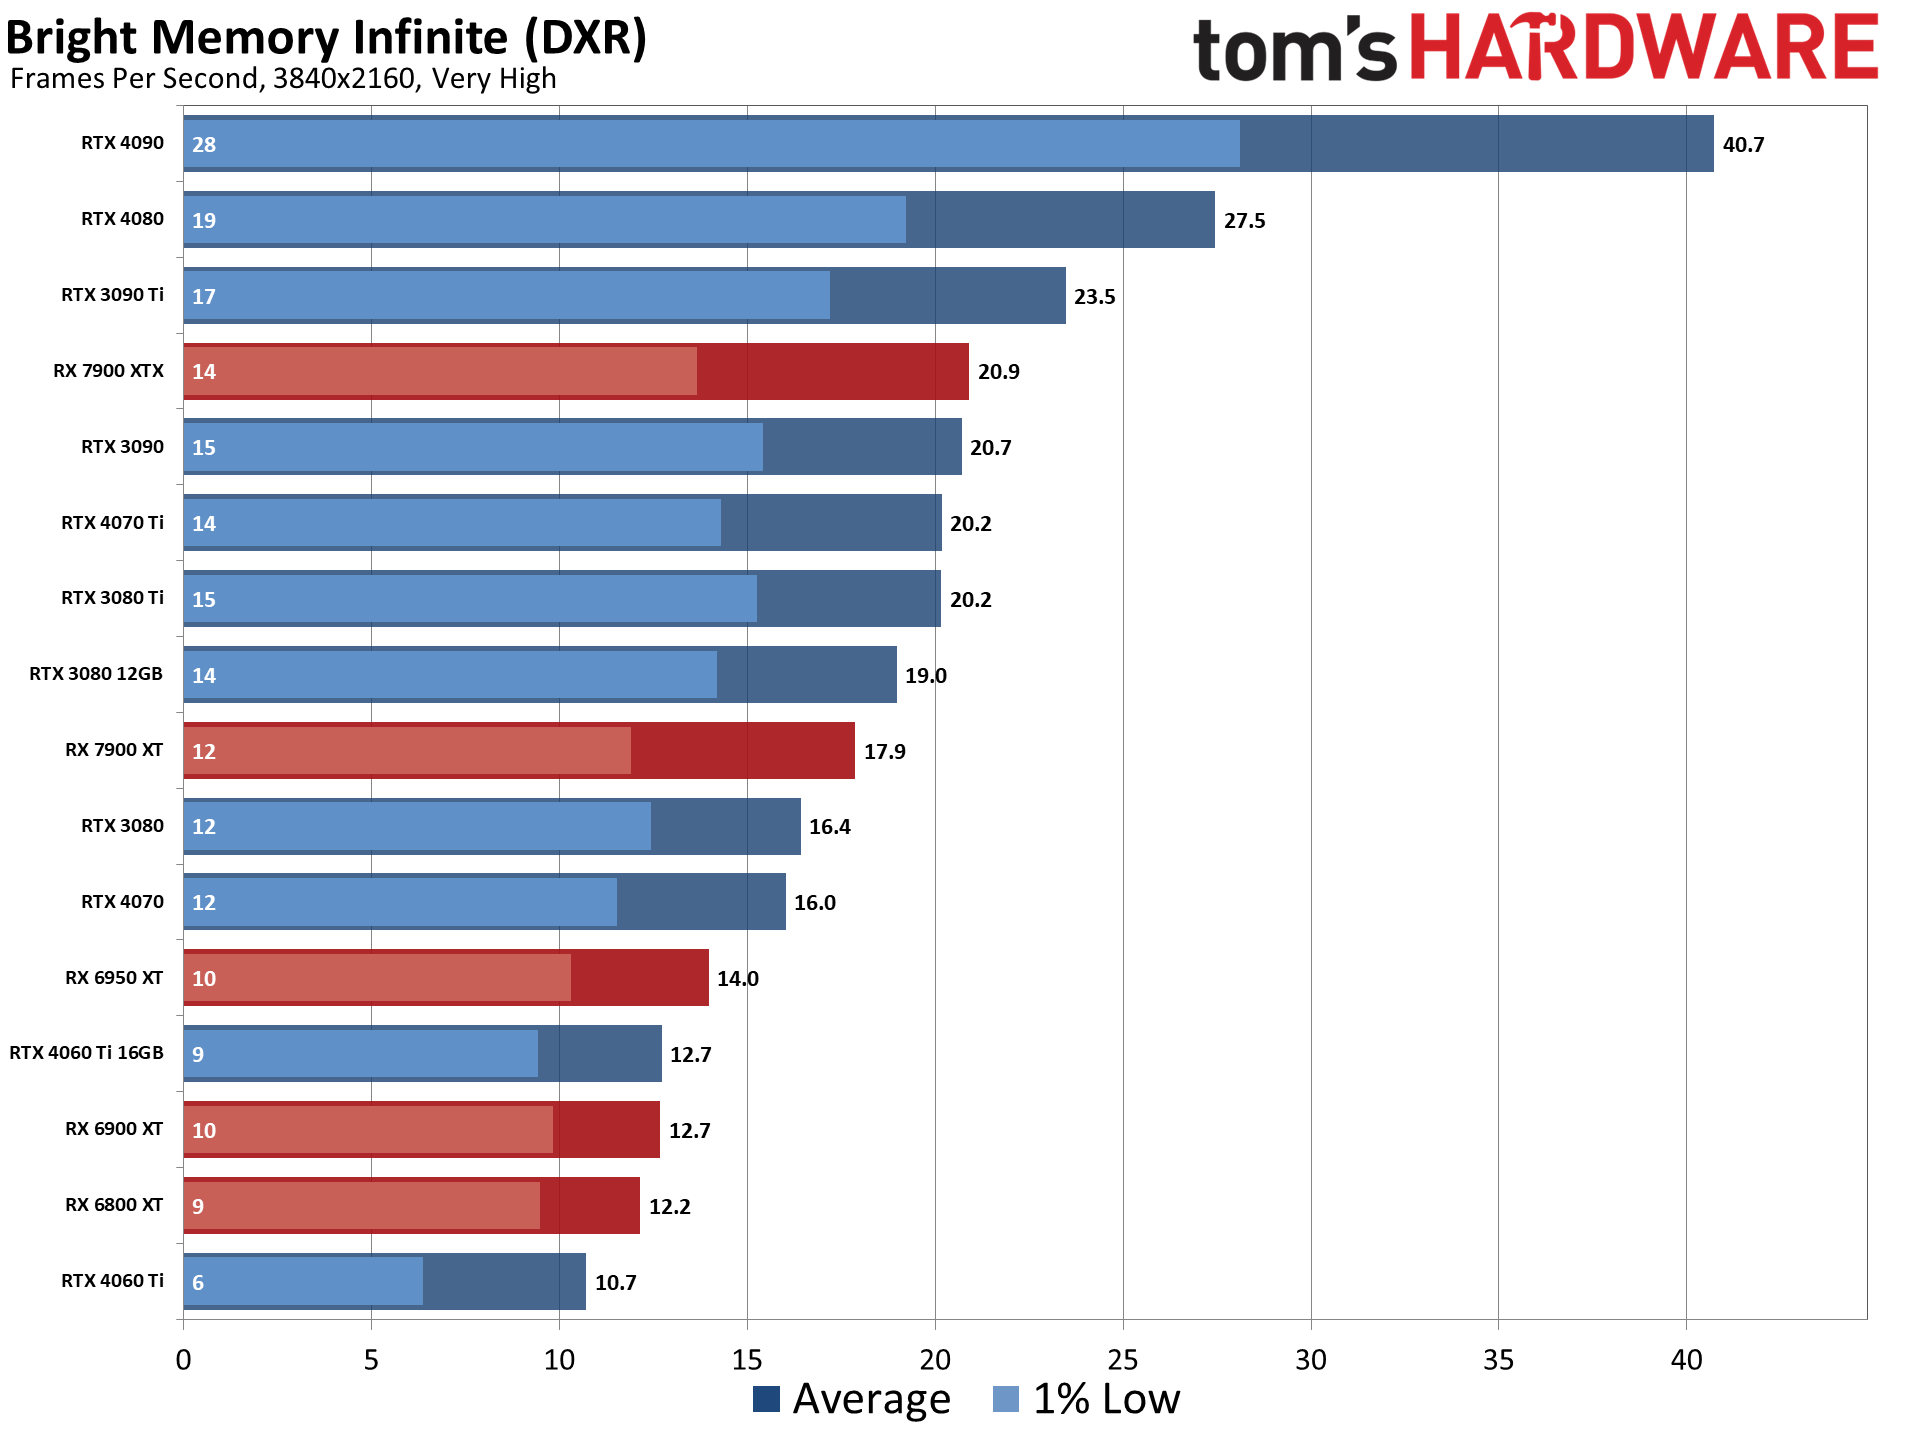
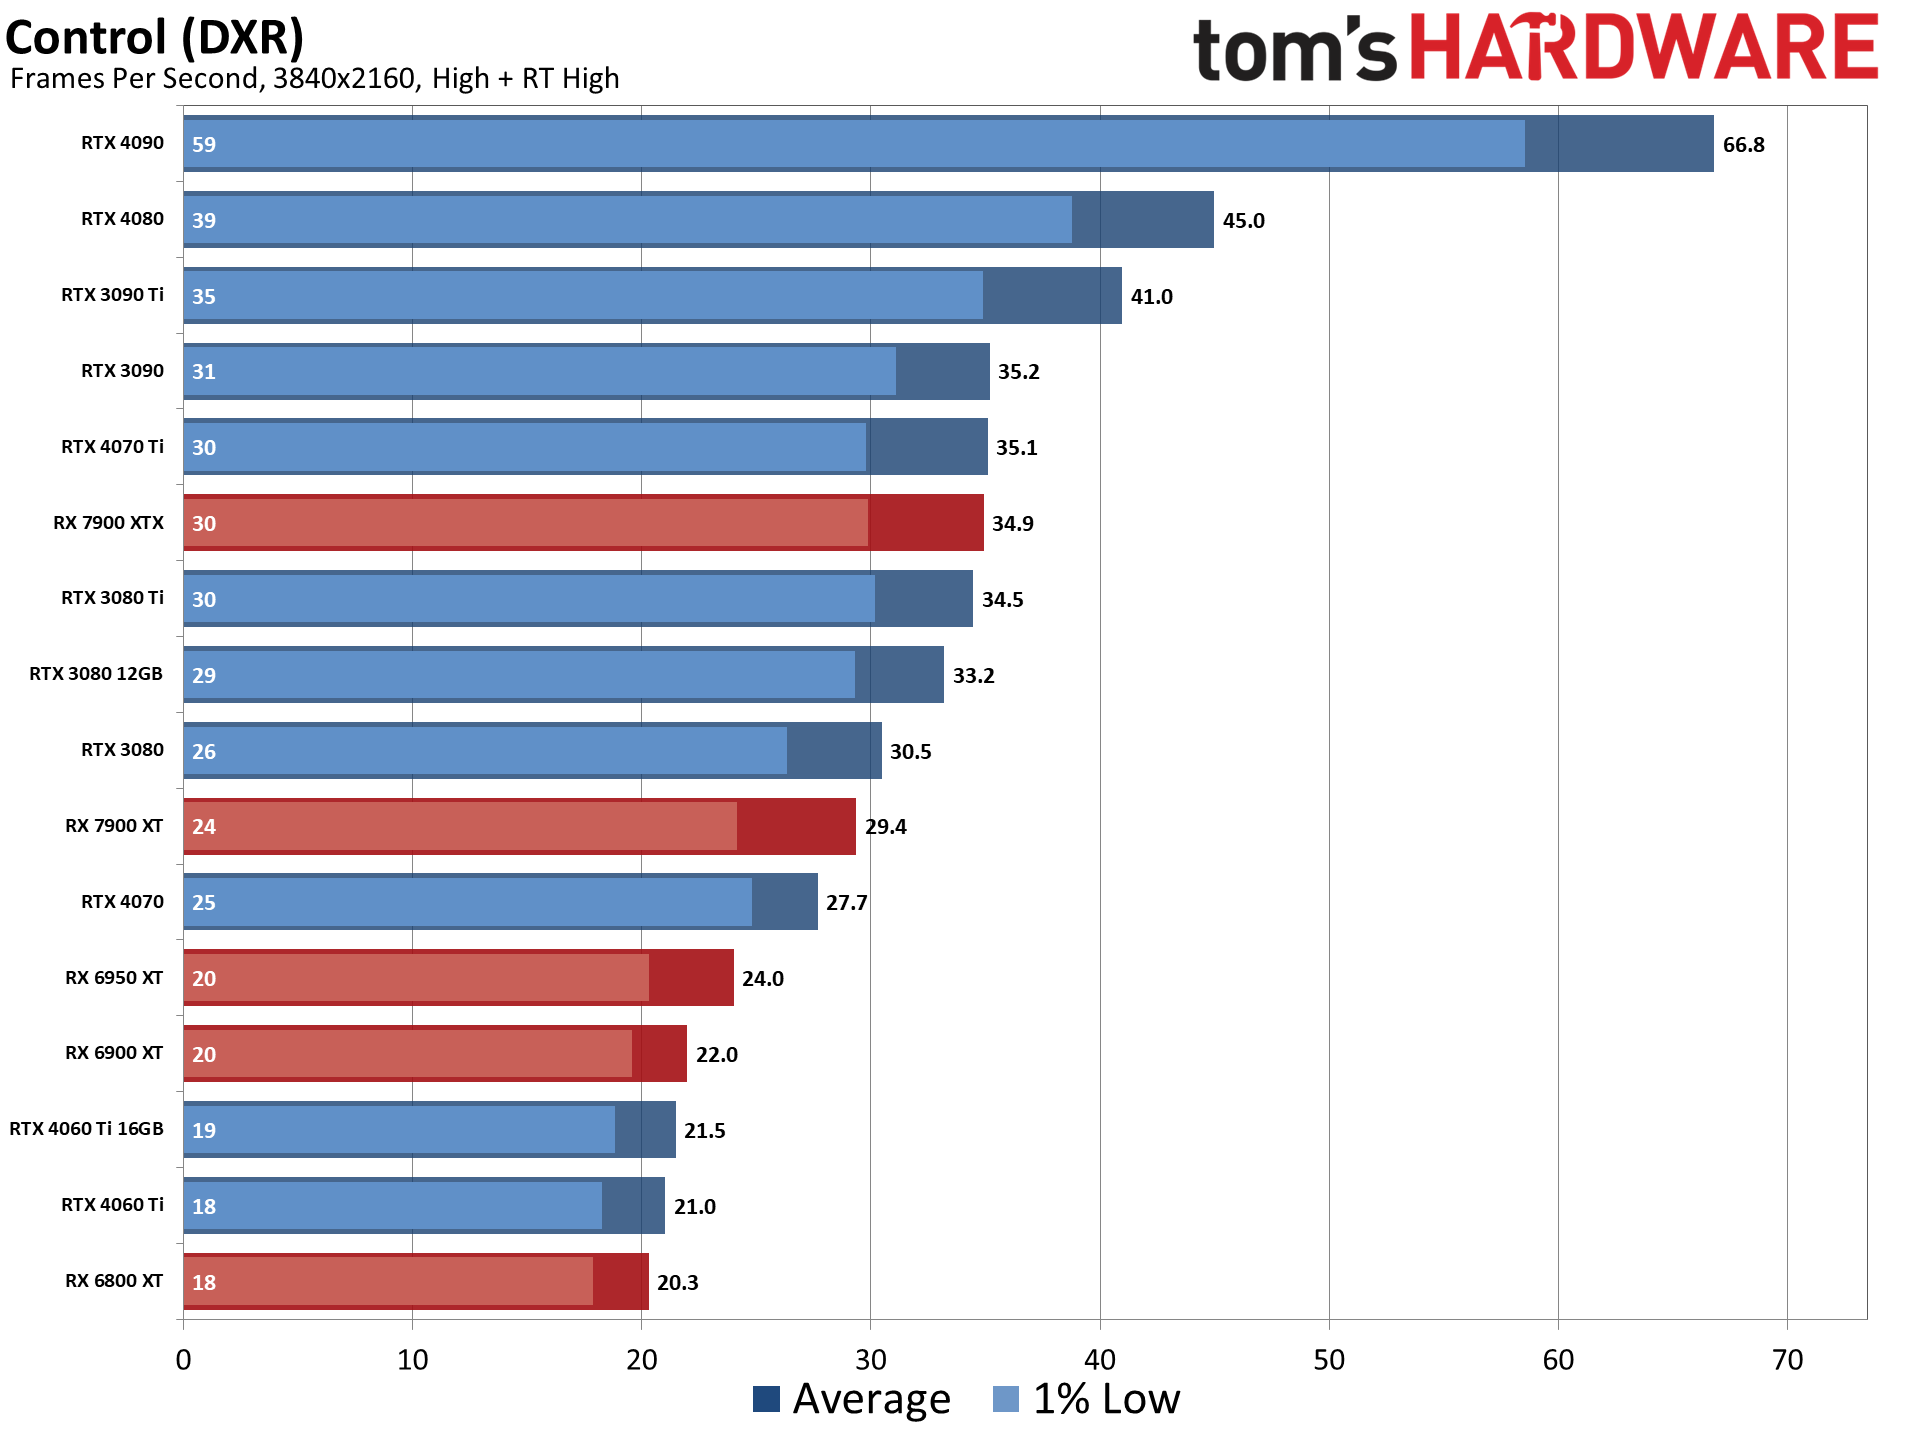
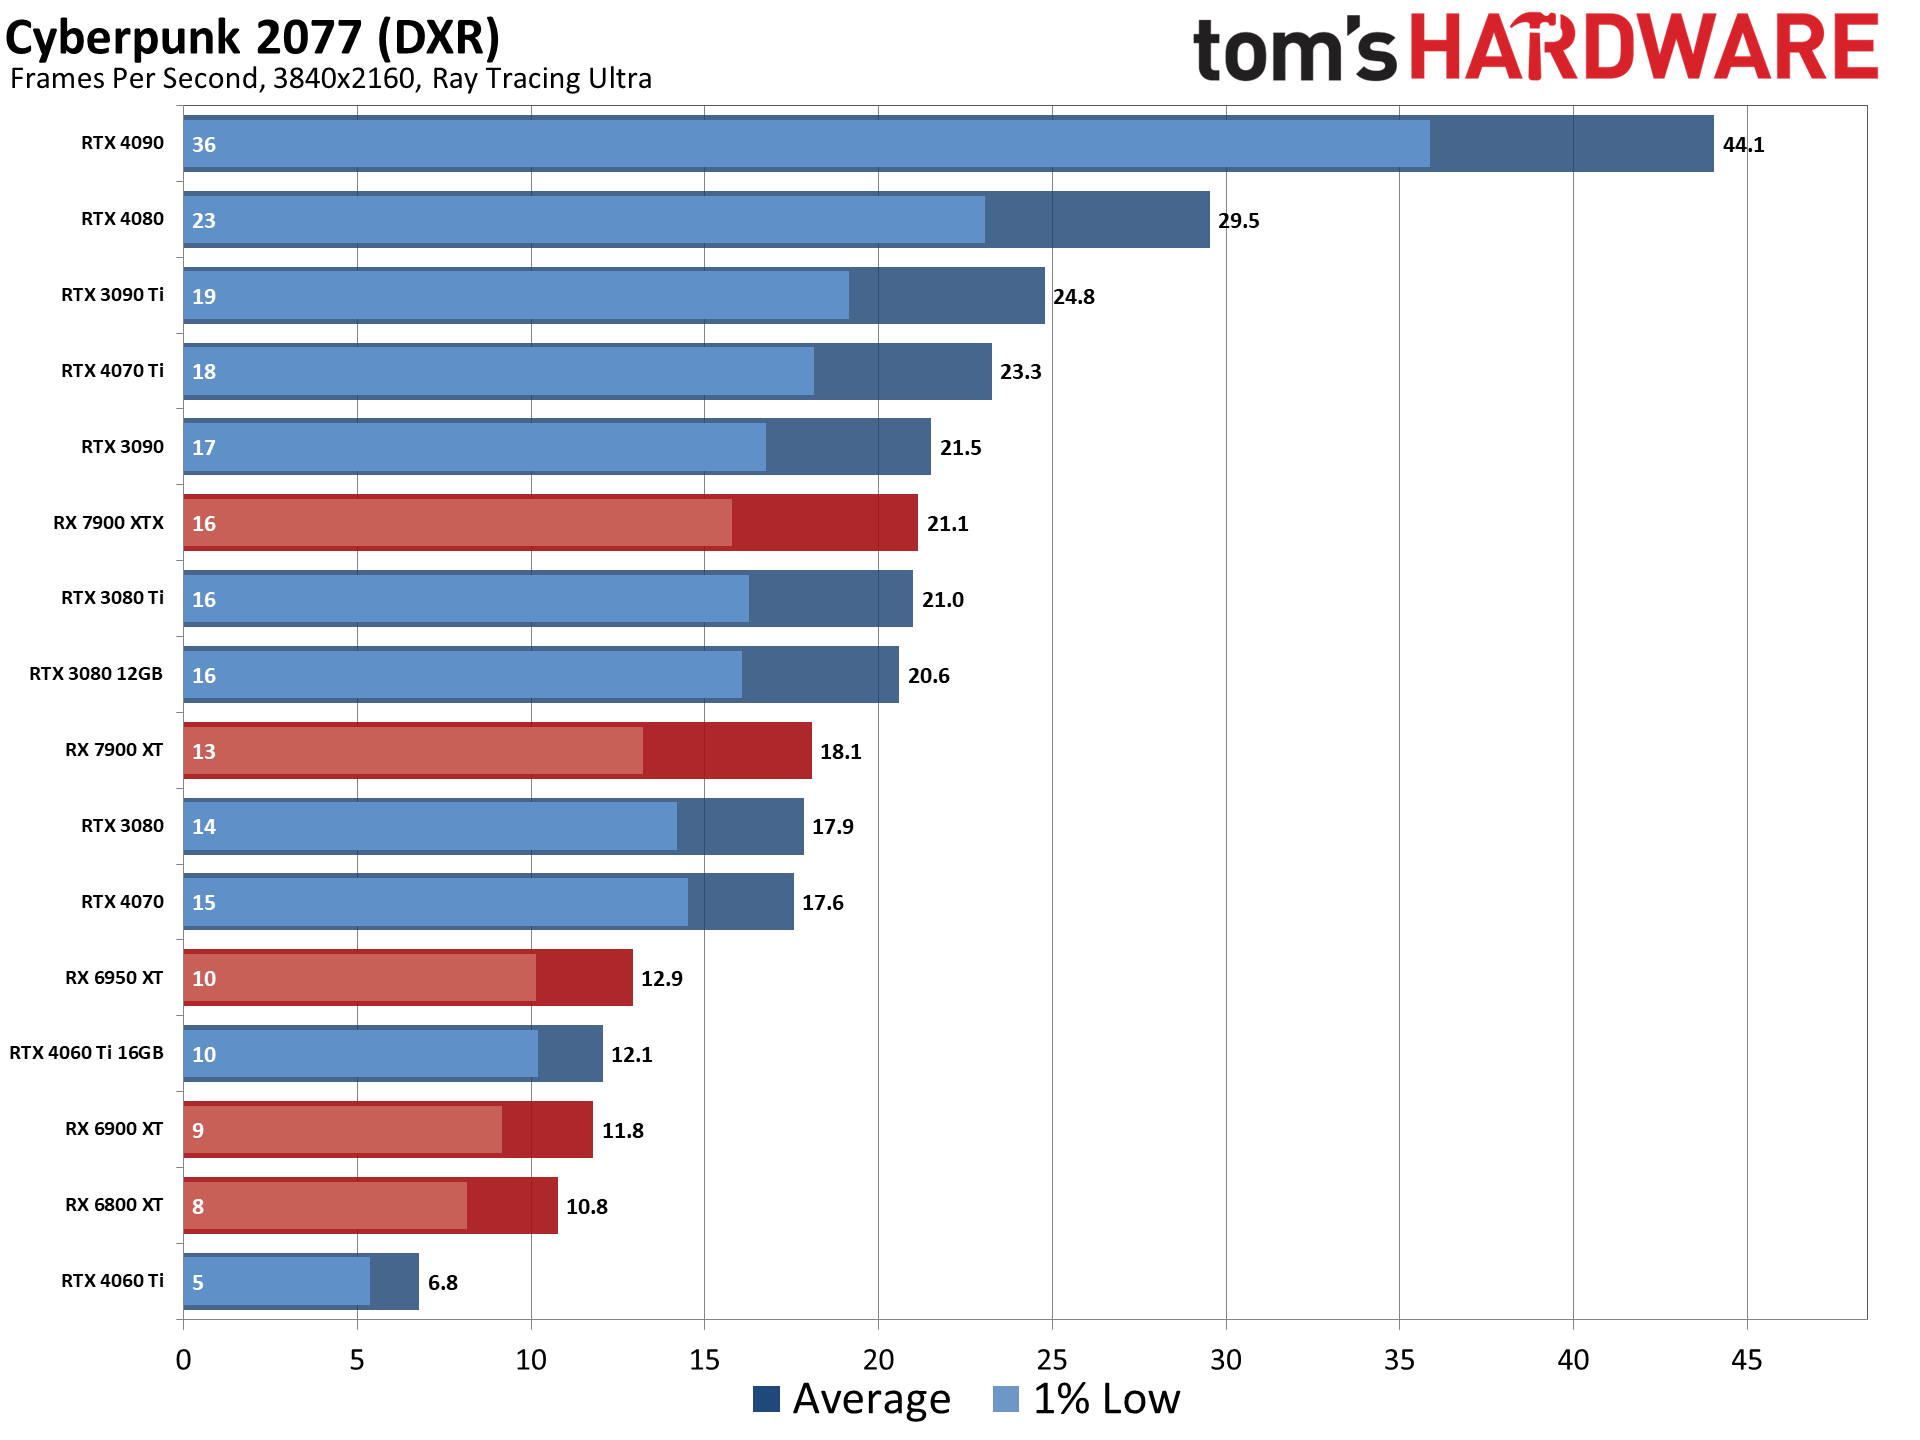
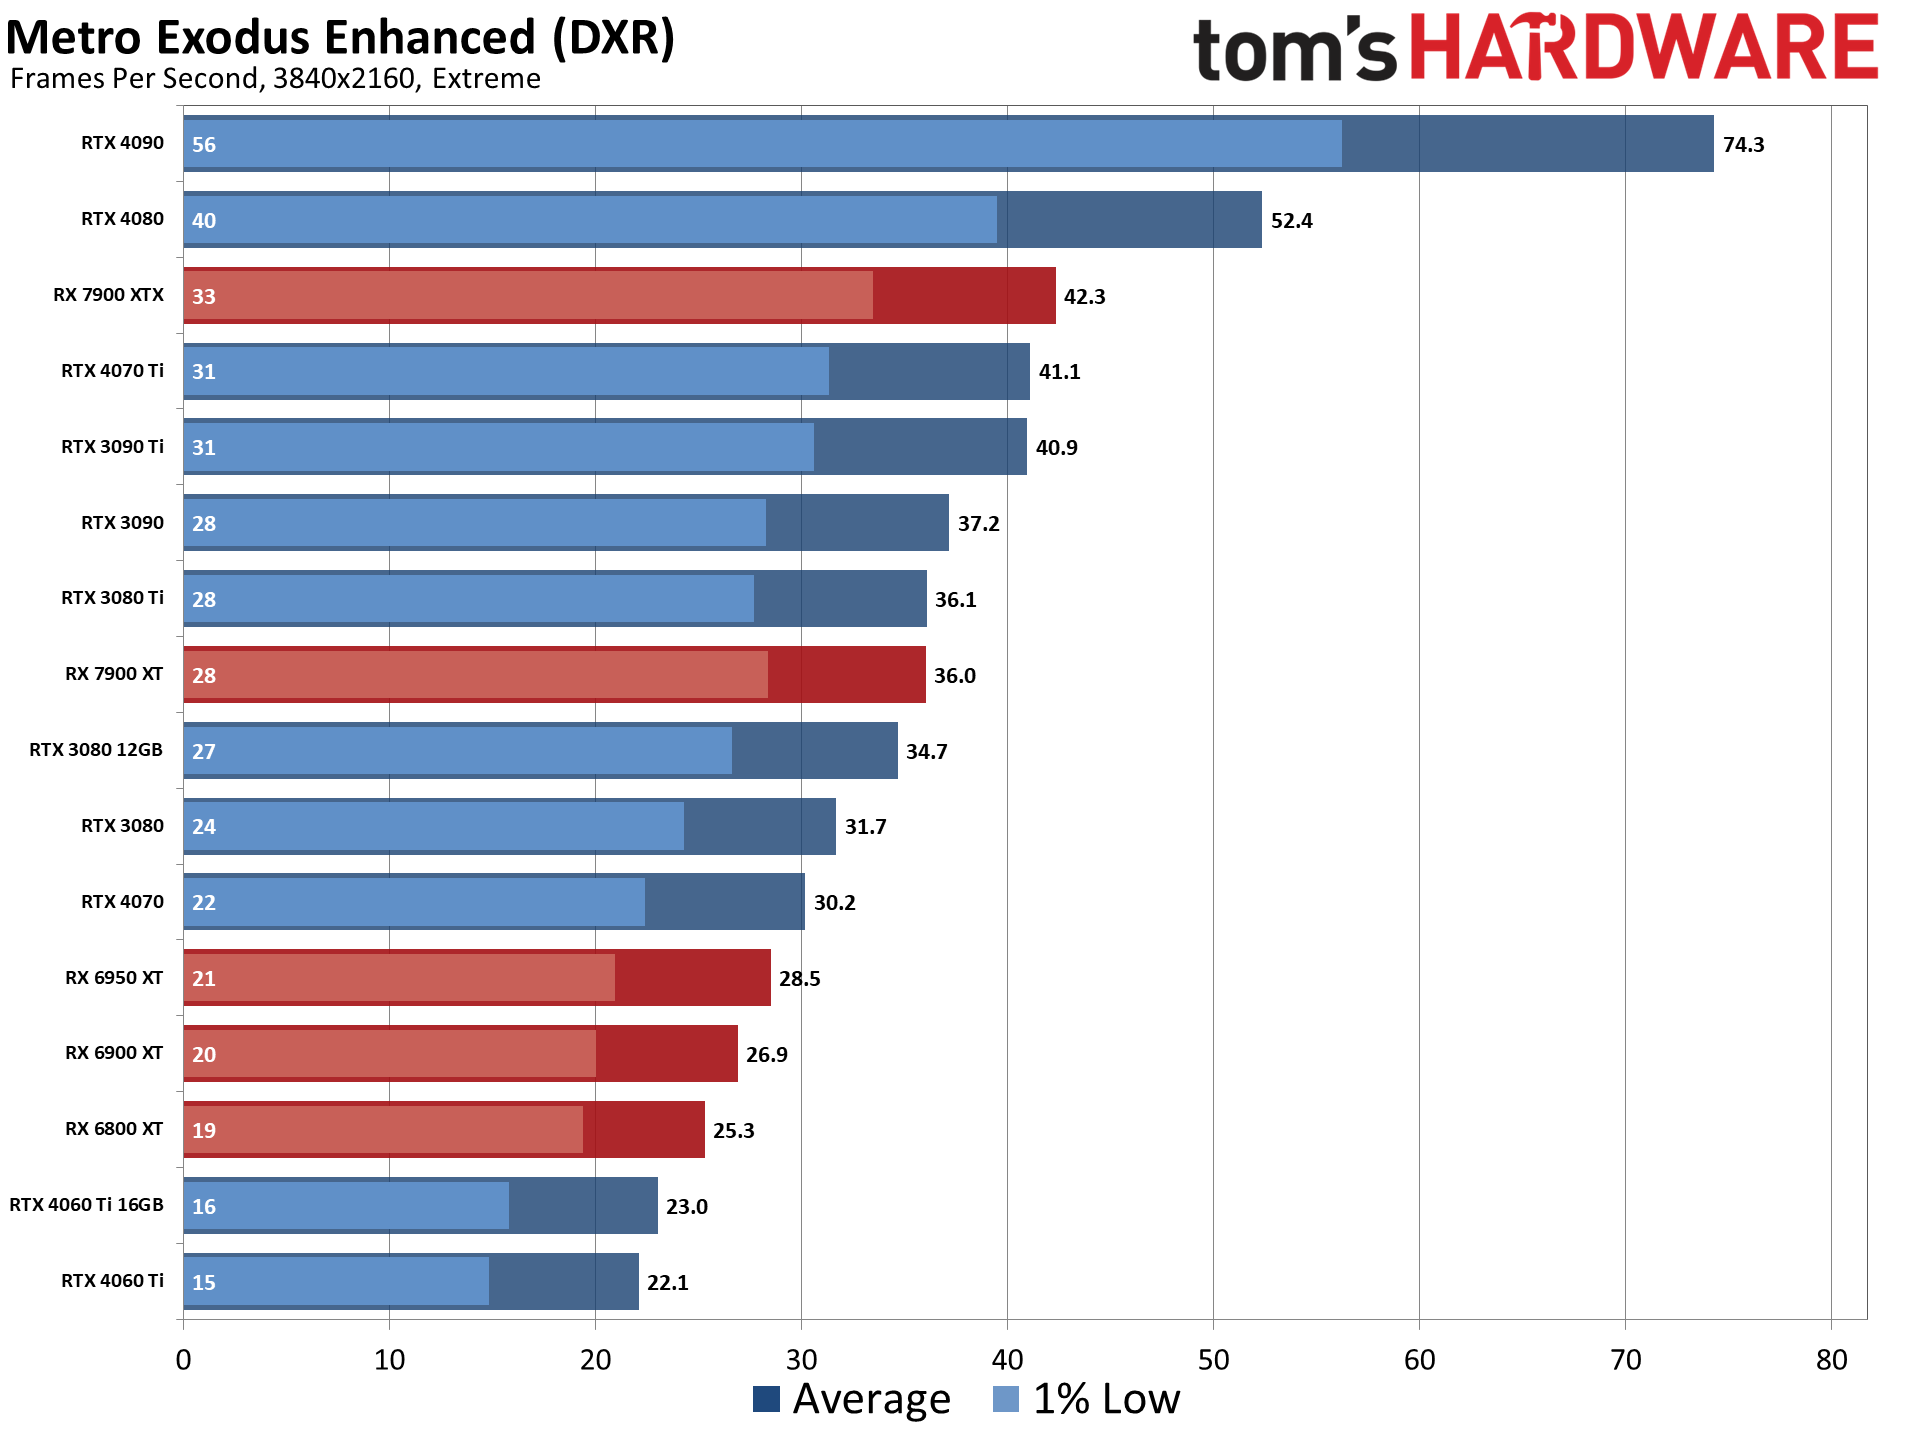
The five ray tracing games we're using are Bright Memory Infinite, Control Ultimate Edition, Cyberpunk 2077, Metro Exodus Enhanced, and Minecraft — all of these use the DirectX 12 / DX12 Ultimate API. The fps score is the geometric mean (equal weighting) of the five games, and the percentage is scaled relative to the fastest GPU in the list, which again is the GeForce RTX 4090.

GPU Ray Tracing Hierarchy, Key Takeaways
- Nvidia absolutely dominates in ray tracing performance, with the RTX 4090 nearly doubling AMD's best AMD RX 7900 XTX in sixth place. Intel's Arc A770 lands at number 27.
- DLSS 2 upscaling with quality mode is supported in most ray tracing games and can boost performance an additional 30~50 percent (depending on the game, resolution, and settings used). FSR 2 and XeSS support can provide a similar uplift, but FSR 2 is only in about a third as many games right now, and XeSS support is even less common.
- You'll need an RTX 4070 or RTX 3080 or faster GPU to handle 1080p with maxed out settings at 60 fps or more, which means Performance mode upscaling can make 4K viable.
- RTX 4080 again ranks as the most efficient GPU, followed by the RTX 4090, RTX 4070, RTX 4070 Ti, RTX 4060 Ti, and RTX 4060. Even the RTX 3060, 3060 Ti, and 3070 rank ahead of AMD's best, which again is the RX 7900 XT. Intel's Arc GPUs are still pretty far down the efficiency list, though in DXR they're often better than AMD's RX 6000-series parts.
- The best overall ray tracing "value" in FPS per dollar goes to the RTX 4060, followed by the Arc A750. Some of Nvidia's 3060/3070 cards are on clearance and also rank higher, though supplies will likely dry up soon. For DXR, AMD's best value is the RX 6700 10GB.
If you felt the RTX 4090 performance was impressive at 4K in our standard test suite, just take a look at the results with ray tracing. Nvidia put even more ray tracing enhancements into the Ada Lovelace architecture, and those start to show up here. There are still further potential performance improvements for ray tracing with SER, OMM, and DMM — not to mention DLSS3, though that ends up being a bit of a mixed bag, since the generated frames don't include new user input and add latency.
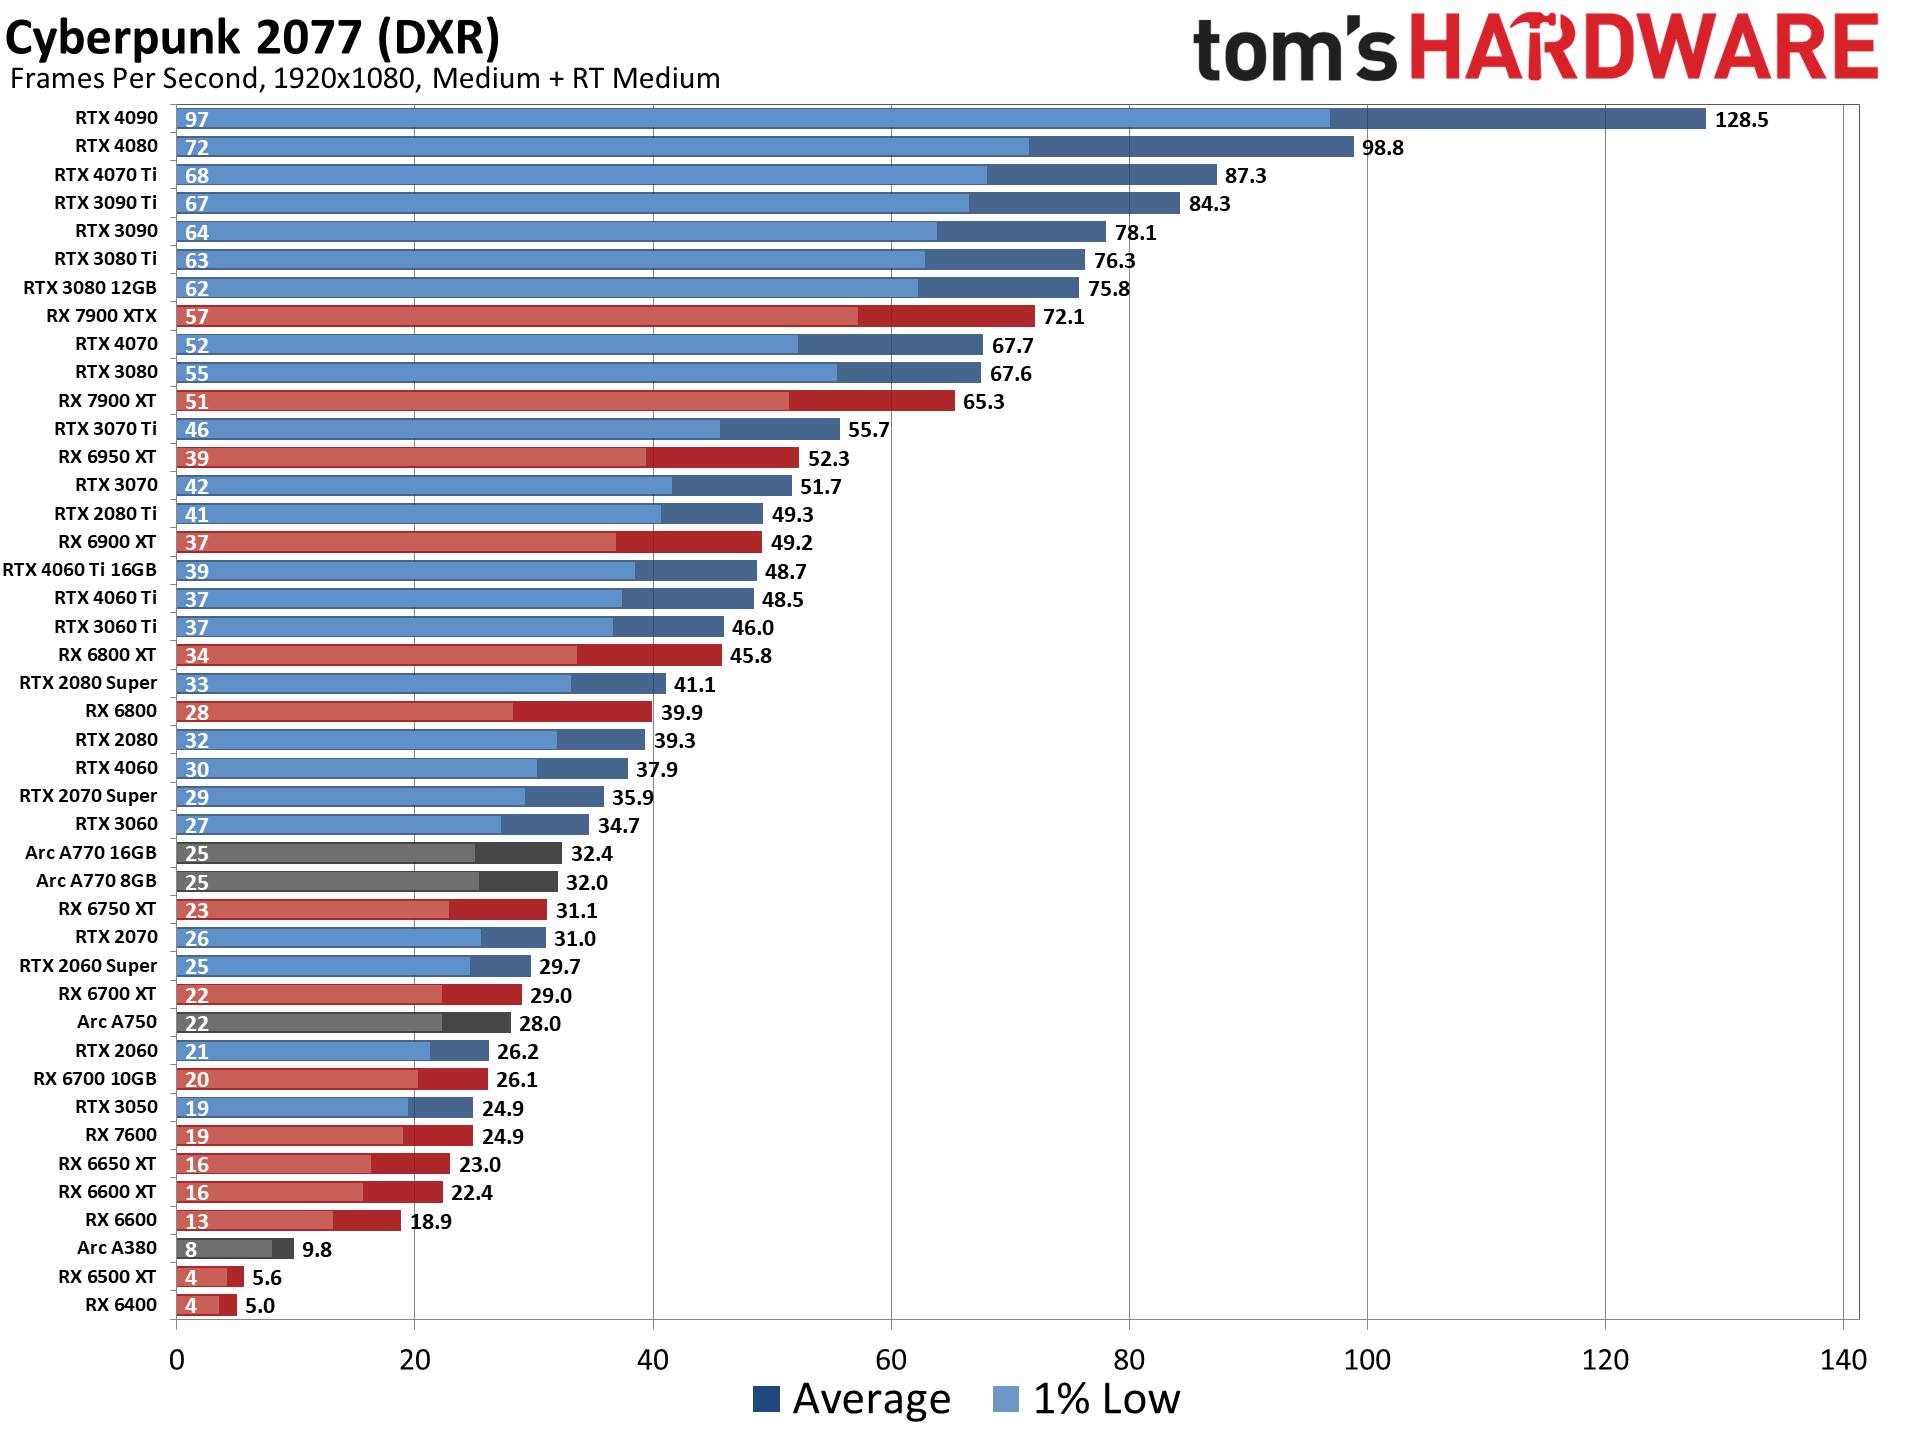
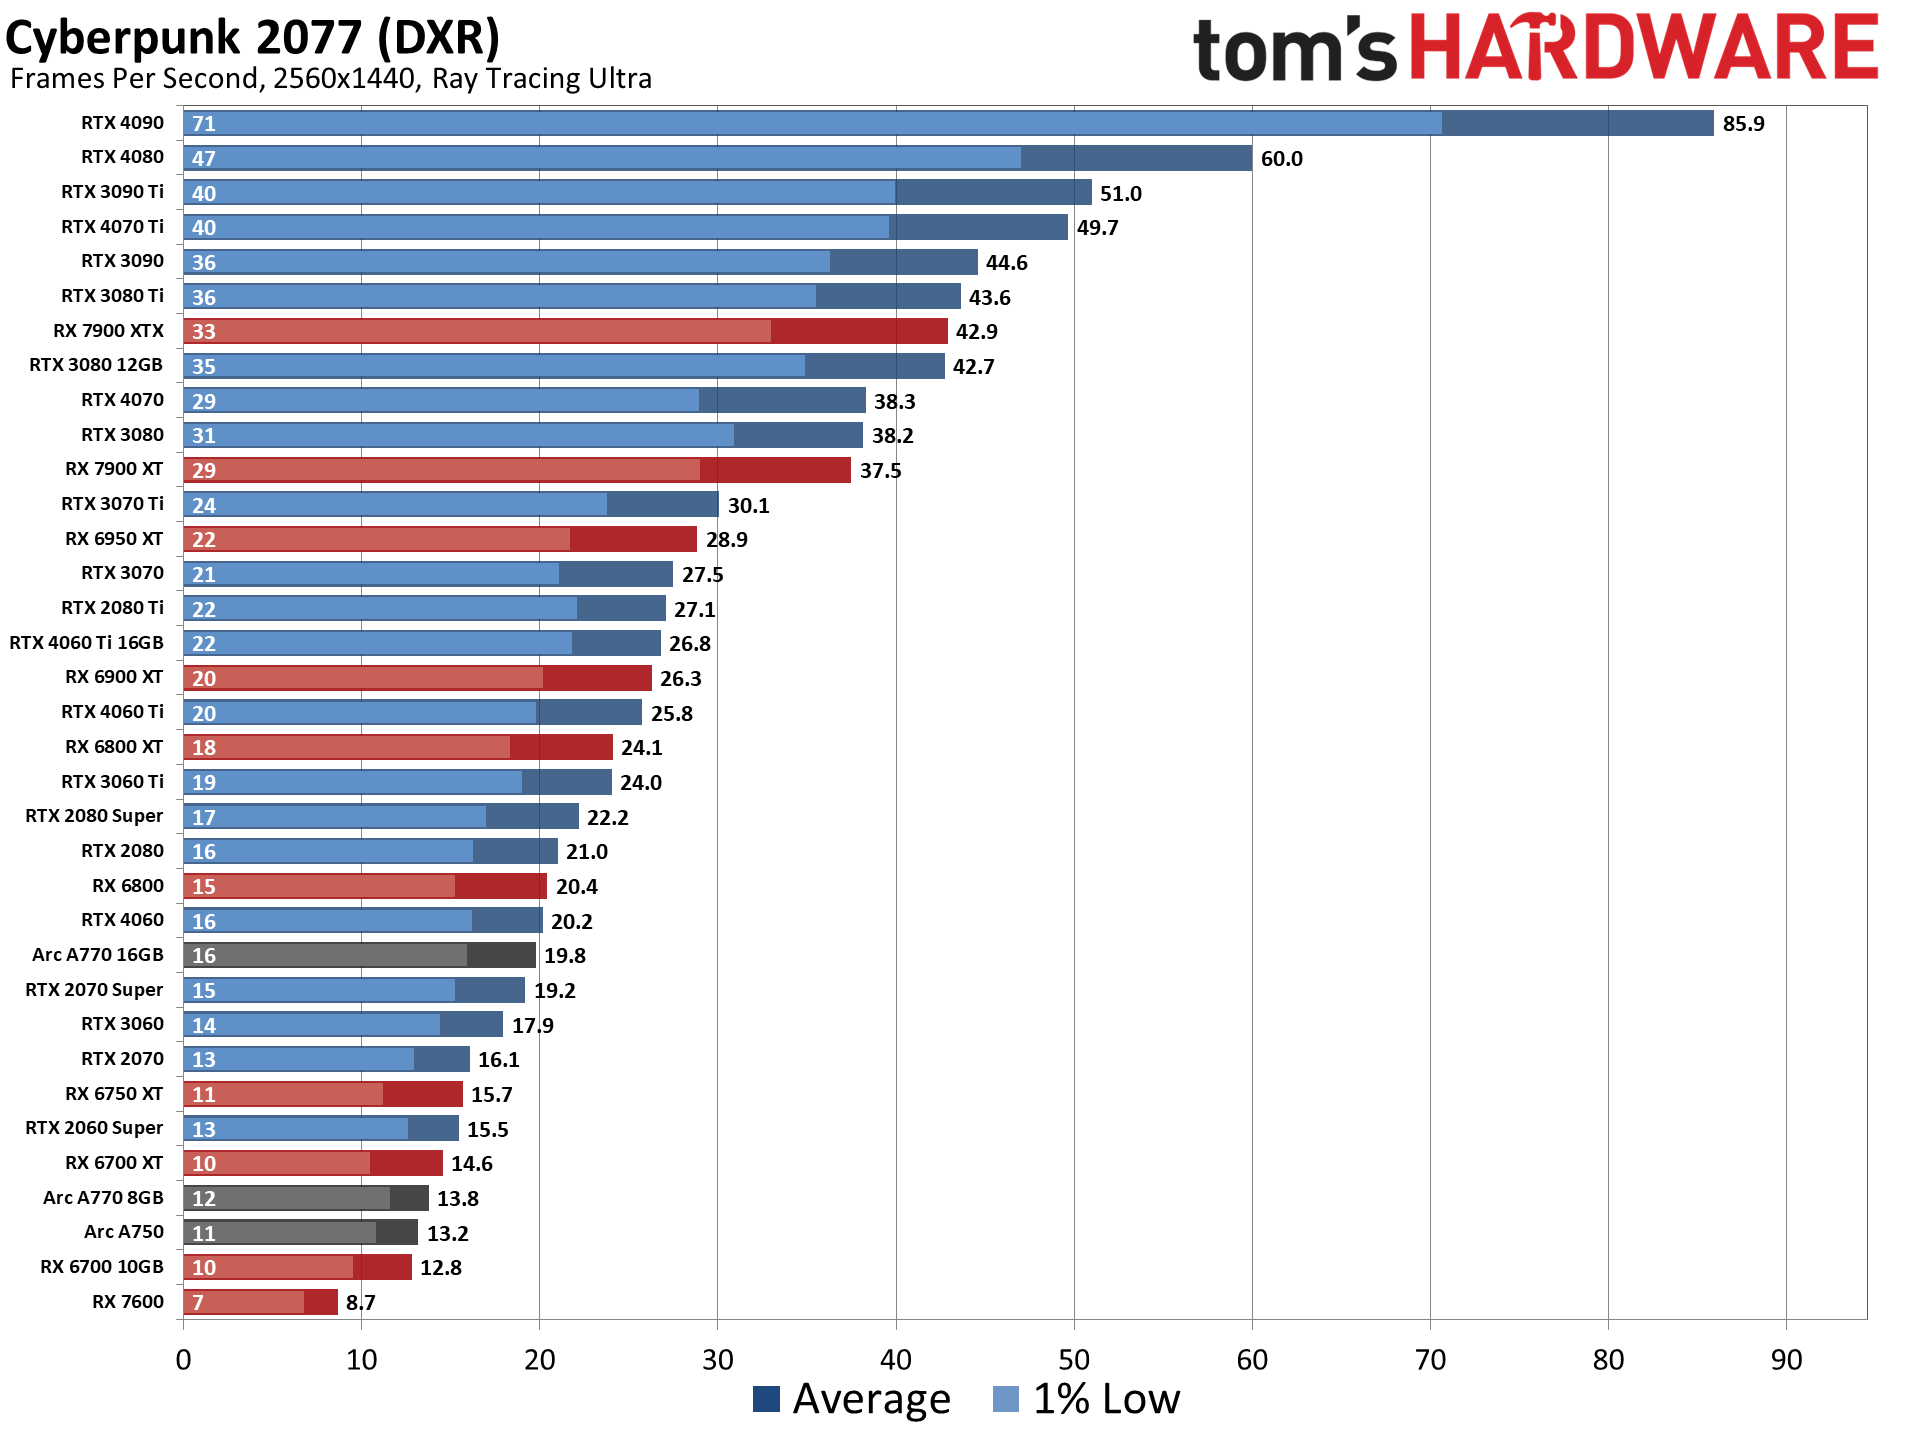
If you want a real kick in the pants, we ran many of the faster ray tracing GPUs through Cyberpunk 2077's RT Overdrive mode, which implements full "path tracing" (full ray tracing, without any rasterization). That provides a glimpse of how future games could behave, and why upscaling and AI techniques like Frame Generation are here to stay.
Even at 1080p medium, a relatively tame setting for DXR (DirectX Raytracing), the RTX 4090 roars past all contenders and leads the previous generation RTX 3090 Ti by 41%. At 1080p ultra, the lead grows to 53%, and it's nearly 64% at 1440p. Nvidia made claims before the RTX 4090 launch that it was "2x to 4x faster than the RTX 3090 Ti" — factoring in DLSS 3's Frame Generation technology — but even without DLSS 3, the 4090 is 72% faster than the 3090 Ti at 4K.
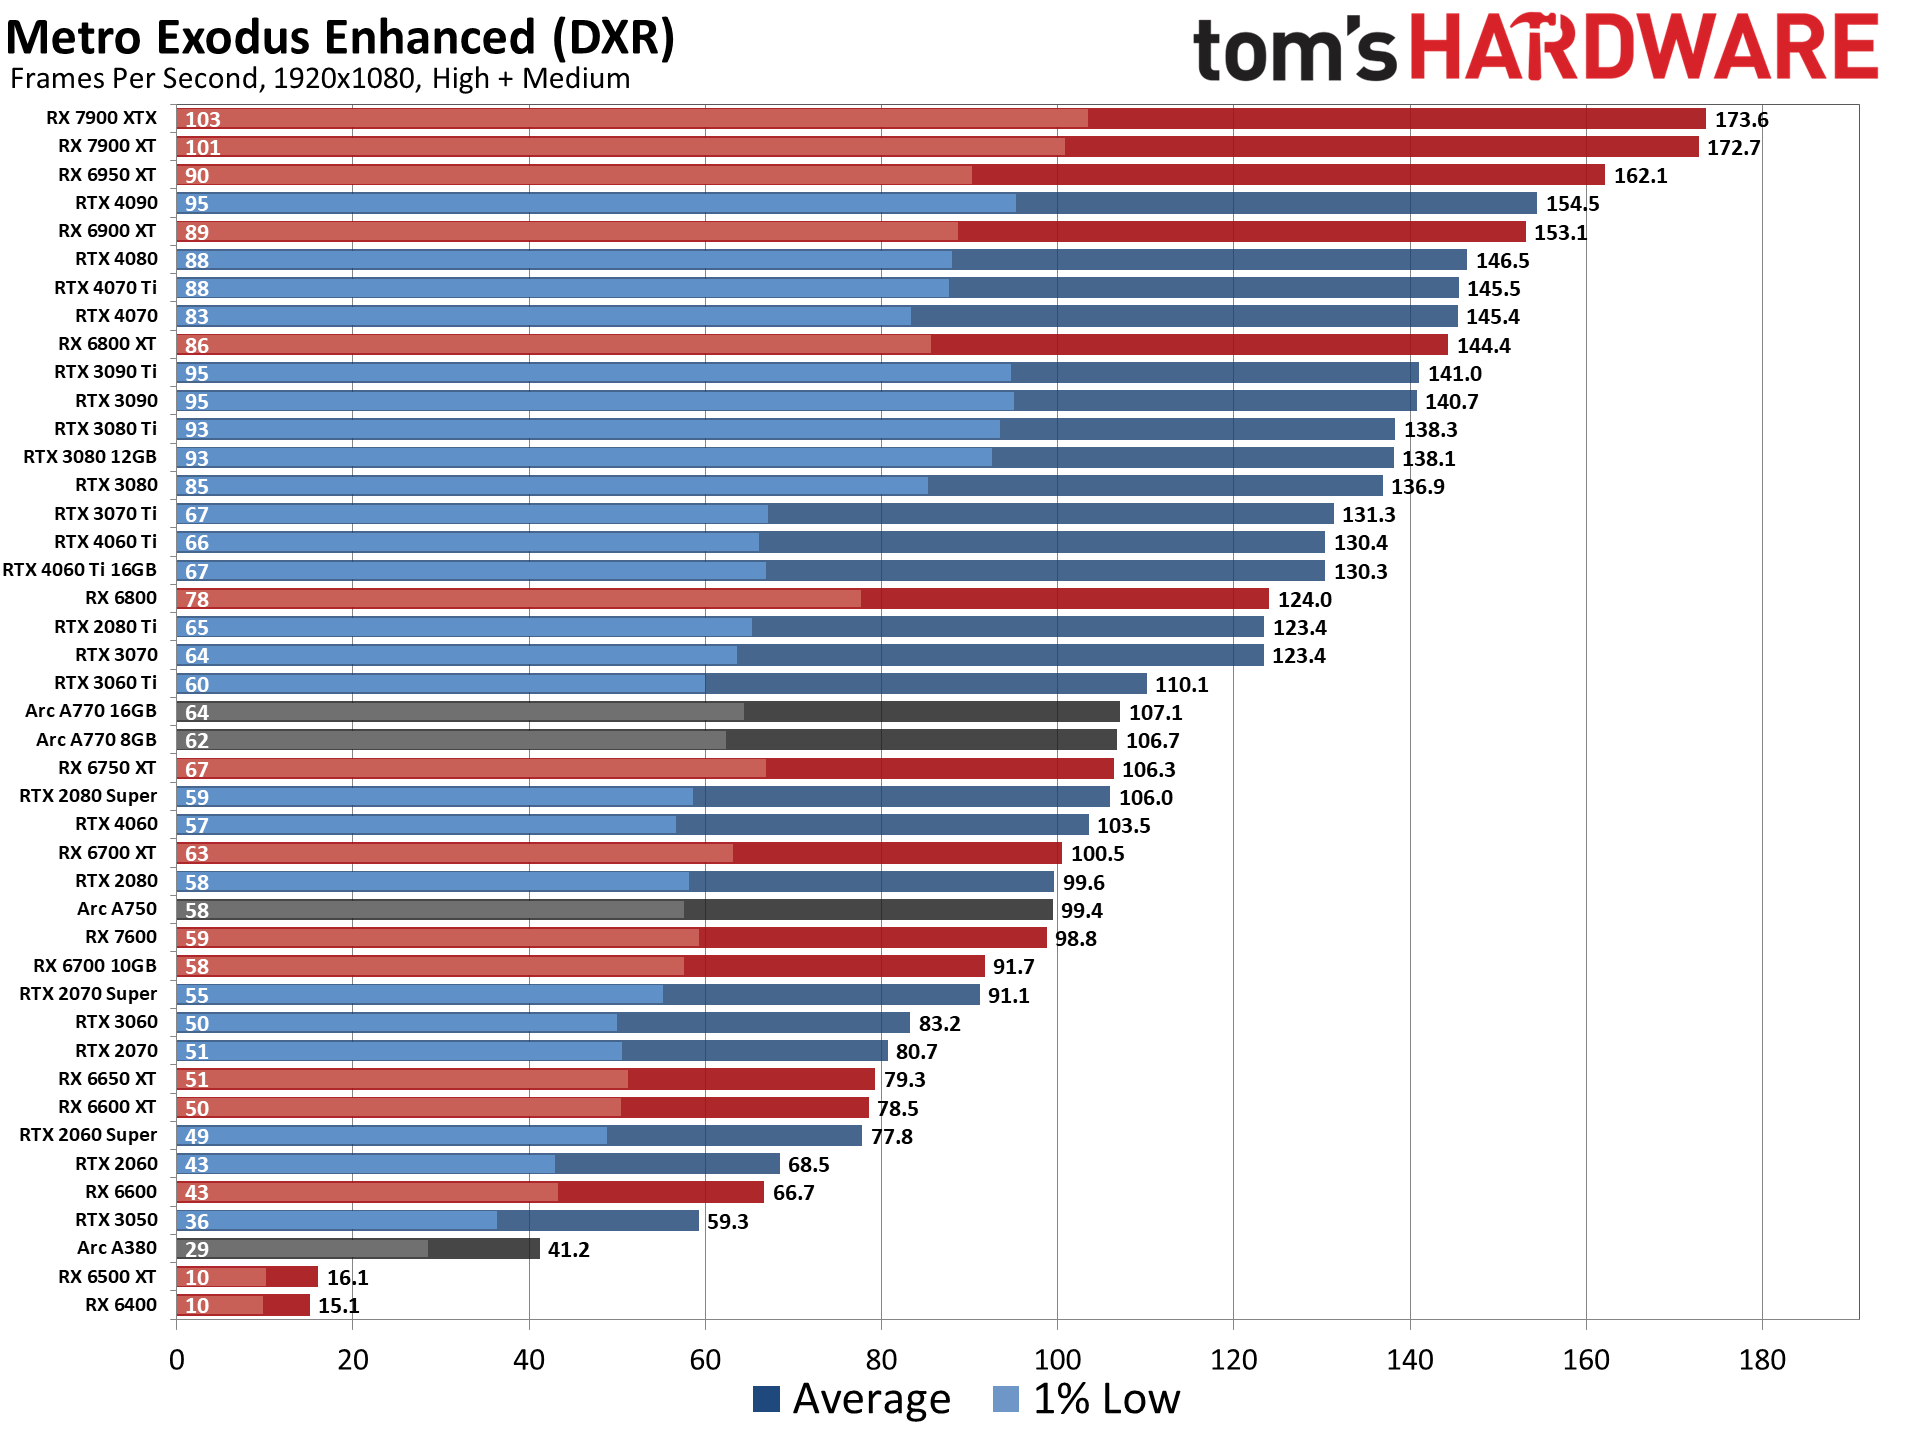
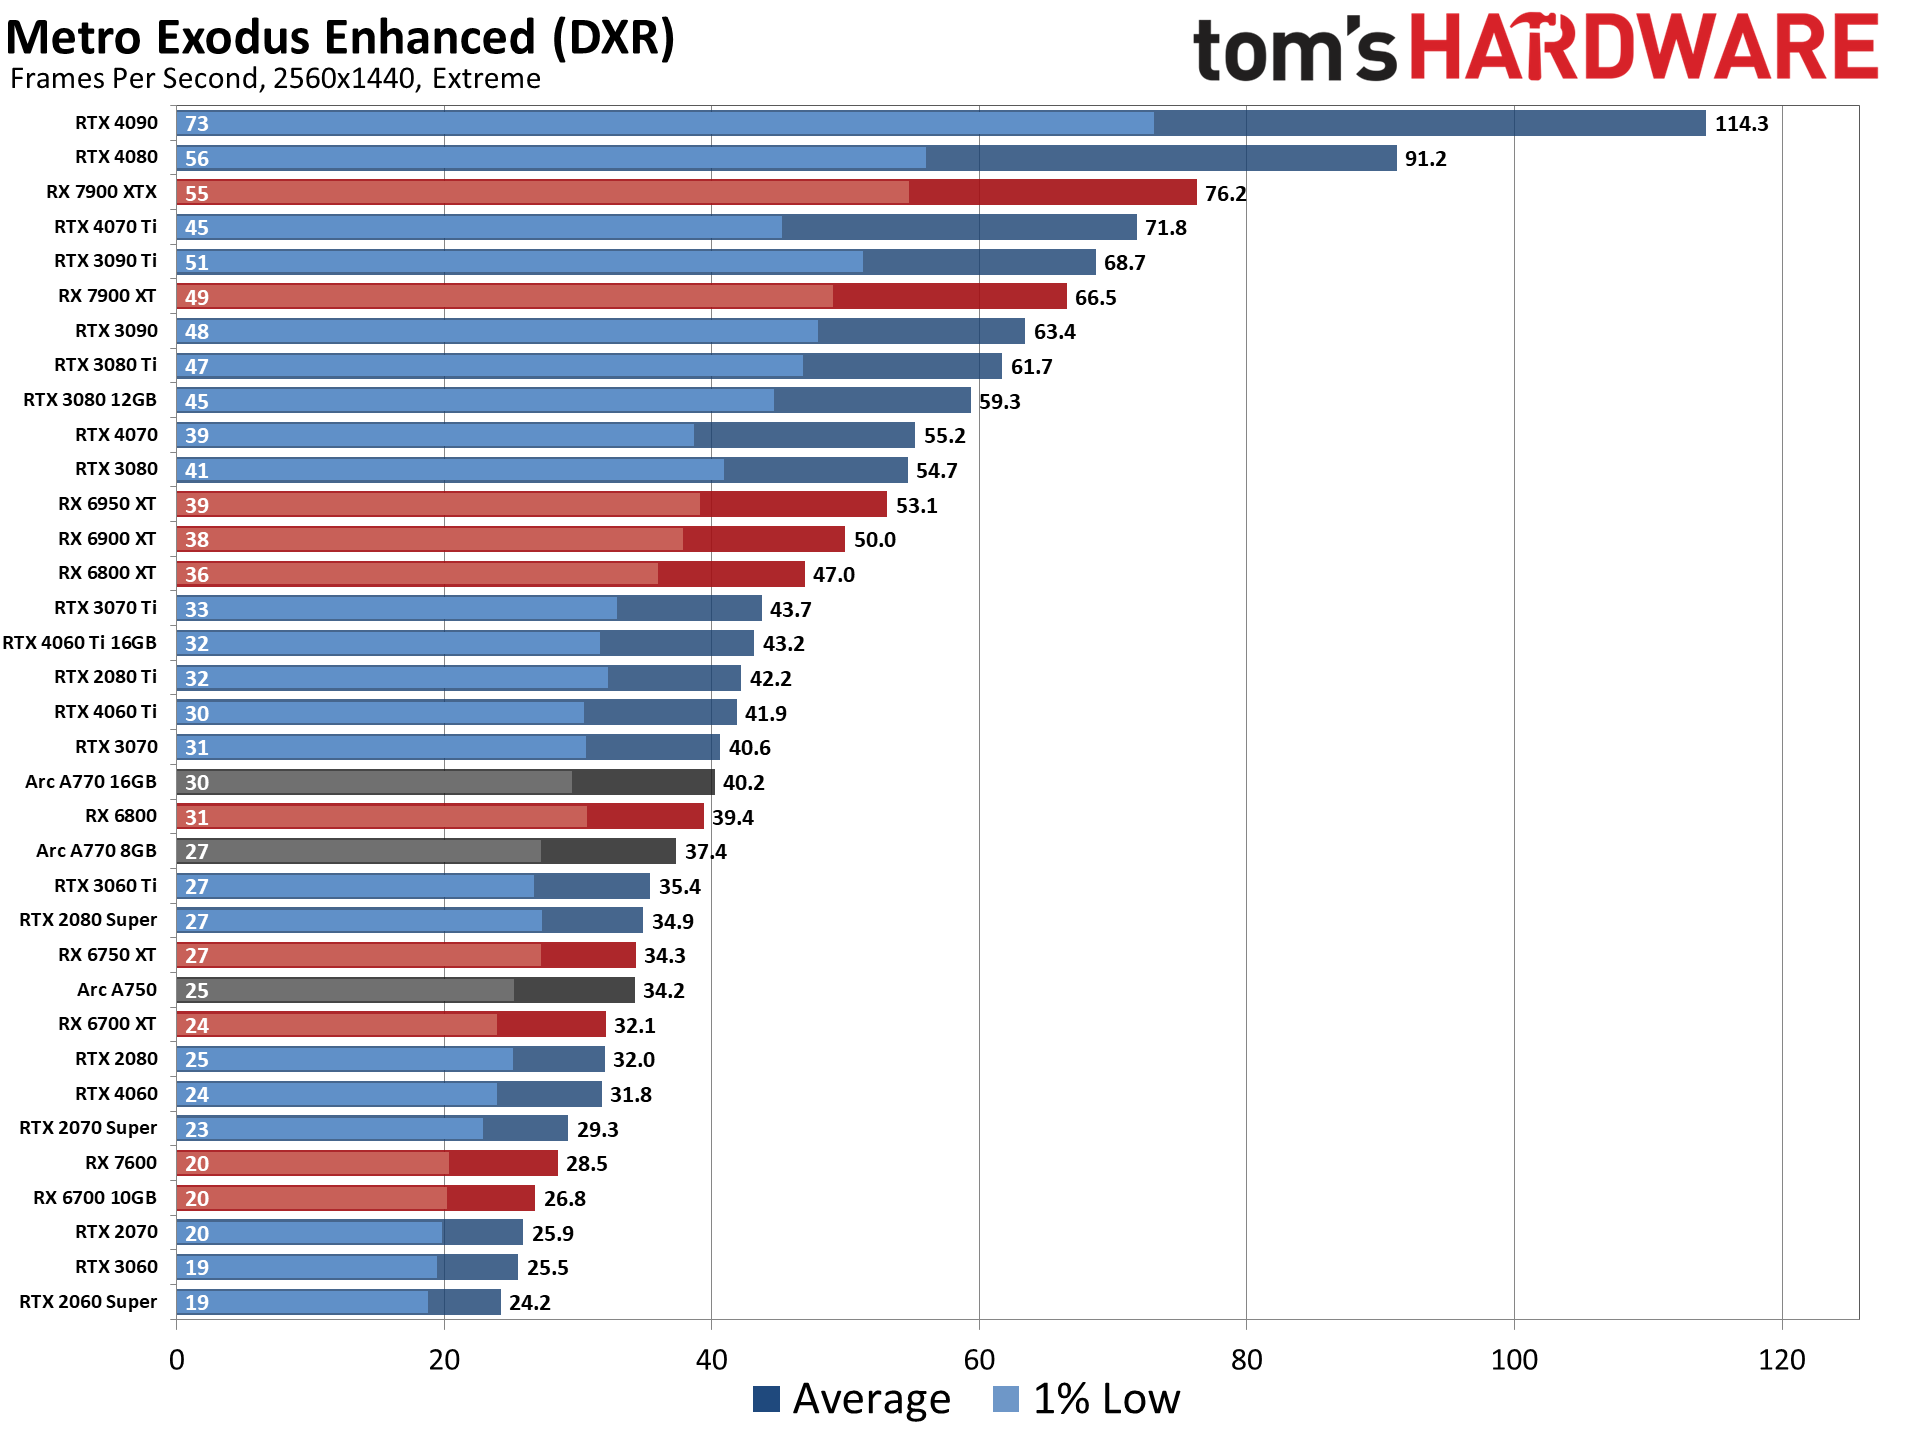
AMD continues to relegate DXR and ray tracing to secondary status, focusing more on improving rasterization performance — and on reducing manufacturing costs through the use of chiplets on the new RDNA 3 GPUs. As such, the ray tracing performance from AMD isn't particularly impressive. The new RX 7900 XTX basically matches Nvidia's previous generation RTX 3080 Ti, which puts it just a bit behind the RTX 3090 — and Nvidia's 4070 Ti outpaces it by 7–9 percent on average across our test suite. The step down RX 7900 XT meanwhile lands around the level of the RTX 4070.
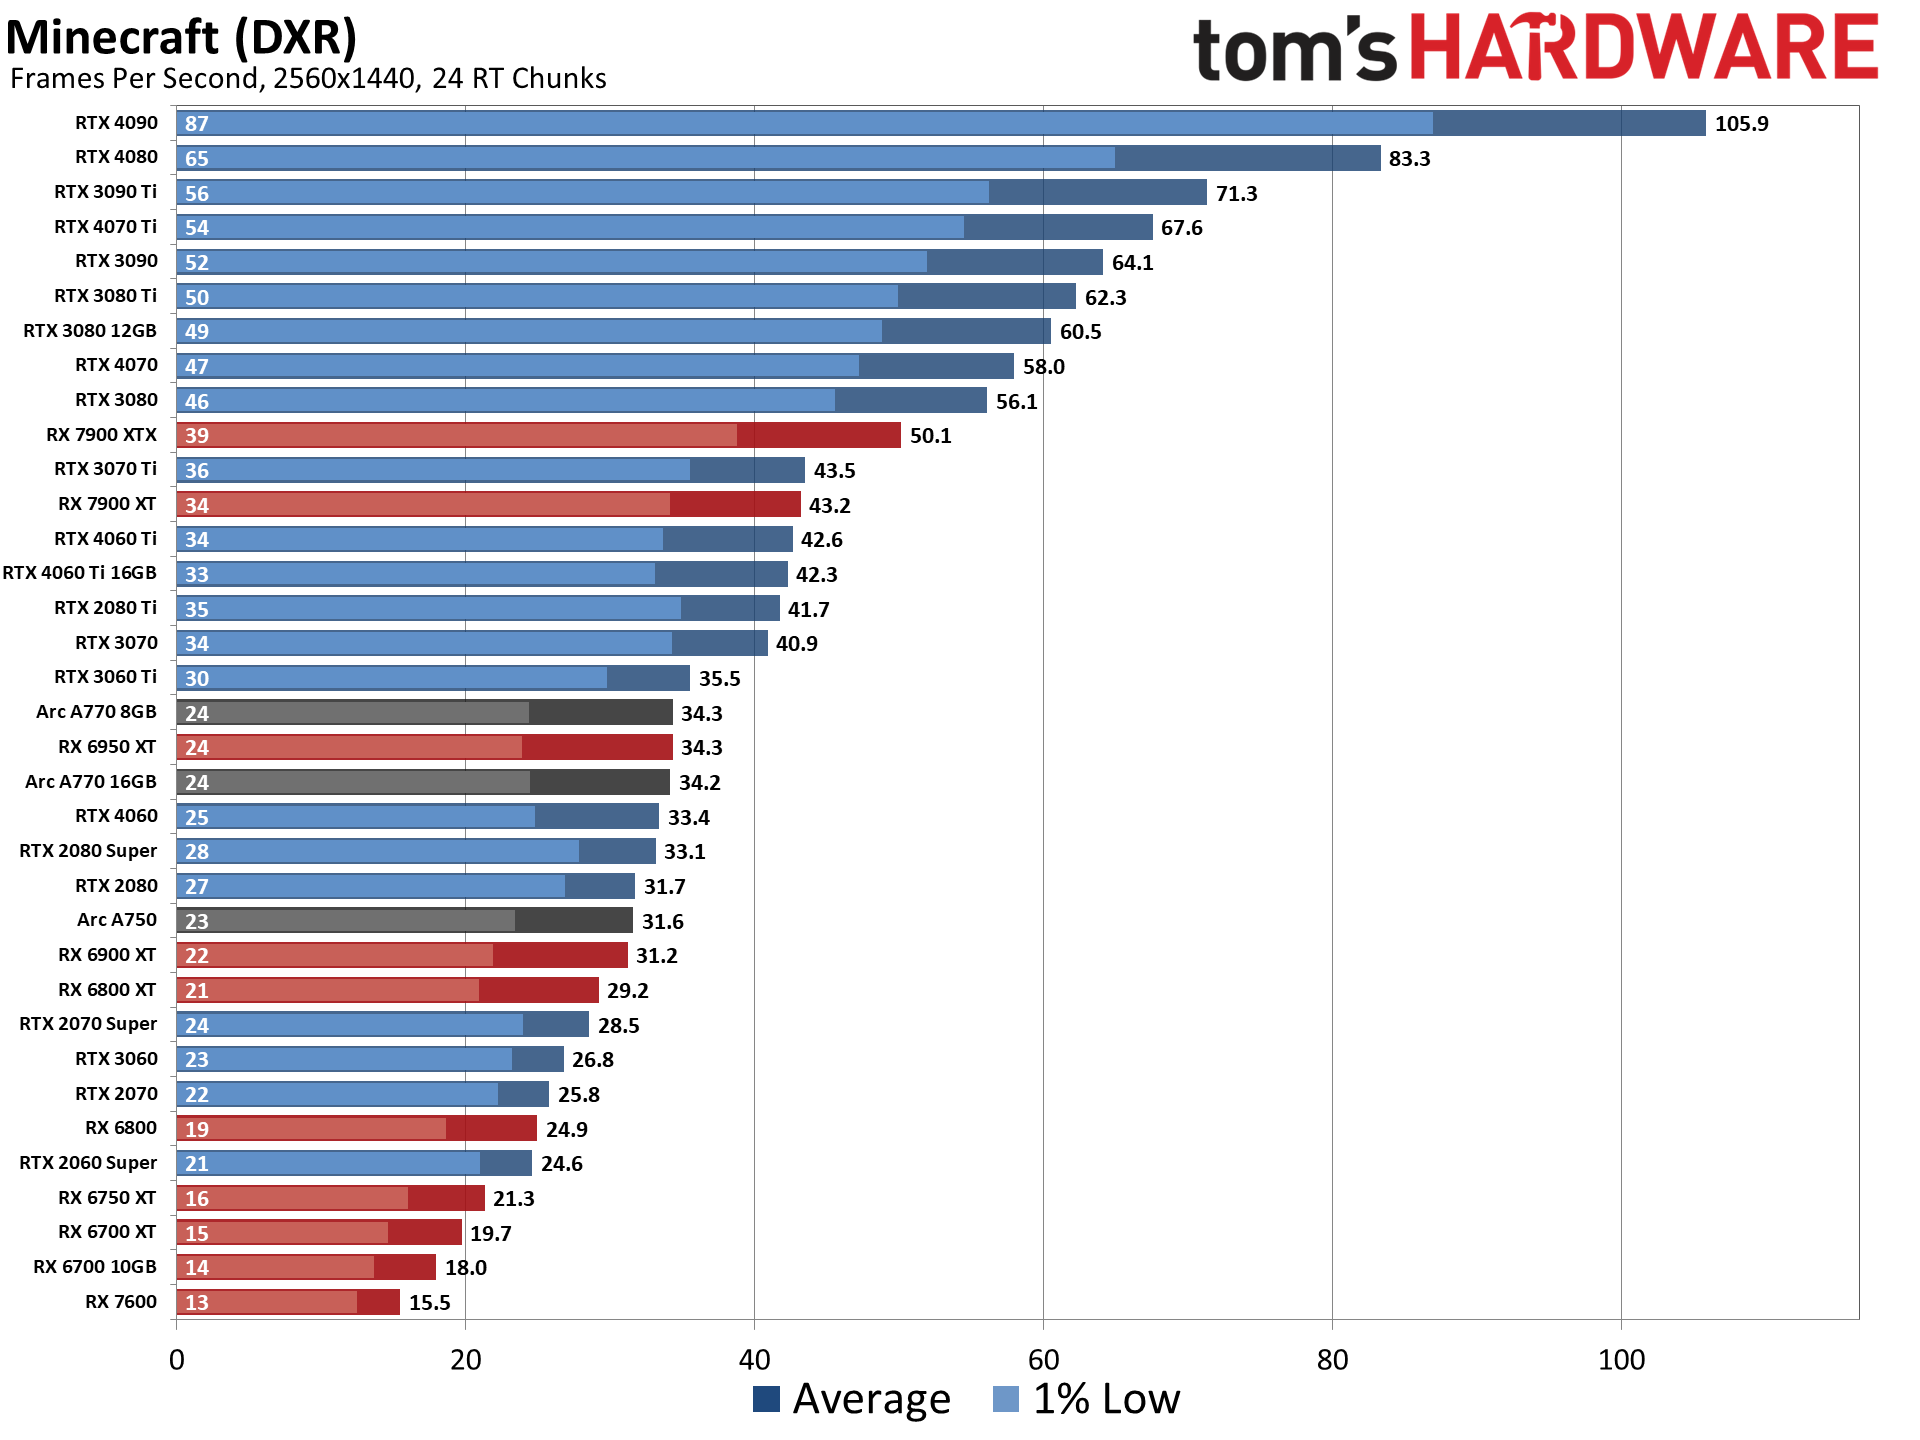
Intel's Arc A7-series parts show a decent blend of performance in general, with the A750 coming in ahead of the RTX 3060 overall. With the latest drivers (and with vsync forced off in the options.txt file), Minecraft performance also looks much more in line with the other Arc DXR results.
You can also see what DLSS Quality mode did for performance in DXR games on the RTX 4090 in our review, but the short summary is that it boosted performance by 78% at 4K ultra. DLSS 3 meanwhile improved framerates another 30% to 100% in our preview testing, though we recommend exercising caution when looking at FPS with Frame Generation enabled. It can dramatically boost frame rates in benchmarks, but when actually playing games it often doesn't feel much faster than without the feature. Overall, with DLSS 2, the 4090 in our ray tracing test suite is nearly four times as fast as AMD's RX 7900 XTX. Ouch.
AMD's FSR 2.0 would prove beneficial here, if AMD can get widespread adoption, but it still trails DLSS. Right now, only one of the games in our DXR suite (Cyberpunk 2077) has FSR2 support, while three more from our rasterization suite support FSR2. By comparison, all of the DXR games we're testing support DLSS2, plus another five from our rasterization suite — and three of the games even support DLSS3.
Without FSR2, AMD's fastest GPUs can only clear 60 fps at 1080p ultra, while remaining decently playable at 1440p with 40–50 fps on average. But native 4K DXR remains out of reach for just about every GPU, with only the 3090 Ti, 4080, and 4090 breaking the 30 fps mark on the composite score — and a couple of games still come up short on the 4080 and 3090 Ti.
The midrange GPUs like the RTX 3070 and RX 6700 XT basically manage 1080p ultra and not much more, while the bottom tier of DXR-capable GPUs barely manage 1080p medium — and the RX 6500 XT can't even do that, with single digit framerates in most of our test suite, and one game that wouldn't even work at our chosen "medium" settings. (Control requires at least 6GB VRAM to let you enable ray tracing.)
Intel's Arc A380 ends up just ahead of the RX 6500 XT in ray tracing performance, which is interesting considering it only has 8 RTUs going up against AMD's 16 Ray Accelerators. Intel posted a deep dive into its ray tracing hardware, and Arc sounds reasonably impressive, except for the fact that the number of RTUs in the A380 severely limits performance. The top-end A770 still only has 32 RTUs, which proves sufficient for it to pull ahead (barely) of the RTX 3060 in DXR testing, but it can't go much further than that. Arc A770 also ends up ahead of AMD's RX 6800 in DXR performance, showing just how poor AMD's RDNA 2 hardware is when it comes to ray tracing.
It's also interesting to look at the generational performance of Nvidia's RTX cards. The slowest 20-series GPU, the RTX 2060, still outperforms the new RTX 3050 by a bit, but the fastest RTX 2080 Ti comes in a bit behind the RTX 3070. Where the 2080 Ti basically doubled the performance of the 2060, the 3090 delivers about triple the performance of the 3050. Hopefully a future RTX 4050 will deliver similar gains as the 4090, at a far more affordable price point.
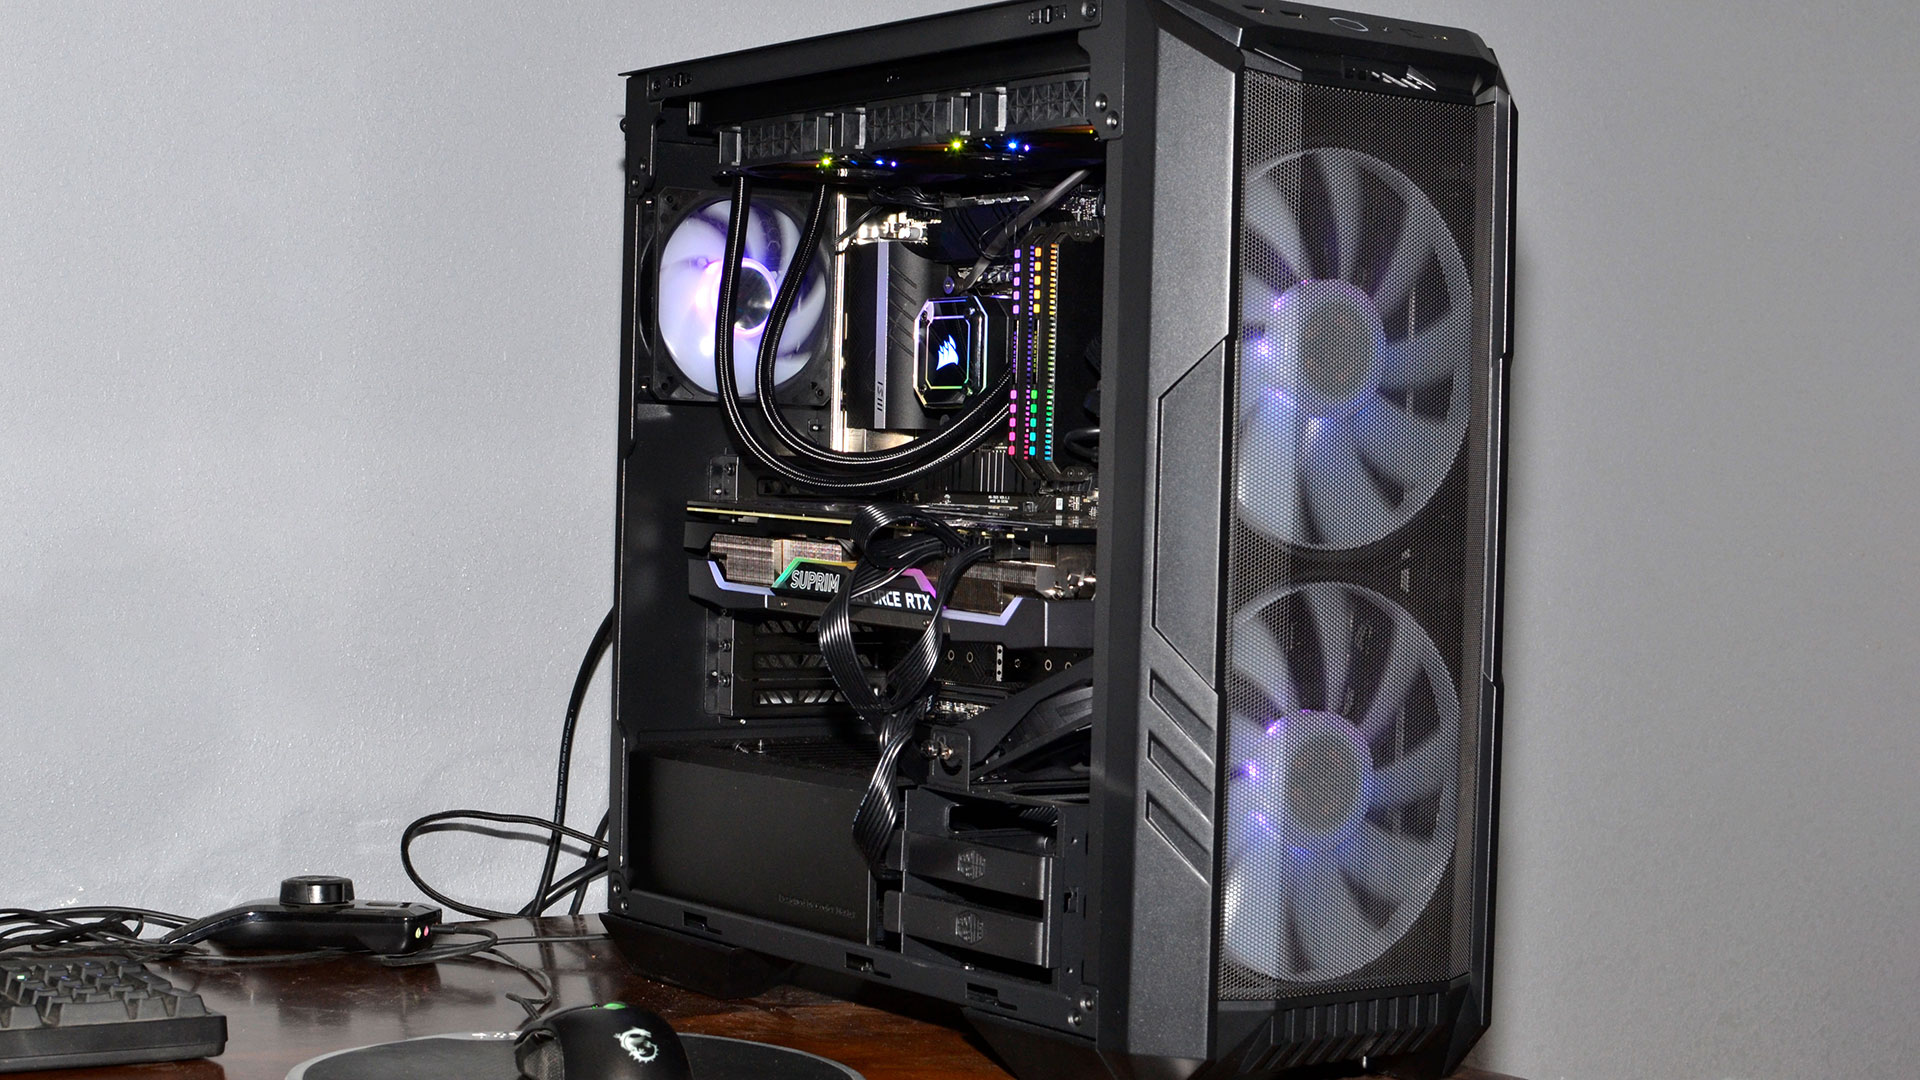
Test System and How We Test for GPU Benchmarks
We've used two different PCs for our testing. The latest 2022/2023 configuration uses an Alder Lake CPU and platform (with Raptor Lake results coming soon), while our previous testbed uses Coffee Lake and Z390. Here are the details of the two PCs.
Tom's Hardware 2022–2023 GPU Testbed
Intel Core i9-12900K
MSI Pro Z690-A WiFi DDR4
Corsair 2x16GB DDR4-3600 CL16
Crucial P5 Plus 2TB
Cooler Master MWE 1250 V2 Gold
Cooler Master PL360 Flux
Cooler Master HAF500
Windows 11 Pro 64-bit
Tom's Hardware 2020–2021 GPU Testbed
Intel Core i9-9900K
Corsair H150i Pro RGB
MSI MEG Z390 Ace
Corsair 2x16GB DDR4-3200
XPG SX8200 Pro 2TB
Windows 10 Pro (21H1)
For each graphics card, we follow the same testing procedure. We run one pass of each benchmark to "warm up" the GPU after launching the game, then run at least two passes at each setting/resolution combination. If the two runs are basically identical (within 0.5% or less difference), we use the faster of the two runs. If there's more than a small difference, we run the test at least twice more to determine what "normal" performance is supposed to be.
We also look at all the data and check for anomalies, so for example RTX 3070 Ti, RTX 3070, and RTX 3060 Ti all generally going to perform within a narrow range — 3070 Ti is about 5% faster than 3070, which is about 5% faster than 3060 Ti. If we see games where there are clear outliers (i.e. performance is more than 10% higher for the cards just mentioned), we'll go back and retest whatever cards are showing the anomaly and figure out what the "correct" result would be.
Due to the length of time required for testing each GPU, updated drivers and game patches inevitably will come out that can impact performance. We periodically retest a few sample cards to verify our results are still valid, and if not, we go through and retest the affected game(s) and GPU(s). We may also add games to our test suite over the coming year, if one comes out that is popular and conducive to testing — see our what makes a good game benchmark for our selection criteria.
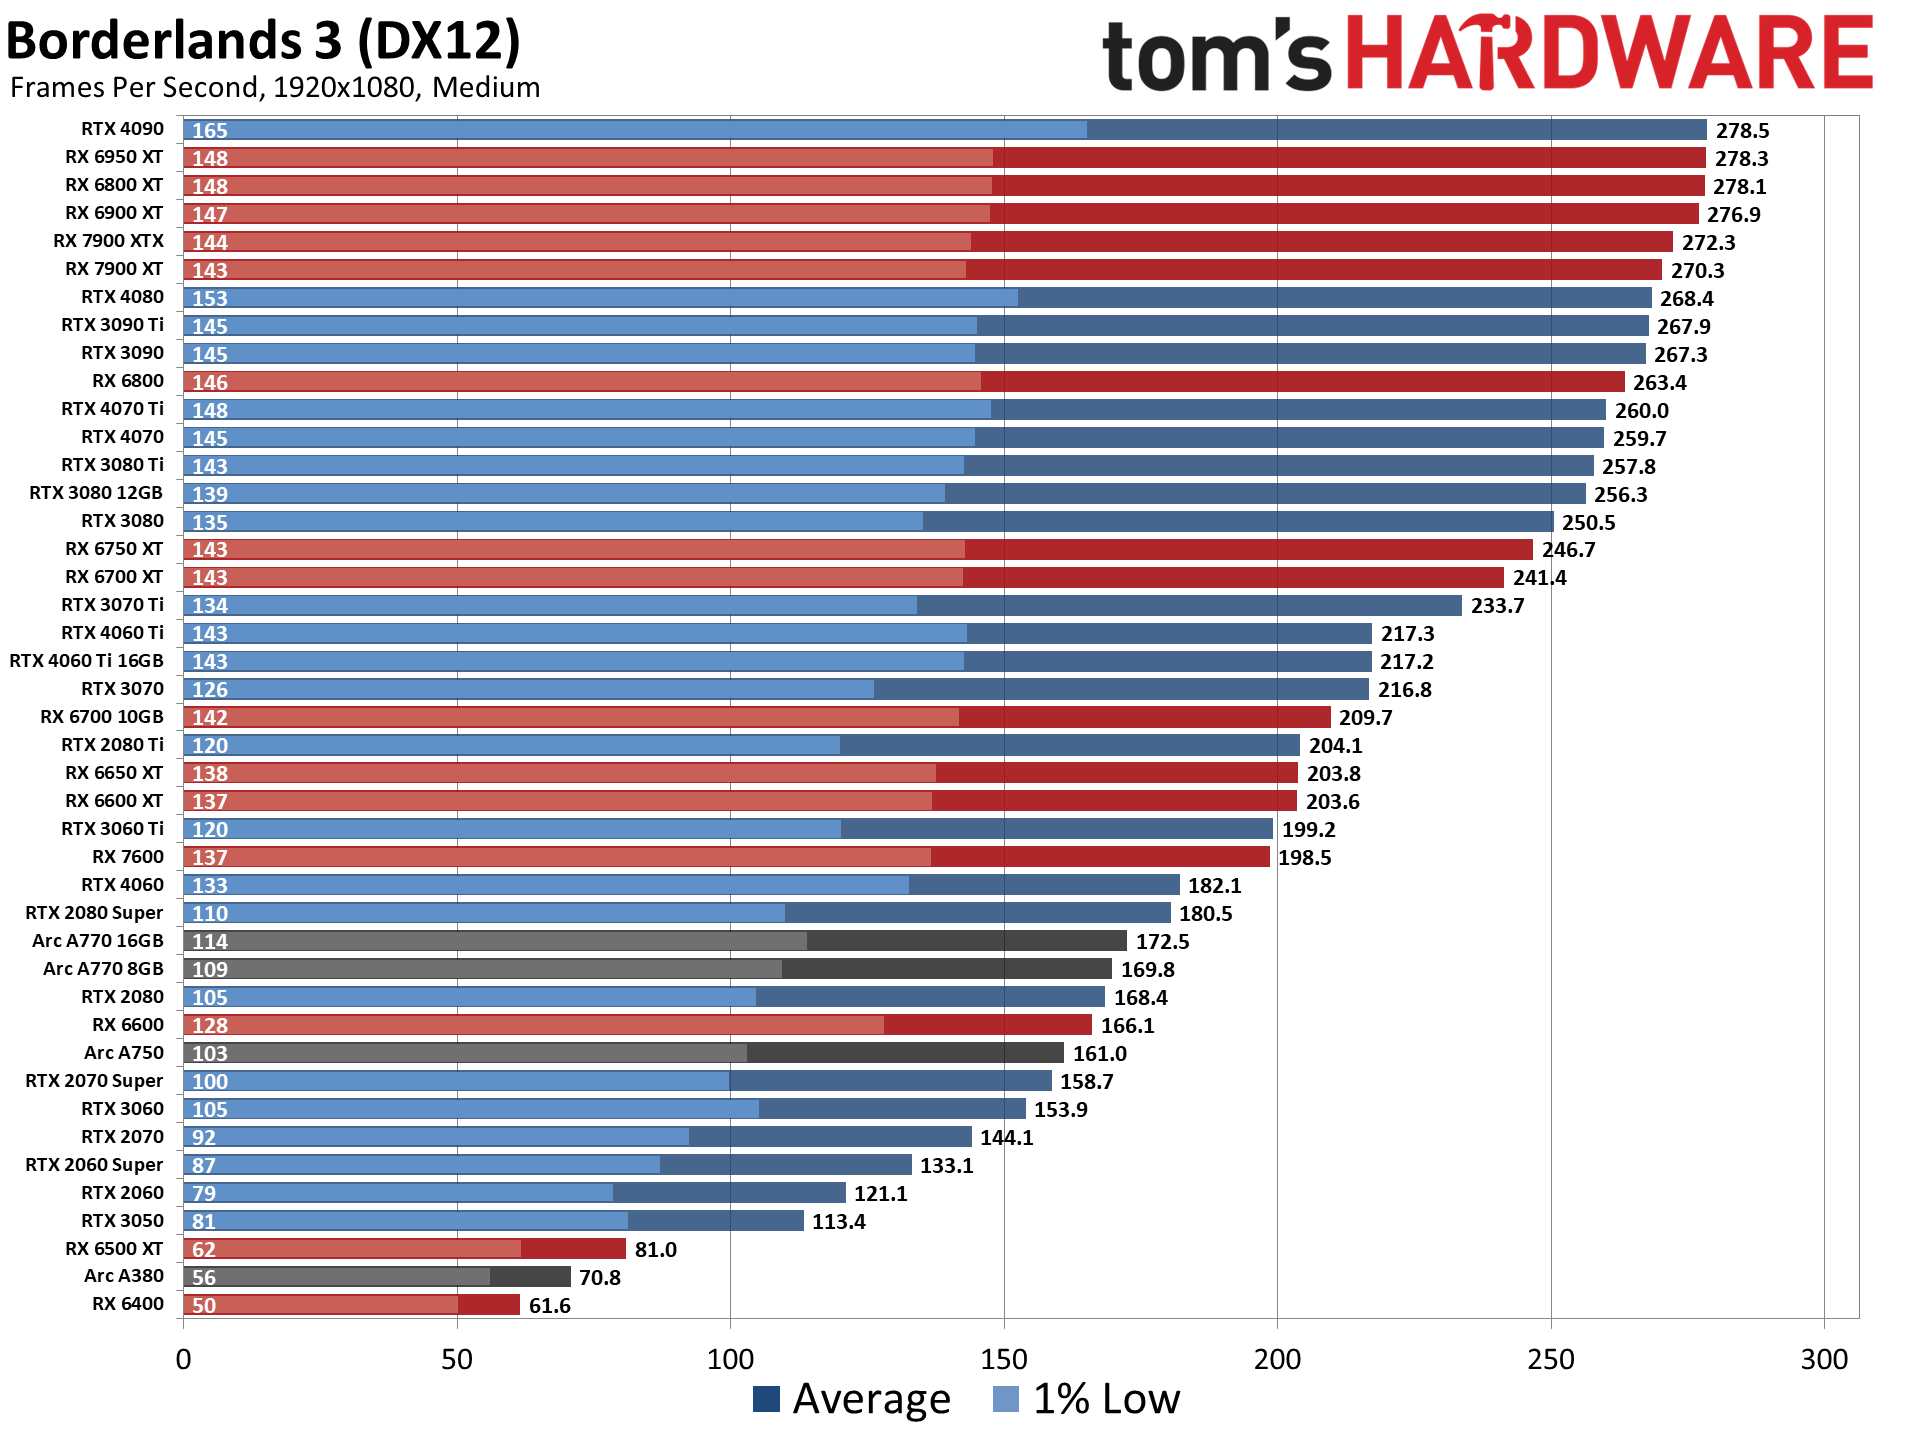
GPU Benchmarks: Individual Game Charts
The above tables provide a summary of performance, but for those that want to see the individual game charts, for both the standard and ray tracing test suites, we've got those as well. These charts were up-to-date as of December 13, 2022, with testing conducted using the latest Nvidia and AMD drivers in most cases, though some of the cards were tested with slightly older drivers. We've added more cards since then, with newer drivers, and retested the Intel Arc GPUs.
Note that we're only including the current and previous generations of hardware in these charts, as otherwise things get too cramped — and you can argue that with 29 cards in the 1080p charts, we're already well past that point. (Hint: Click the enlarge icon if you're on PC.)
These charts are up to date as of August 29, 2023.
GPU Benchmarks Hierarchy — 1080p Medium


GPU Benchmarks Hierarchy — 1080p Ultra
GPU Benchmarks Hierarchy — 1440p Ultra

GPU Benchmarks Hierarchy — 4K Ultra


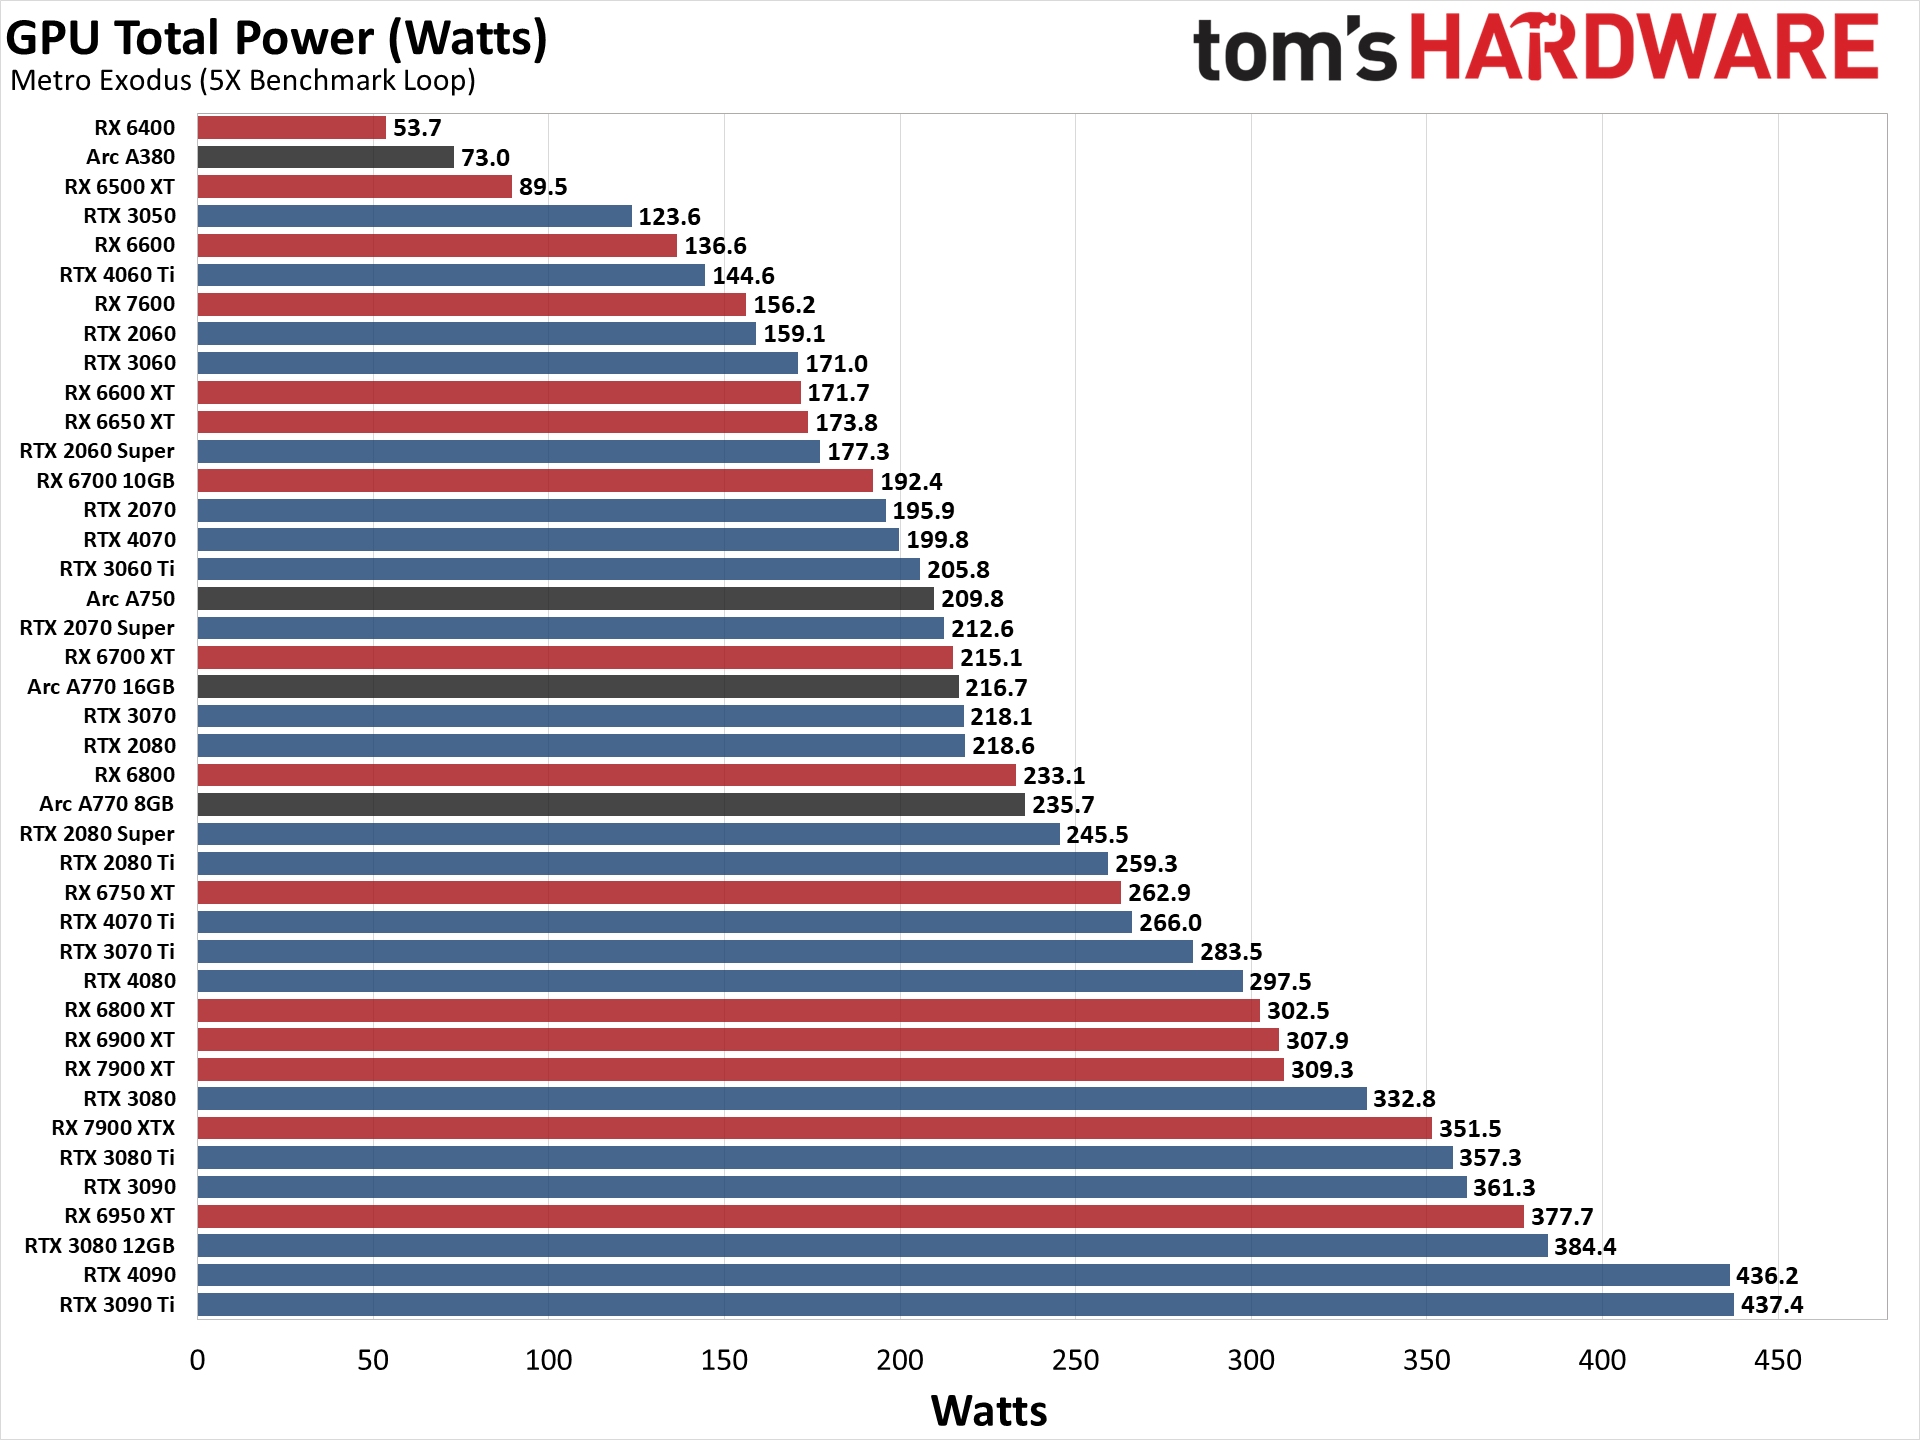
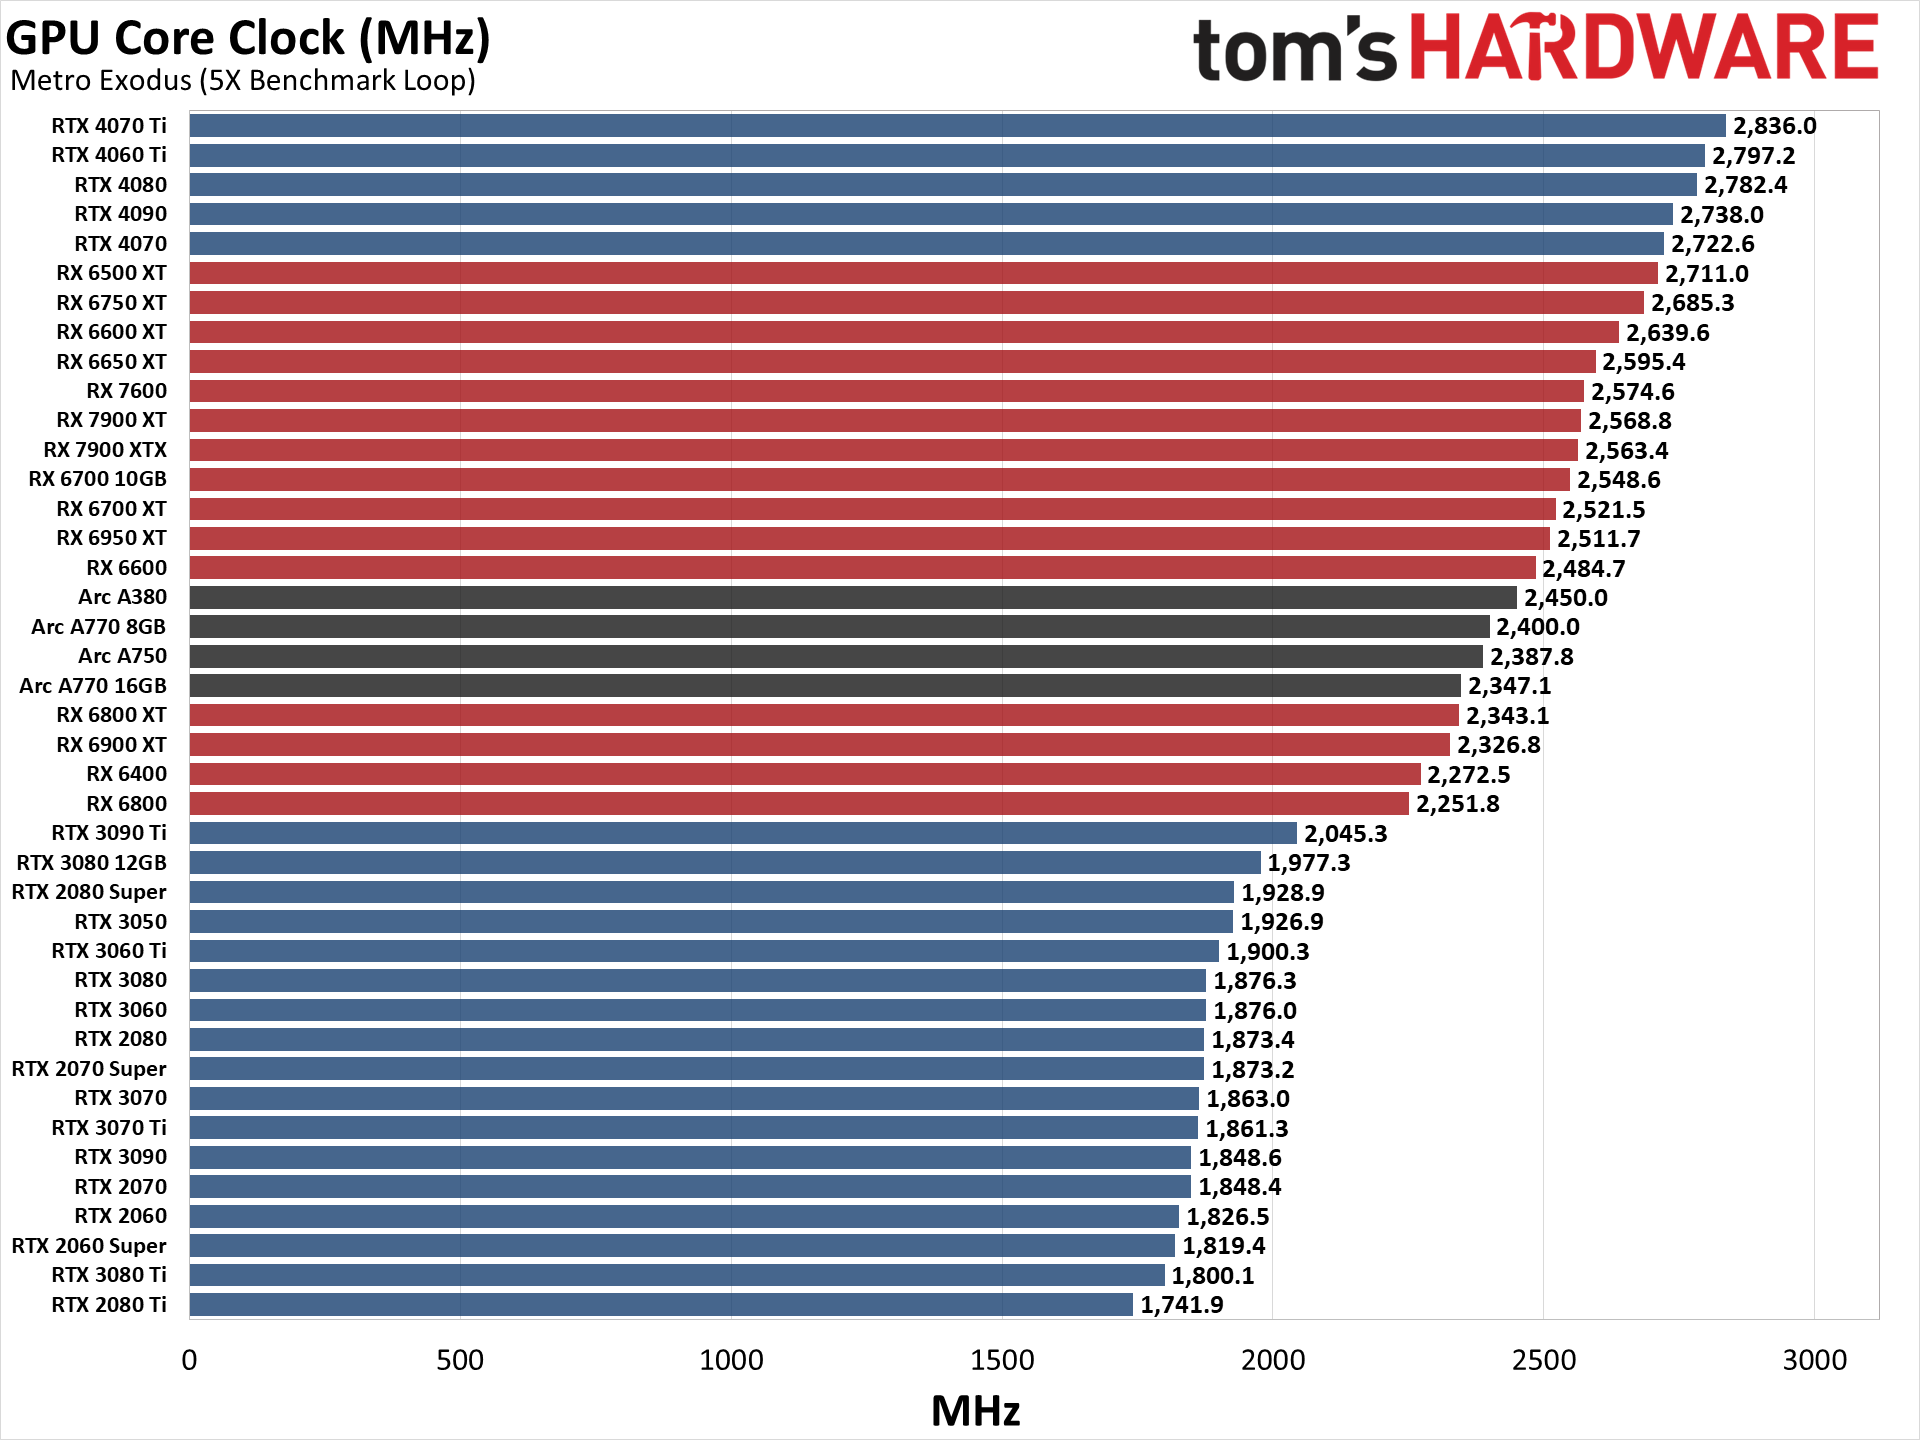
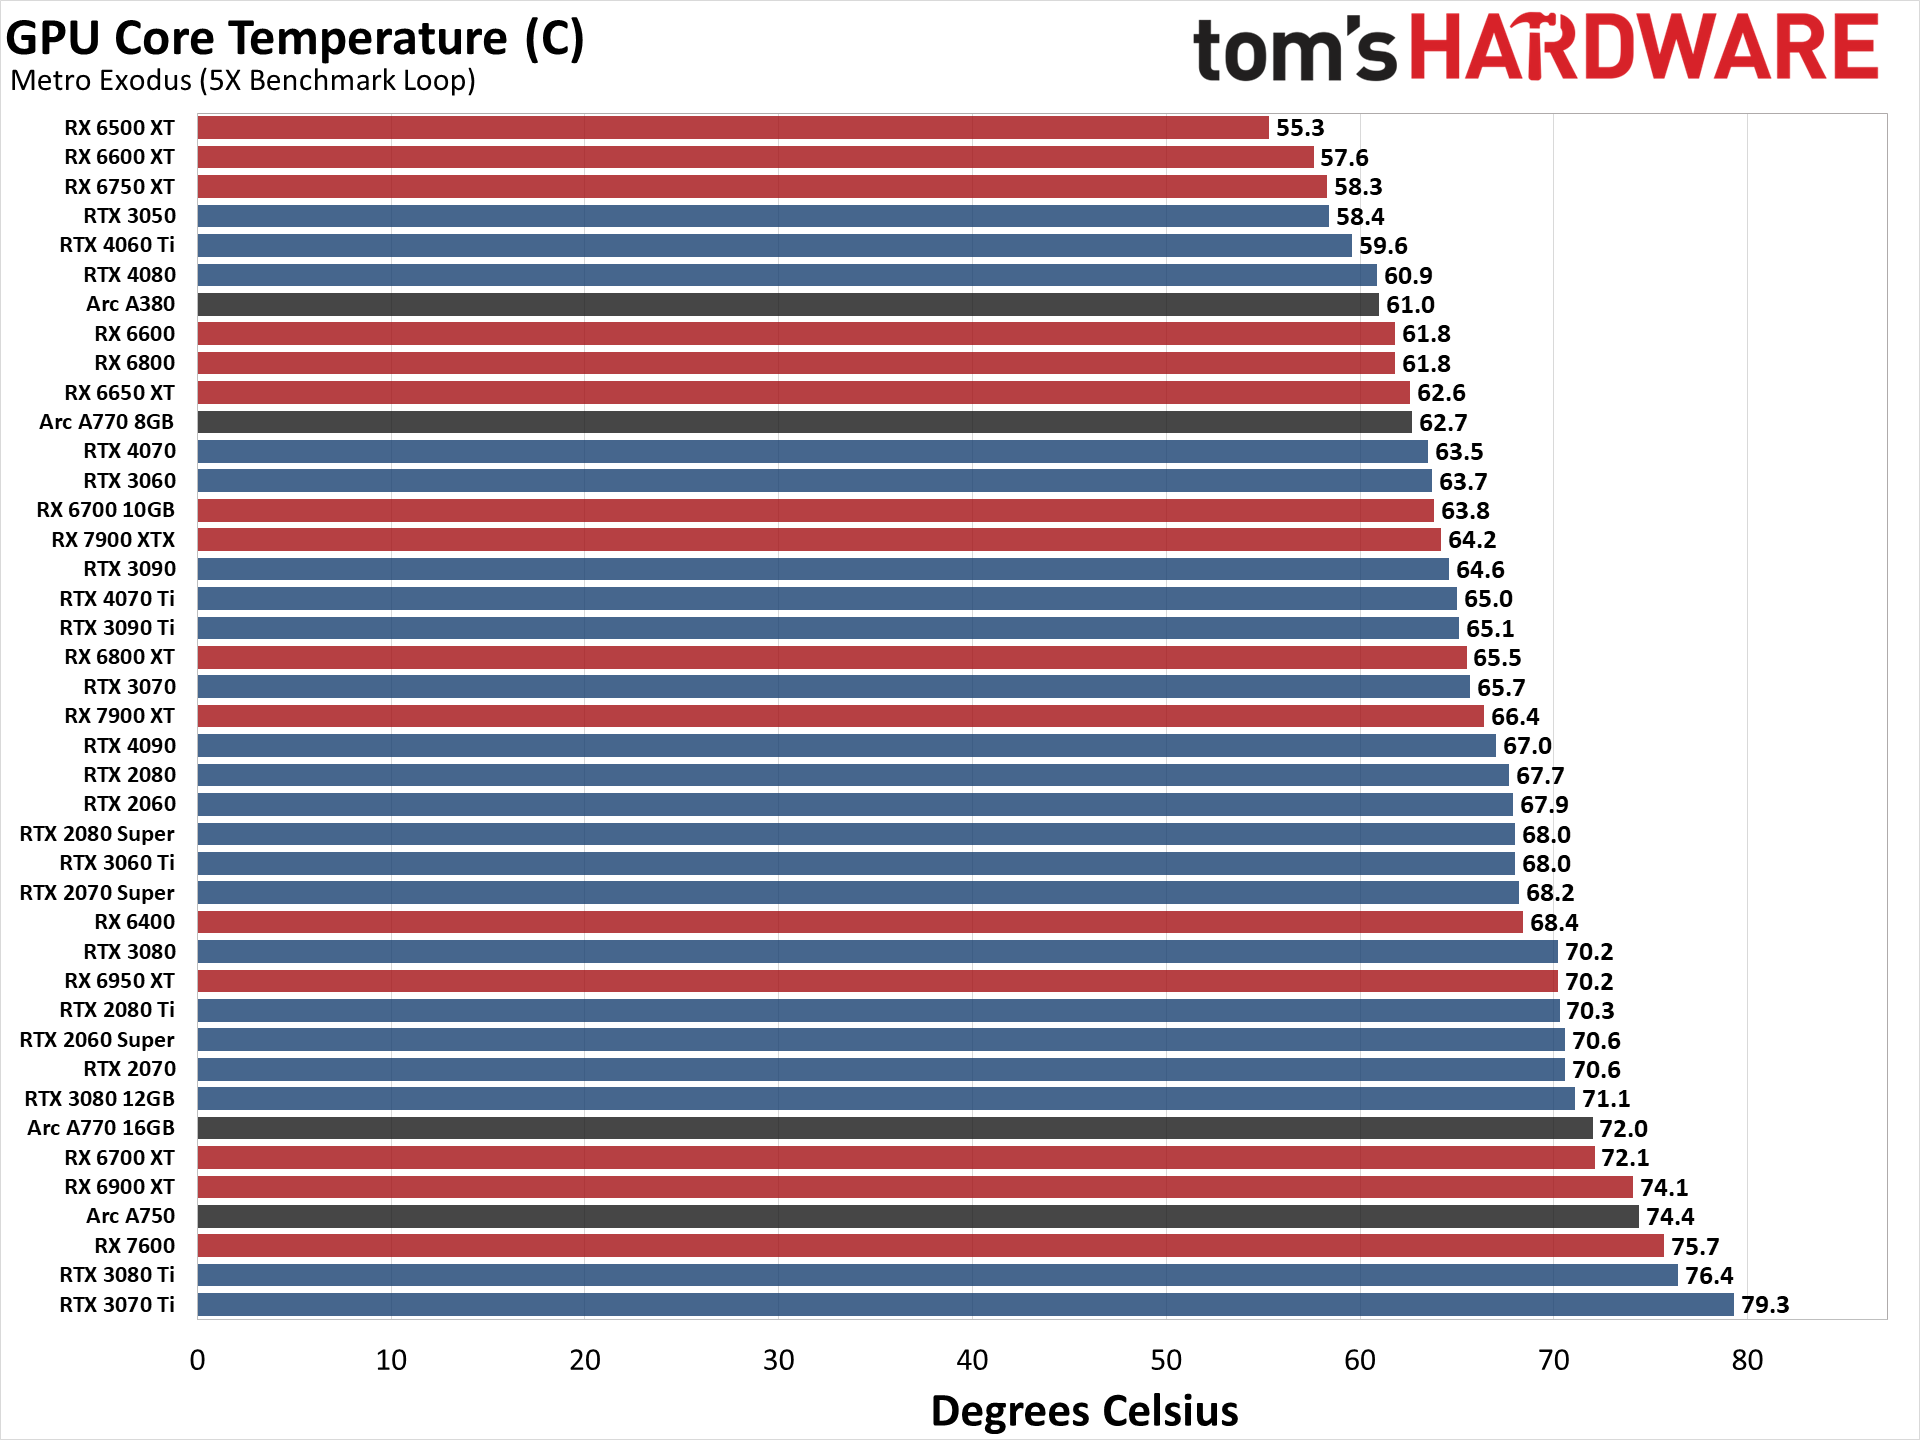
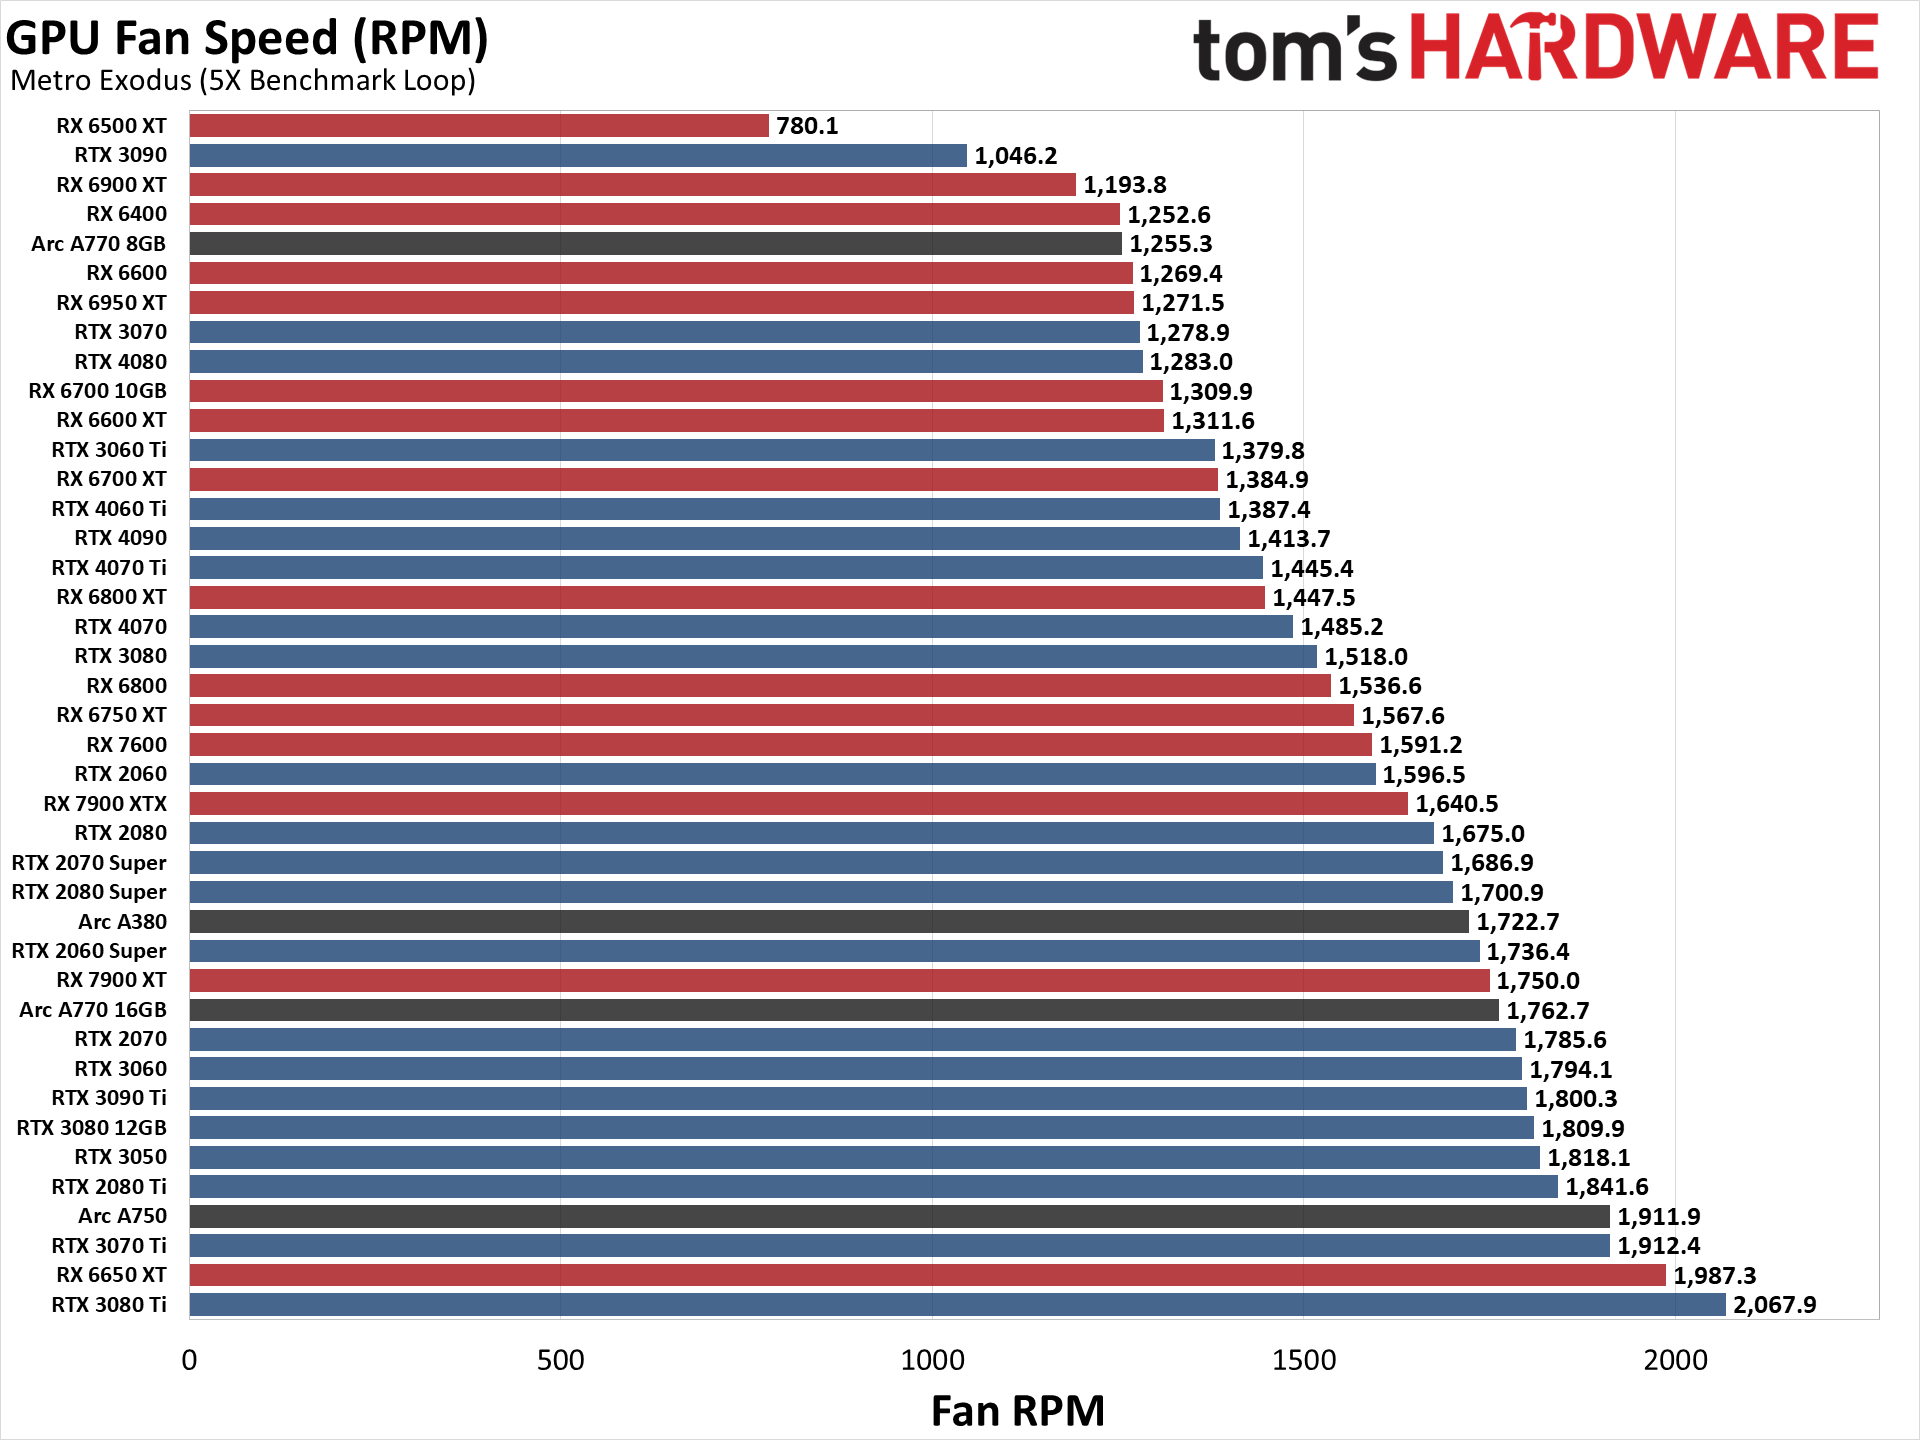
Power, Clocks, Temperatures, and Fan Speeds
While our GPU benchmarks hierarchy sorts things solely by performance, for those interested in power and other aspects of the GPUs, here are the appropriate charts.
If you're looking for the legacy GPU hierarchy, head over to page two! We moved it to a separate page to help improve load times in our CMS as well as for the main website. And if you're looking to comment on the GPU benchmarks hierarchy, head over to our forums and join the discussion!
Choosing a Graphics Card
Which graphics card do you need? To help you decide, we created this GPU benchmarks hierarchy consisting of dozens of GPUs from the past four generations of hardware. Not surprisingly, the fastest cards use either Nvidia's Ampere architecture or AMD's Big Navi. AMD's latest graphics cards perform well without ray tracing, but tend to fall behind once RT gets enabled — even more so if you enable DLSS, which you should. GPU prices are finally hitting reasonable levels, however, making it a better time to upgrade.
Of course it's not just about playing games. Many applications use the GPU for other work, and we covered some professional GPU benchmarks in our RTX 3090 Ti review. But a good graphics card for gaming will typically do equally well in complex GPU computational workloads. Buy one of the top cards and you can run games at high resolutions and frame rates with the effects turned all the way up, and you'll be able to do content creation work equally well. Drop down to the middle and lower portions of the list and you'll need to start dialing down the settings to get acceptable performance in regular game play and GPU benchmarks.
It's not just about high-end GPUs either, of course. We tested Intel's Xe Graphics DG1, which basically competes with integrated graphics solutions. The results weren't pretty, and we didn't even try running any of those at settings beyond 1080p medium. Still, you can see where those GPUs land at the very bottom of the 2020-2021 GPU benchmarks list. Thankfully, Intel's Arc Alchemist, aka DG2, appears to be cut from entirely different cloth... well, mostly.
If your main goal is gaming, you can't forget about the CPU. Getting the best possible gaming GPU won't help you much if your CPU is underpowered and/or out of date. So be sure to check out the Best CPUs for gaming page, as well as our CPU Benchmarks Hierarchy to make sure you have the right CPU for the level of gaming you're looking to achieve.
The results below are from our previous version of the GPU benchmarks hierarchy, using a different test suite and test PC (Core i9-9900K) and combining results from nine games with six resolution and setting combinations. All of the scores are combined (via a geometric mean calculation) into a single overall result, which tends to penalize the fastest and slowest GPUs — CPU bottlenecks come into play at 1080p medium, while VRAM limitations can kill performance at 4K ultra.
These results have not been updated since early 2022, when we added the RTX 3050 and RX 6500 XT to the list. We won't be adding future GPUs to this table, so there's no RTX 40-series, RX 7000-series, Arc, 3090 Ti, 6950 XT, 6750 XT, or 6650 XT, but it does help to provide a look at a slightly less demanding suite of games, where 6GB or more VRAM isn't generally required at 1080p ultra settings. You can use these older results to help inform your purchase decisions, if you don't typically run the latest games at maxed out settings.
Legacy GPU Hierarchy
Below is our legacy desktop GPU hierarchy dating back to the late 1990s. We have not tested most of these cards in many years, driver support has ended on most of these models, and the relative rankings are pretty coarse. Note that we also don't factor in memory bandwidth or features like AMD's Infinity Cache or Nvidia's larger L2 cache on Ada Lovelace. The list below is mostly intended to show relative performance between architectures from a similar time period.
We sorted the table by the theoretical GFLOPS, though on architectures that don't support unified shaders, we only have data for "Gops/s" (giga operations per second). That's GeForce 7 and Radeon X1000 and earlier — basically anything from before 2007. We've put an asterisk (*) next to the GPU names for those cards, and they comprise the latter part of the table. Comparing pre-2007 GPUs against each other should be relatively meaningful, but trying to compare those older GPUs against newer GPUs gets a bit convoluted.
These results are, at best, merely theoretical and we don't have recent benchmarks for most of the GPUs. As one recent example, AMD's new RX 7900 XTX/XT sit in spots two and three even though the RTX 4080 generally beats the 7900 XT. Take the following with a healthy dose of skepticism and a liberal sprinkling of salt, in other words, but it does contain a list of just about every major desktop GPU from the past 25 years.
* - Denotes performance measured in "GOps" — gigaoperations per second — as opposed to GFLOPS. Older GPU architectures without unified shader support aren't directly comparable with newer architectures.
Finding Discounts on the Best Graphics Cards
With all the GPU shortages these days, you're unlikely to see huge sales on a graphics card, but you may find some savings by checking out the latest Newegg promo codes, Best Buy promo codes and Micro Center coupon codes.
For even more information, check out our Graphics Card Buyer's Guide.
MORE: Best Graphics Cards for Gaming
MORE: Graphics Card Power Consumption Tested
MORE: How to Stress-Test Graphics Cards (Like We Do)
MORE: CPU Benchmarks
Want to comment on this story? Let us know what you think in the Tom's Hardware Forums.