"Streaming outperforms both cable and broadcast TV for the first time ever," said NPR.
"U.S. streaming tops cable TV viewing for first time, Nielsen says," screamed the Penske showbiz trades.
"Streaming TV surpasses cable viewing for the first time," Nielsen reports," noted Ad Age.
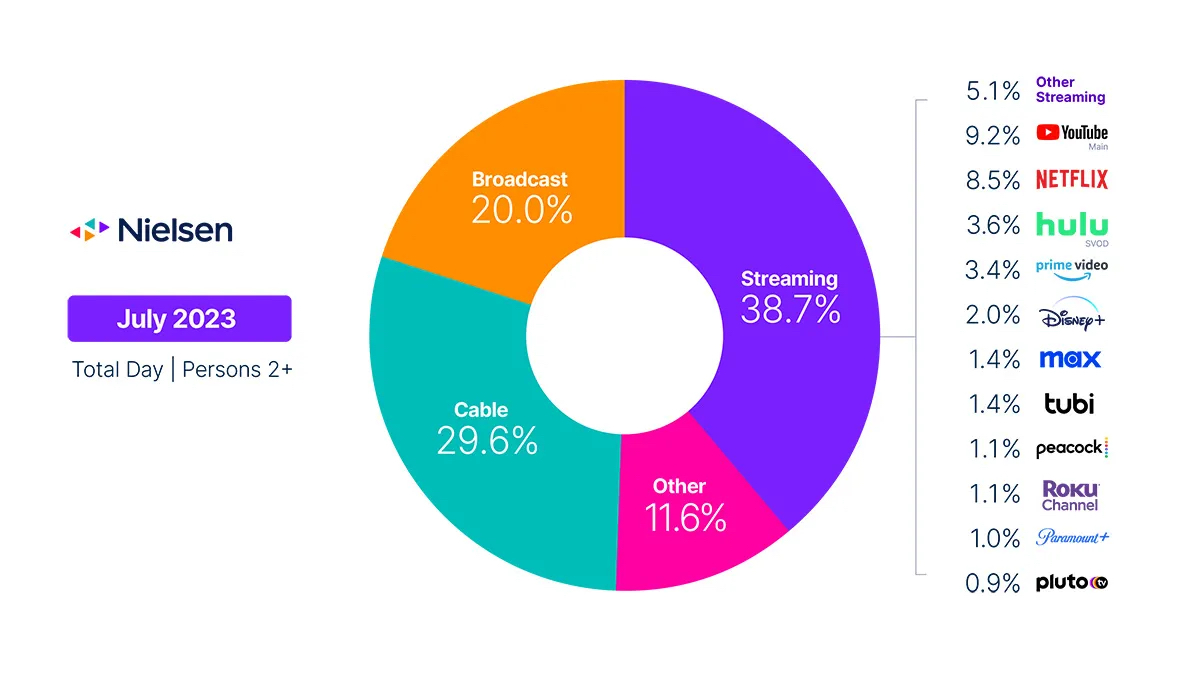
These reports were all published back on August 18, 2022. They're separate from this week's posts in major outlets including the Wall Street Journal, CNN and our venerable sibling publication, Broadcasting+Cable, noting that all programming on "linear TV" (cable and broadcast) accounted for less than half of overall U.S. video watching in July.
Both of these media-on-media news events were inspired by Nielsen's graphic-driven monthly TV viewing market share tracker, introduced in 2021 and known as "The Gauge."
Referenced by influencers including Netflix Co-Founder Reed Hastings early on, The Gauge has achieved a collective, centralized focus on the dashboard of the broader U.S. media and entertainment industry as it tracks the steady, sustained encroachment of video streaming onto traditional television's dwindling turf.
And every month, Nielsen's PR team has deftly worked the angles, thinking up new reasons to draw attention to its increasingly influential research asset.
Next TV kicked the tires on Nielsen a year ago about its Gauge-fueled "streaming surpasses cable" claim and accompanying PR Newswire-supported announcement, which again, got picked up seemingly everywhere.
Specifically, we've had misgivings about Nielsen's methodology for its Gauge, which seems to focus on sample measurement of connected TVs and may or may not account for viewing on smart phones, tablets and computers.
"The data for The Gauge is derived from two separately weighted panels and combined to create the graphic," Nielsen says in a FAQ at the bottom of each monthly Gauge announcement. "Nielsen’s streaming data is derived from a subset of Streaming Meter-enabled TV households within the National TV panel. The linear TV sources (broadcast and cable), as well as total usage are based on viewing from Nielsen’s overall TV panel."
"Since it's a subset of their national panels, it is literally impossible to tell [what devices are being measured]," said high-profile media analyst Evan Shapiro in an email exchange Wednesday with Next TV. "Their methodology on the page is utter B.S."
Next TV tried to dig deep into how Nielsen comes up with its Gauge, as well as its weekly top 10 U.S. streaming tracker, in May 2022. But like a lot of naive TV business journalists before us, we were overmatched by Nielsen's byzantine labyrinth of confusion, distraction and vitriol.
This time around, with the media business press using the July The Gauge to mark a supposed watershed moment during which streaming finally usurped all of "linear TV," we were not the only ones who are skeptical.
Speaking out on LinkedIn earlier on Wednesday morning, Shapiro noted that simple juxtapositional analysis of the July Gauge as a "linear vs. streaming" proposition "is just not factually accurate."
Shapiro's issues with the Gauge, as voiced on social, had less to do with Nielsen's methodology and more with how the media is interpreting the data.
He said the consensus "linear vs. streaming" argument "misinterprets what's actually in there ... and proves how ill-prepared we are for the new era of TV."
Shapiro went into further detail on his Substack, but he voiced new notable concerns for starters:
For one, with ad-supported "FASTs" including the Roku Channel, Tubi and Pluto TV, accounting for 3.4% of overall viewing in July, according to Nielsen, but presenting most of their programming in a "linear" fashion, the demarkation of "linear" and "streaming" can get a little wonky.
And there's also streaming pay TV, aka virtual MVPDs or vMVPDs. YouTube TV, for instance, is now distributed into as many as 6 million U.S. homes, according to estimates, but how do you classify viewing of services that stream bundles of linear cable channels?


