Fuelcell Energy Inc. (NASDAQ:FCEL) shares are trading higher Monday and are looking to cross back above a key level that was once an area of support.
This area could act as resistance and hint at a bearish move in the future. Or the price will cross back above the level and begin holding it as support once again. This would hint at a period of bullish movement in the future. The stock was trending on social media sites throughout the morning.
Fuelcell Energy was up 13.91% at $6.20 midday Monday.
See Related: FuelCell Energy Stock Is Breaking Above A Key Level: What's Next?
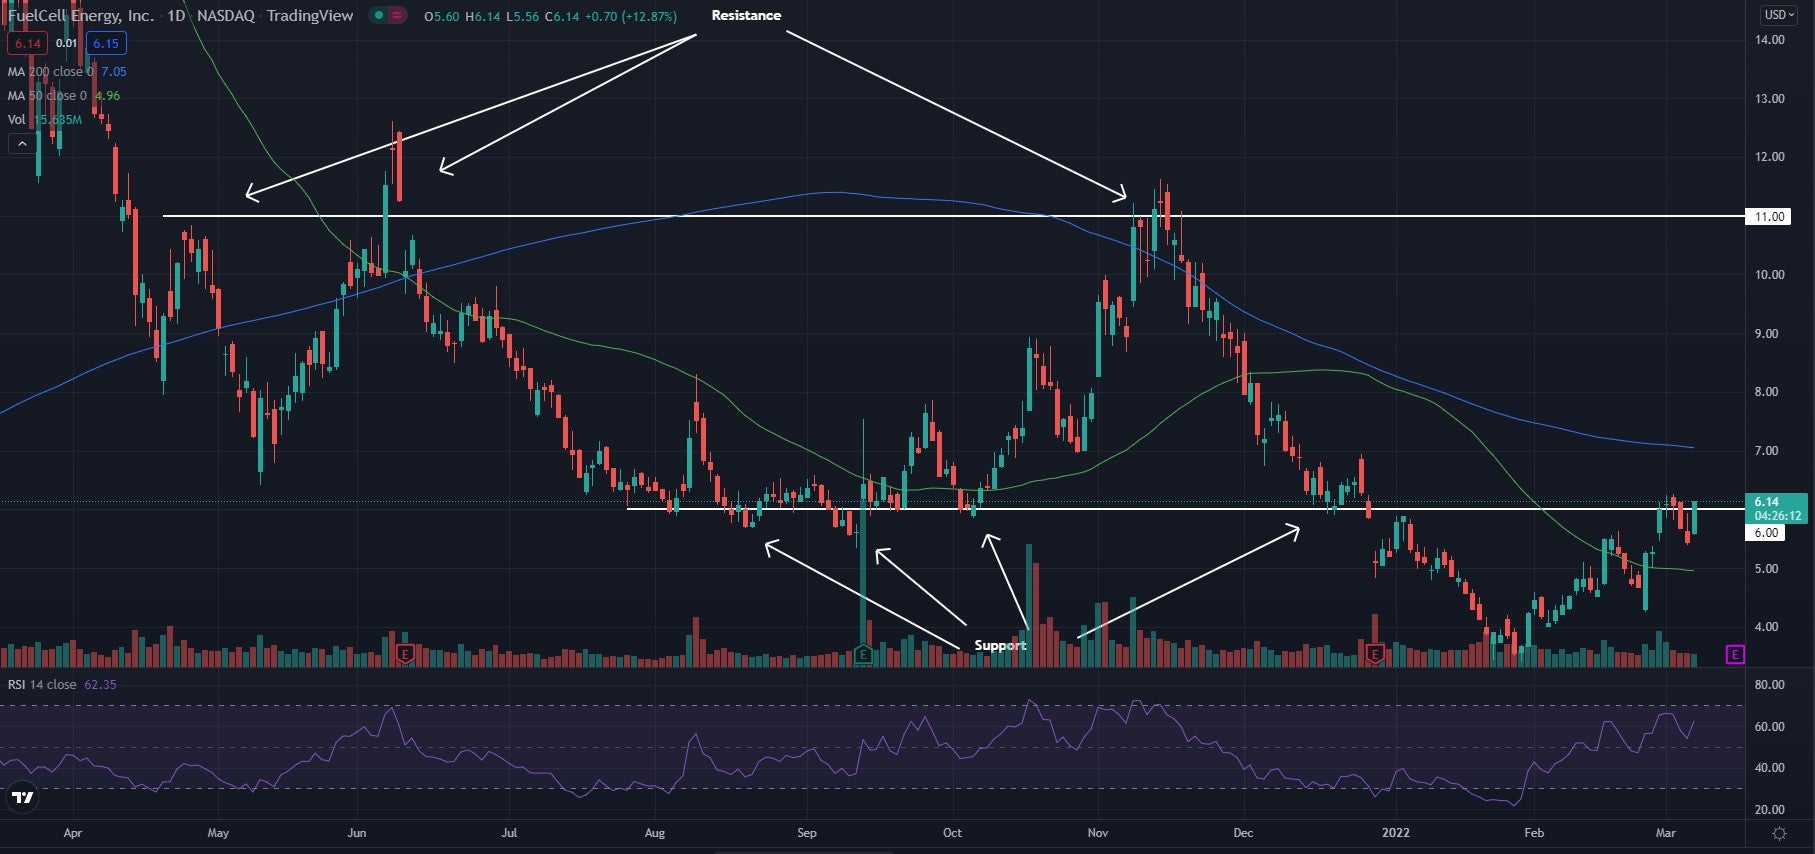
Fuelcell Energy Daily Chart Analysis
- The stock looks to be attempting to reclaim a support level it has recently fallen below in what traders call a sideways channel. The $6 level has been an area of support in the past, and if the price can cross and hold above the area, it may become support once again. If not, the level may turn into an area of resistance in the future and the price may struggle to cross above the area. If this were to occur, the price could see a strong bearish move in the future.
- The stock trades above the 50-day moving average (green) but trades below the 200-day moving average (blue). This indicates the stock is entering a period of consolidation. The 50-day moving average may hold as an area of support, while the 200-day moving average may act as resistance.
- The Relative Strength Index (RSI) has been climbing higher the past few weeks and now sits at 62. This shows that the stock is seeing more buying pressure than it is selling pressure and more and more buyers have been entering into the stock.
What’s Next For FuelCell Energy?
The stock is in a period of make it or break it. The stock is attempting to break above the old support level and hold above it once again to see it become support. Otherwise the stock will hold this level as an area of resistance and see bearish movement in the future.
Bullish traders are looking for the break above the level and for the stock to continue to form higher lows inside of the channel.
Bearish traders are looking for the price to be unable to hold above the $6 level and stat falling once again. Bears also want to see the price fall below the 50-day moving average for sentiment to turn more bearish.