
Ford Motor Co. (NYSE:F) shares are trading lower Friday after the company announced worse-than-expected fourth-quarter earnings results.
Ford reported automotive revenue of $35.26 billion, slightly under the analyst consensus of $35.52 billion. The company reported adjusted earnings of 26 cents per share, missing the estimate of 45 cents per share.
Ford was down 10.31% at $17.84 midday Friday.
See Related: Why Ford Shares Are Trading Lower Today
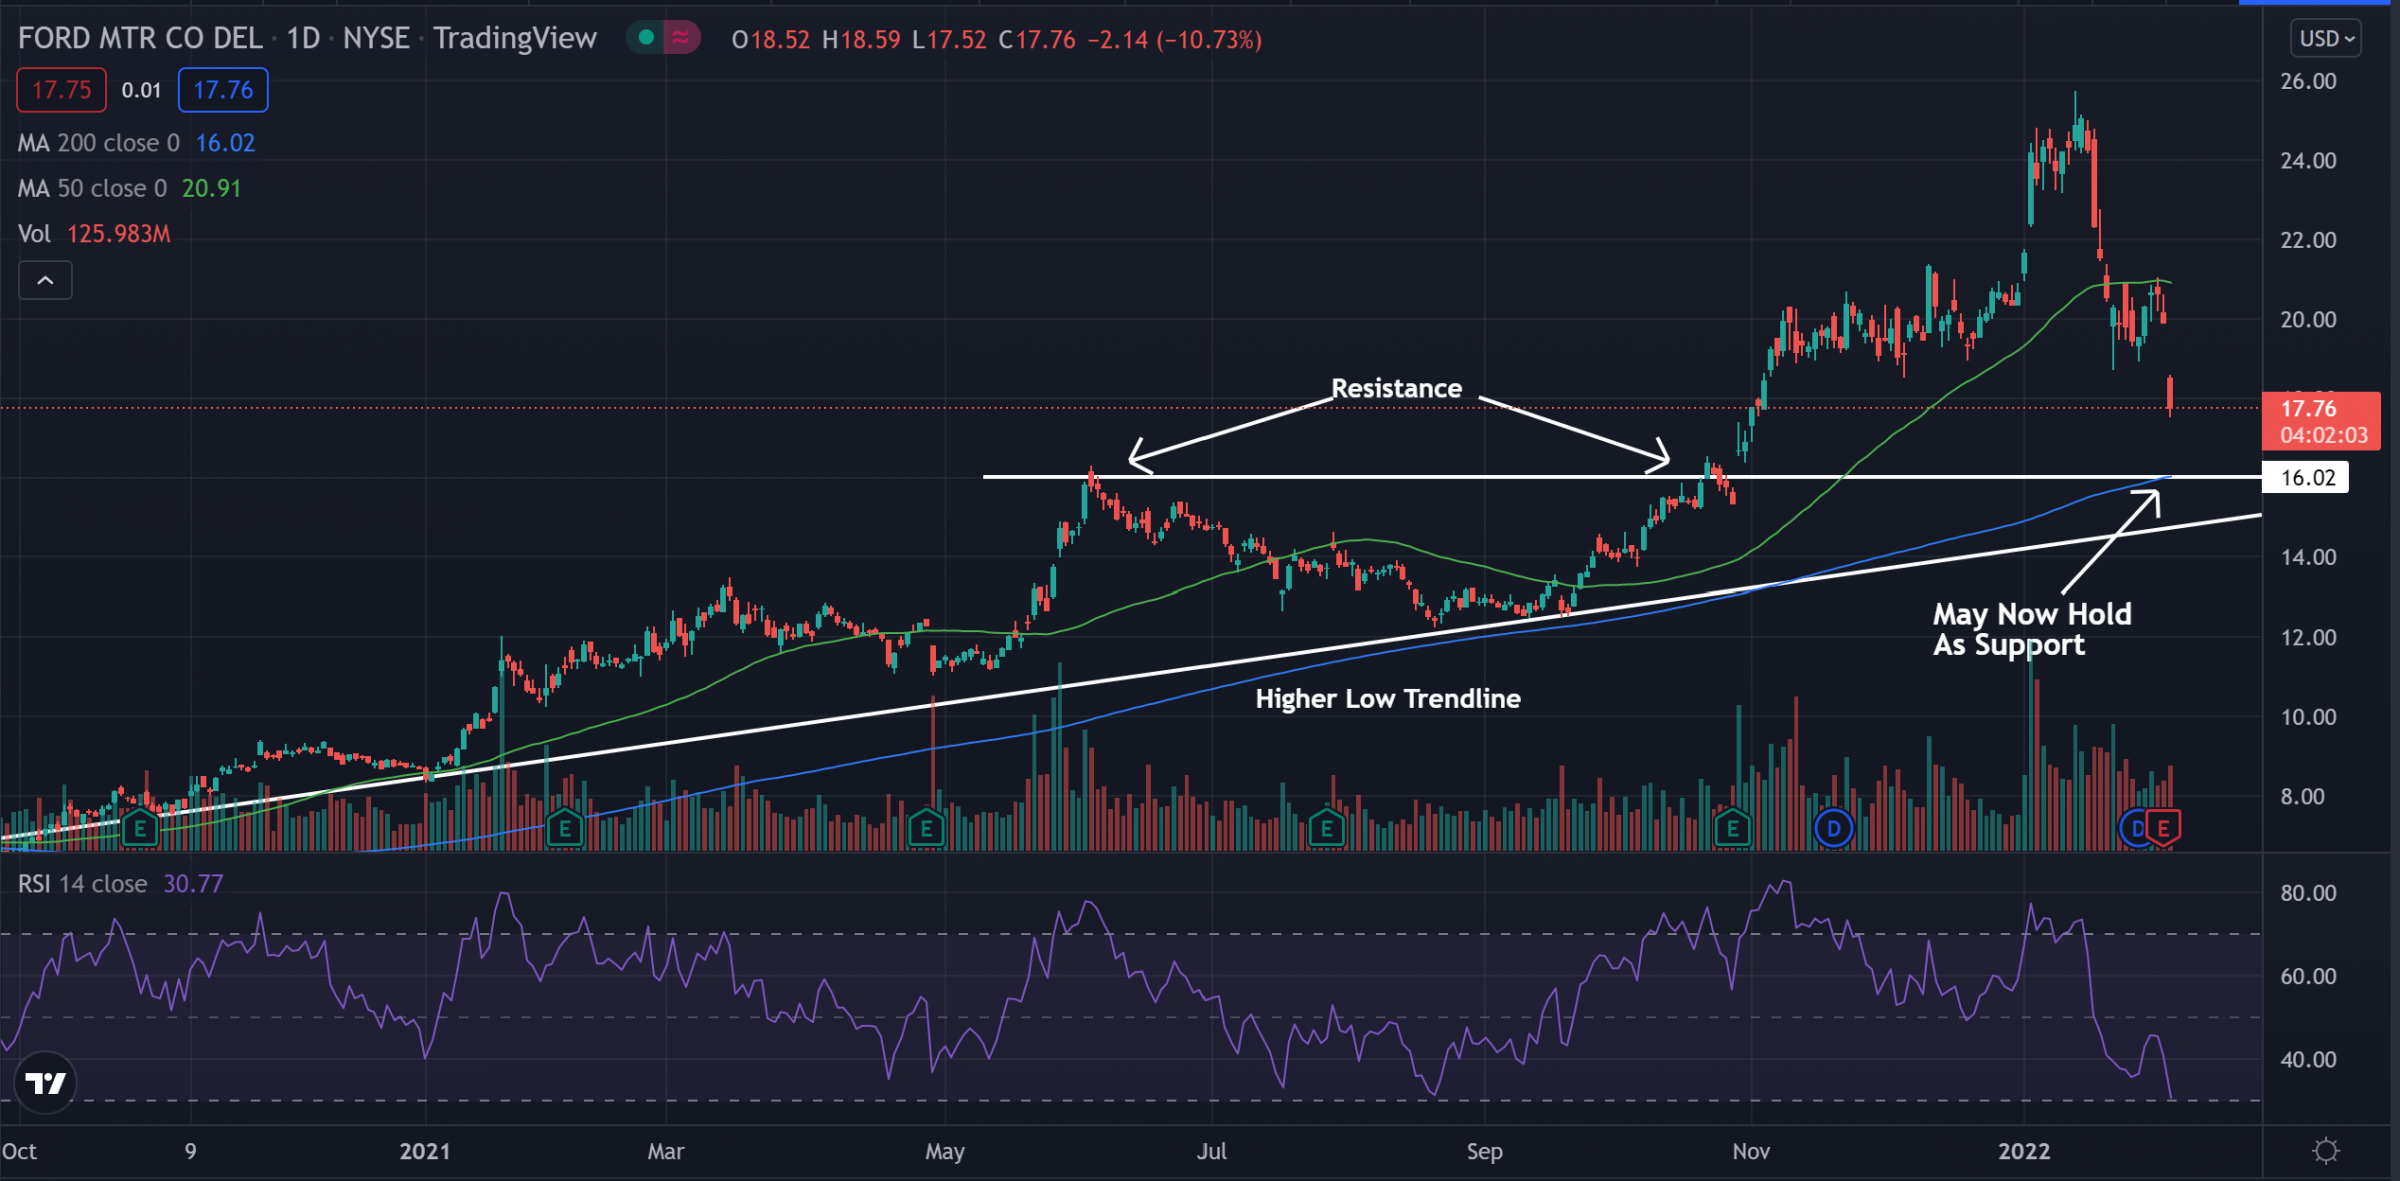
Ford Daily Chart Analysis
- The stock recently broke out of what traders call an ascending triangle pattern, but has been falling lately toward the previous resistance line of the pattern. The $16 level may now hold as an area of support in the future, as the price has crossed above the level.
- The stock trades below the 50-day moving average (green) but trades above the 200-day moving average (blue), indicating the stock is in a period of consolidation. The 50-day moving average may act as a place of resistance, while the 200-day moving averages may hold as support.
- The Relative Strength Index (RSI) has been steeply falling the past couple of weeks and now sits at 30. This shows the RSI is on the border of the oversold region and the stock is seeing much more selling pressure than it is buying pressure.
What’s Next For Ford?
The stock is seeing a period of bearish movement, as the price is dipping back lower. They key level to watch is the $16 level, as it has been resistance in the past and may turn into an area of support.
Bullish traders are looking to see the level hold as support and for the stock to make a bounce near this level. Bulls are then looking for higher lows and for the RSI to climb back higher again. Bears are looking to see the RSI remain near the oversold region and for the price to cross below the $16 level. If the price crosses below this level, bears want to see it drop below the higher low trendline for a possible bearish trend to begin.
Photo courtesy of Ford.