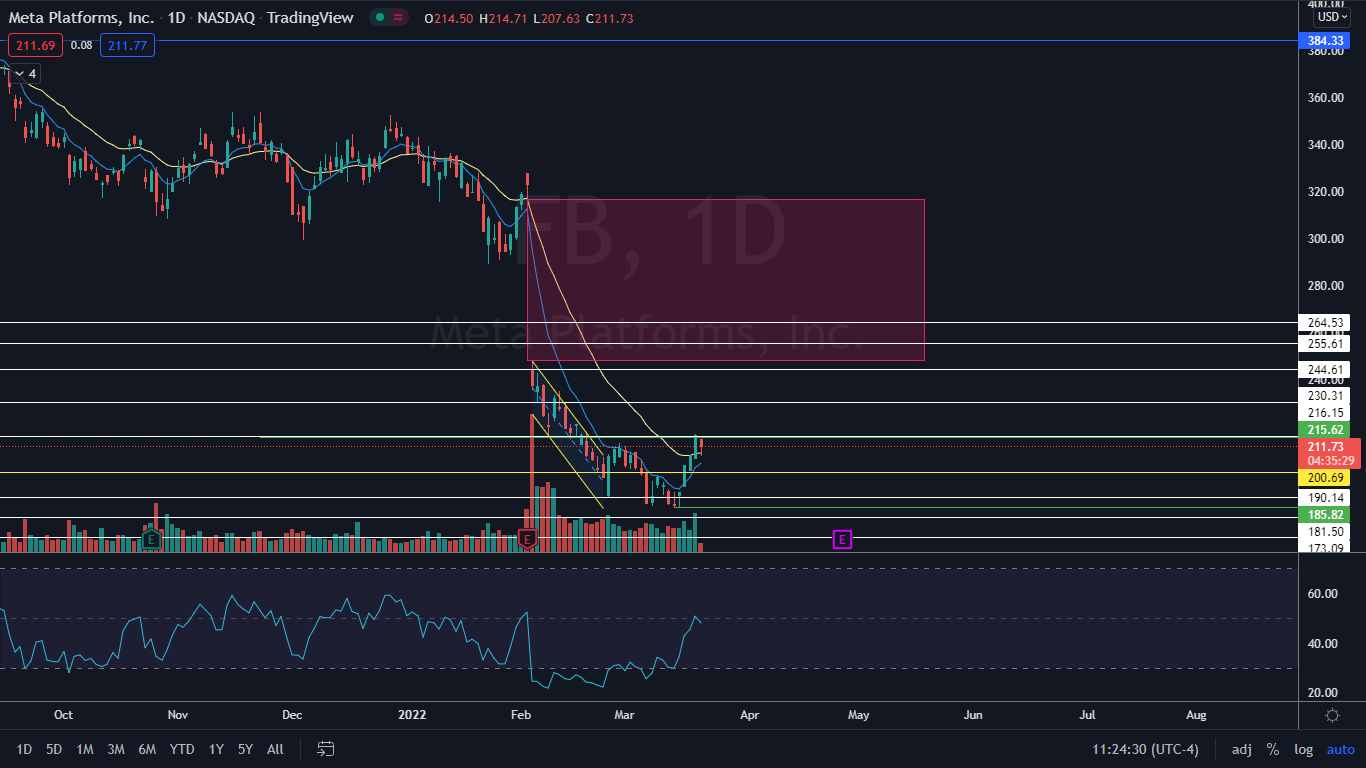
Meta Platforms Inc (NASDAQ:FB) has created double bottom and triple bottom patterns on the daily chart.
A double bottom pattern is a reversal indicator that shows a stock has dropped to a key support level, rebounded, back-tested the level as support and is likely to rebound again. It is possible the stock may retest the level as support again creating a triple bottom or even quadruple bottom pattern.
The formation is always identified after a security has dropped in price and is at the bottom of a downtrend, whereas a bearish double top pattern is always found in an uptrend. A spike in volume confirms the double bottom pattern was recognized and subsequent increasing volume may indicate the stock will reverse into an uptrend.
- Aggressive bullish traders may choose to take a position when the stock’s volume spikes after the second retest of the support level. Conservative bullish traders may wait to take a position when the stock’s share price has surpassed the level of the initial rebound — the high before the second bounce from the support level.
- Bearish traders may choose to open a short position if the stock rejects at the level of the first rebound or if the stock falls beneath the key support level it created the double bottom pattern.
See Also: Facebook Parent Meta Gets Sued In Australia Again — This Time Over 'Scam Celebrity Crypto Ads'
The Meta Chart: Meta formed a double bottom pattern at the $185.82 level on March 14 and March 15 and in reaction, the stock shot up 16.61% higher to reach a high of $216.80 on Friday. On Monday, the stock opened slightly lower and looked to be forming an inside bar pattern on the daily chart.
- The inside bar leans bullish because Meta was trading higher before forming the pattern. Bullish and bearish traders can watch for a break of Friday’s mother bar later on Monday or Tuesday to gauge the future direction.
- The stock has not confirmed it’s trading in a new uptrend pattern because it has not printed a higher low. Bullish traders can watch for a reversal candlestick, such as a doji or hammer, to form over the coming days to indicate a higher low is being formed. This could also offer a solid entry point for traders who are not already in a position.
- The move lower on Monday was on lower-than-average volume, which indicates healthy consolidation is taking place.
- Meta has a gap above between $248 and $316.87, which is about 90% likely to fill at some point in the future.
- The stock has resistance above at $216.15 and $230.31 and support below at $200.69 and $190.14.


