
ExxonMobil Corp (XOM) stock is off its lows but still looks cheap to analysts. After all, XOM has a 3.6% annual dividend yield and a forward multiple below 13x earnings. Moreover, selling short out-of-the-money put options is a good income play.
XOM closed at $109.02 on Friday, March 7, up from a recent low of $105.44 on March 5. I discussed Exxon's cash flow, dividends, and valuation in a Feb. 3 Barchart article: “ExxonMobil Gushes Huge Cash Flow Albeit at Lower Levels - Is it Time to Buy?”

XOM stock still has an upside based on analysts' price targets and its historical average dividend yield. Moreover, selling short out-of-the-money (OTM) put options can provide extra income for investors. This article will delve into these points.
Analyst Price Targets for XOM Stock
At the time, XOM was at $106 and I showed that analysts had higher price targets. Today, those analysts still believe XOM is undervalued. For example, Yahoo! Finance reports that 28 analysts have an average price target of $129.33 per share. That is +18.6% higher than today's price.
Similarly, Barchart's mean survey shows an average of $129.42 per share. In addition, AnaChart.com shows that 29 analysts have an average price target of $129.44. The point is that there is a general recognition by analysts that XOM stock looks undervalued.
AnaChart's report shows that the top five analysts who have predicted XOM stock in the past have significantly higher price targets. The AnaChart table below shows that these five analysts have all very high “Price Targets Met Ratio” rankings.

For example, Doug Leggate of Wolfe Securities has been right 93% of the time on XOM stock. He presently has a BUY and a $140 price target. Moreover, the top 5 analysts have an average price target of $132.40 for XOM stock.
That represents a potential upside for investors of +21.4%. However, there is no indication of when this would occur.
Dividend Yield Target. In addition, as I pointed out in my last article, data from Morningstar shows that XOM's dividend yield over the last 3 years has averaged 3.49%. That is lower than XOM's dividend yield today of 3.63%:
$3.96 dividend per share (DPS) / $109.02 = 0363 = 3.63%
As a result, if we apply this historical yield to the DPS, it implies that XOM stock should trade at least 4% higher:
$3.96 / 0.0349 = $113.47,
$113.47 / $109.02 = 1.0408 = +4.1% upside
Keep in mind an average yield means that 50% of the time the stock will trade at a higher price than $113.47. So, this lends more credence to the point that XOM is undervalued.
But, again, there is no time frame when this will occur. One way to bet paid while waiting for this to happen is to sell short out-of-the-money (OTM) put options.
Shorting OTM Puts for Income
Last month I showed that selling the $102 strike price put option expiring March 7 would produce an immediate yield of 1.343% (i.e., $1.37/$102.00) over the next month. At the time, this put option was 4% below the trading price of $106.83, so it was out-of-the-money (OTM). Moreover, the play had a low probability of being assigned, as the delta ratio was 27%.
It turned out that with XOM at $109.02 on March 7, this put expired worthless, which is what the short-seller of these puts wanted to see. In other words, the investor had no obligation to buy 100 shares per put contract at $102.00 - so the investor got paid handsomely with a 1.34% yield over the 34 days to expiration. This trade can be repeated.
For example, look at the April 11 expiration period - 34 days from March 7. It shows that investors can make a similar high yield shorting OTM puts. This can be seen in the table below.
It shows that the $105.00 strike price puts have a midpoint premium of $1.83 per put contract. That allows an investor to make a yield of $1.74% over the next month (i.e., $183/$105.00 = 0.017428 = 1.74%).
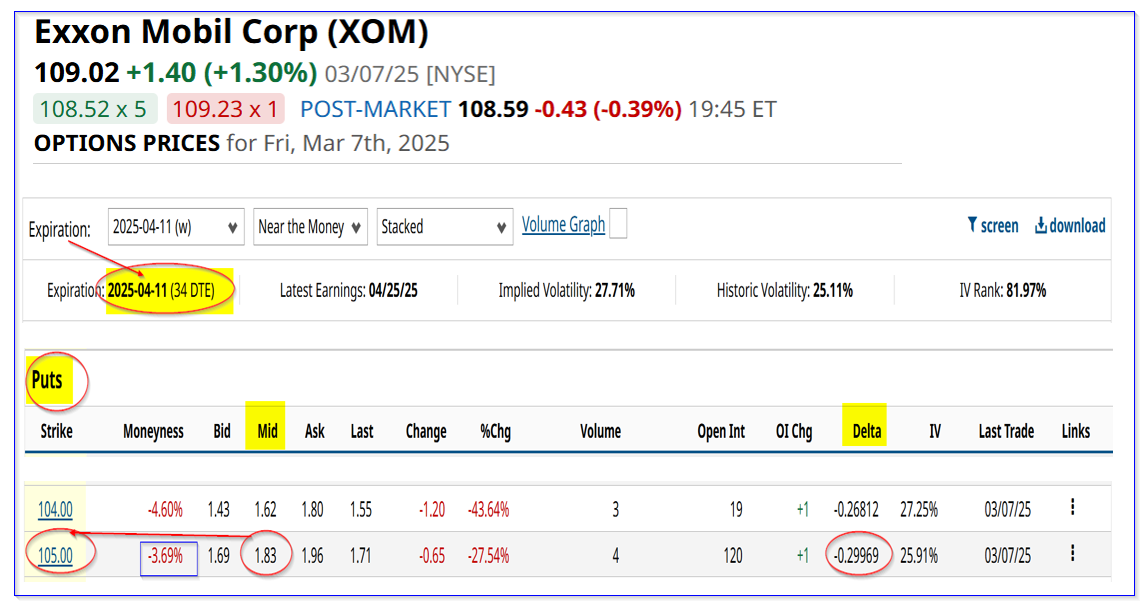
Note that this strike price is 3.69% below Friday's trading price and the delta ratio is 0.299 - i.e., about a 30% chance of being assigned, based on historical trading activity in XOM stock. This is similar to the prior trade that worked out.
Note that there are considerable risks with this trade. Investors should go to the Barchart Options Learning Center and specifically the Put Options Selling Section. The point is that it's possible that XOM could fall below $105.00 and the investor would end up with a potential unrealized capital loss.
However, even in that case, at least the breakeven price for the investor would be $105.00 - $1.83, or $103.17. That is 5.36% below the trading price on Friday, March 7 of $109.02. In other words, this is a way to set a lower buy-in target price.
Moreover, the investor will have a higher annual yield, since the $3.96 DPS provides an investor with an annual yield of 3.84% (i.e., $3.96 / $103.17). Moreover, the investor could later sell covered calls at out-of-the-money (OTM) call option strike prices to alleviate some of the unrealized capital loss.
The bottom line is that this is a good way to get paid while waiting for XOM stock to rise to its higher price target.