Hewlett Packard (NYSE:HPE) will release its quarterly earnings report on Thursday, 2024-12-05. Here's a brief overview for investors ahead of the announcement.
Analysts anticipate Hewlett Packard to report an earnings per share (EPS) of $0.56.
The market awaits Hewlett Packard's announcement, with hopes high for news of surpassing estimates and providing upbeat guidance for the next quarter.
It's important for new investors to understand that guidance can be a significant driver of stock prices.
Historical Earnings Performance
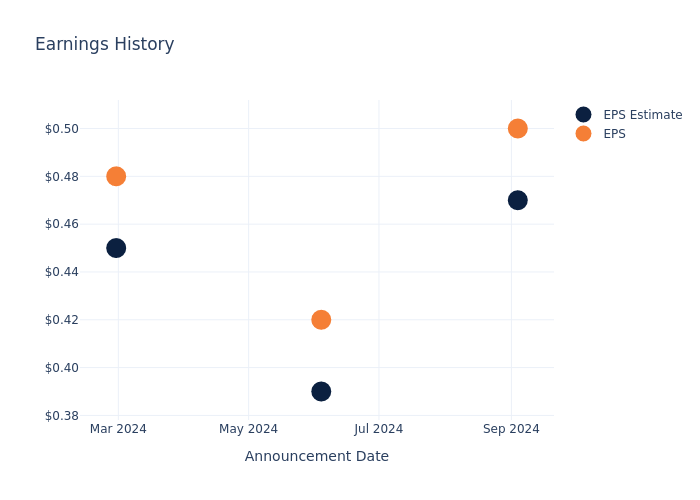
During the last quarter, the company reported an EPS beat by $0.03, leading to a 6.02% drop in the share price on the subsequent day.
Here's a look at Hewlett Packard's past performance and the resulting price change:
| Quarter | Q3 2024 | Q2 2024 | Q1 2024 | Q4 2023 |
|---|---|---|---|---|
| EPS Estimate | 0.47 | 0.39 | 0.45 | 0.50 |
| EPS Actual | 0.50 | 0.42 | 0.48 | 0.52 |
| Price Change % | -6.0% | 11.0% | 2.0% | 6.0% |

Market Performance of Hewlett Packard's Stock
Shares of Hewlett Packard were trading at $21.3 as of December 03. Over the last 52-week period, shares are up 33.93%. Given that these returns are generally positive, long-term shareholders are likely bullish going into this earnings release.
Analyst Views on Hewlett Packard
For investors, grasping market sentiments and expectations in the industry is vital. This analysis explores the latest insights regarding Hewlett Packard.
The consensus rating for Hewlett Packard is Neutral, based on 11 analyst ratings. With an average one-year price target of $21.82, there's a potential 2.44% upside.
Peer Ratings Comparison
This comparison focuses on the analyst ratings and average 1-year price targets of NetApp, Western Digital and Super Micro Computer, three major players in the industry, shedding light on their relative performance expectations and market positioning.
- The prevailing sentiment among analysts is an Neutral trajectory for NetApp, with an average 1-year price target of $135.62, implying a potential 536.71% upside.
- The prevailing sentiment among analysts is an Buy trajectory for Western Digital, with an average 1-year price target of $91.31, implying a potential 328.69% upside.
- The prevailing sentiment among analysts is an Neutral trajectory for Super Micro Computer, with an average 1-year price target of $334.38, implying a potential 1469.86% upside.
Peer Analysis Summary
The peer analysis summary presents essential metrics for NetApp, Western Digital and Super Micro Computer, unveiling their respective standings within the industry and providing valuable insights into their market positions and comparative performance.
| Company | Consensus | Revenue Growth | Gross Profit | Return on Equity |
|---|---|---|---|---|
| Hewlett Packard | Neutral | 10.11% | $2.44B | 2.34% |
| NetApp | Neutral | 6.15% | $1.18B | 32.84% |
| Western Digital | Buy | 48.91% | $1.55B | 4.28% |
| Super Micro Computer | Neutral | 37.87% | $597.37M | 6.68% |
Key Takeaway:
Hewlett Packard ranks in the middle among its peers for revenue growth. It ranks at the bottom for gross profit. It is at the bottom for return on equity.
About Hewlett Packard
Hewlett Packard Enterprise is an information technology vendor that provides hardware and software to enterprises. Its primary product lines are compute servers, storage arrays, and networking equipment; it also has a high-performance computing business. HPE's stated goal is to be a complete edge-to-cloud company. Its portfolio enables hybrid clouds and hyperconverged infrastructure. It uses a primarily outsourced manufacturing model and employs 60,000 people worldwide.
Breaking Down Hewlett Packard's Financial Performance
Market Capitalization Analysis: Reflecting a smaller scale, the company's market capitalization is positioned below industry averages. This could be attributed to factors such as growth expectations or operational capacity.
Revenue Growth: Hewlett Packard's revenue growth over a period of 3 months has been noteworthy. As of 31 July, 2024, the company achieved a revenue growth rate of approximately 10.11%. This indicates a substantial increase in the company's top-line earnings. In comparison to its industry peers, the company trails behind with a growth rate lower than the average among peers in the Information Technology sector.
Net Margin: Hewlett Packard's net margin surpasses industry standards, highlighting the company's exceptional financial performance. With an impressive 6.64% net margin, the company effectively manages costs and achieves strong profitability.
Return on Equity (ROE): Hewlett Packard's ROE excels beyond industry benchmarks, reaching 2.34%. This signifies robust financial management and efficient use of shareholder equity capital.
Return on Assets (ROA): Hewlett Packard's financial strength is reflected in its exceptional ROA, which exceeds industry averages. With a remarkable ROA of 0.85%, the company showcases efficient use of assets and strong financial health.
Debt Management: Hewlett Packard's debt-to-equity ratio is below industry norms, indicating a sound financial structure with a ratio of 0.53.
To track all earnings releases for Hewlett Packard visit their earnings calendar on our site.
This article was generated by Benzinga's automated content engine and reviewed by an editor.


