Migration tends to be discussed as a monolithic issue. But it is a complex suite of processes, including the movements of highly skilled workers such as doctors, scientists, and Premier League footballers, as well as lower-paid workers like carers and seasonal fruit pickers.
It involves international students whose fees contribute to the country’s higher education system, spouses of British citizens and residents, and people looking for humanitarian protection.
Government policies can affect how many people arrive, what rights and protections they have in the UK, and what happens to those who arrive without permission or lack a legal right to remain in the country. It is a key election topic for voters and candidates alike, with all main parties’ manifestos laying out their plans to lower legal immigration and crack down on irregular arrivals.
The five charts below – compiled with Migration Observatory researchers Ben Brindle, Mihnea Cuibus and Peter Walsh – provide a whistle-stop tour of the data behind the UK’s key debates about migration. These only scratch the surface of some very complex issues but should help you unpick what is and has been going on.
Who comes to the UK and why
The composition of net migration – the number of people arriving to live permanently minus the number leaving – has changed drastically since the Brexit referendum. Shortly before the 2016 referendum, EU citizens made up a majority of all net migration to the UK. From then, however, it began to fall, even though the UK remained part of the EU and policy towards EU citizens didn’t actually change until the start of 2020.
Estimates of net migration of EU and non-EU citizens in the UK:
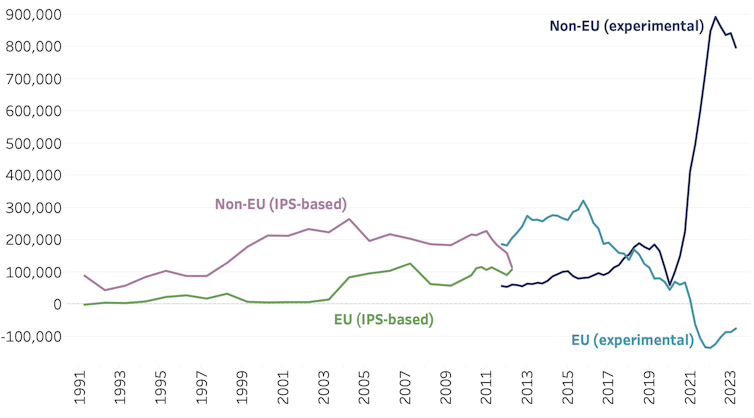
This change accelerated after the pandemic. In 2021, EU net migration fell into negative territory: that is, there were more EU citizens leaving the UK than arriving. By contrast, non-EU net migration rose sharply, reaching 892,000 in 2022.
Part of the shift in the profile of migrants owes to the post-Brexit immigration system, introduced in 2021. Compared to its predecessor, the new system was considerably more restrictive towards EU citizens and more liberal towards non-EU citizens.
Non-EU citizens now face a lower skill and salary threshold to acquire a work visa than they did before Brexit. But for EU citizens, who previously enjoyed free movement, the new system of visas and employment and salary requirements is a tightening of the rules.
But this is not the whole story. The largest groups explaining the 611,000 increase in non-EU immigration in 2023 compared to 2019 are migrant workers (53% of the increase) and international students (38%). This is not simply a result of the change in immigration rules. In the chart below, work is represented by a purple line, and study is blue.
Non-EU immigration to the UK, by reason:
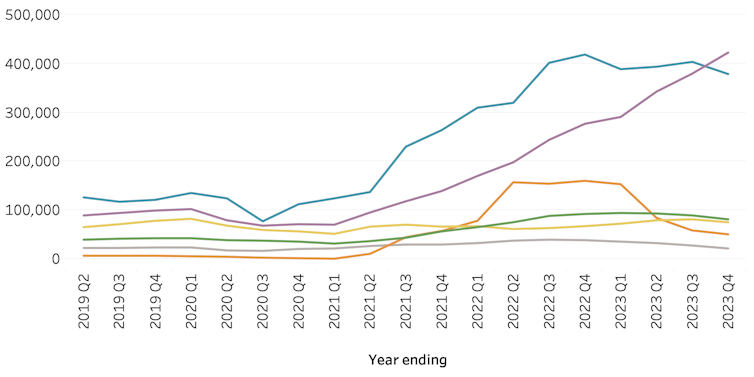
Health and care was the main industry driving the growth in work migration, including care workers who received access to the immigration system in February 2022. There has also been higher demand for some workers who were already eligible for visas under the old system, such as doctors and nurses.
Read more: How visas for social care workers may be exacerbating exploitation in the sector
The rise in international student numbers owes in part to the reintroduction of a post-study work visa, known as the graduate visa. But it is also due to the UK’s explicit strategy to increase and diversify student recruitment.
Early data from recent months suggests that net migration could be substantially lower in 2024, although we will not have a clear picture of the changes until much later in the year.
Asylum: boats and the backlog
Small boat arrivals have come to dominate the UK’s migration debate, although they make up a tiny fraction of all immigration. Such arrivals have increased sharply since 2018. After around 250 people arrived at the end of that year, the home secretary declared Channel crossings a “major incident”.
Small boat arrivals from 2018 to 2023:
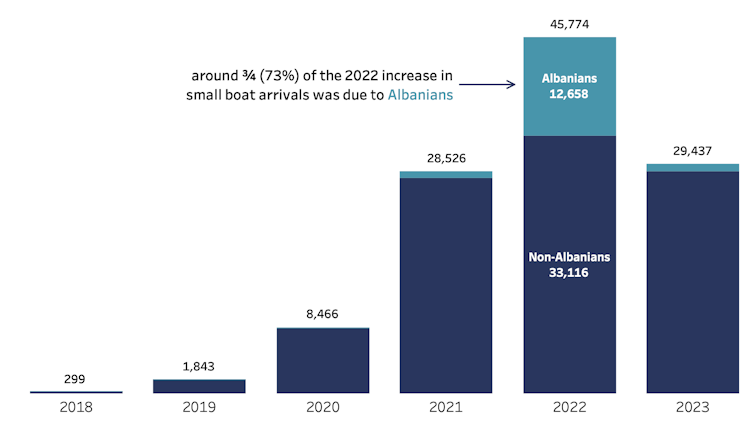
Small boat arrivals peaked at around 46,000 in 2022. Almost three-quarters of the increase compared with 2021 was due to arrivals from Albania during the summer. It remains unclear why Albanian arrivals spiked in 2022, or why they declined so rapidly in October and November of that year. While the government credits this decline to a new returns agreement with Albania, this was only announced in December.
The future of small boat arrivals remains extremely uncertain. Crossings have persisted despite numerous government policies over the past three years to prevent or deter departures, including the plan to deport asylum seekers to Rwanda, which has not yet taken effect. Rishi Sunak has said that flights to Rwanda will take off if the Conservatives win the election, while Labour leader Keir Starmer has vowed to scrap the policy.
The UK’s backlog of unprocessed asylum applications has been another focus of debate, and statistical dispute.
In December 2022, Sunak said that the asylum backlog was half the size that it was when Labour was in office. A week later, the immigration minister, Robert Jenrick, said that the Conservative government inherited a backlog of 450,000 unresolved cases from the last Labour government.
In fact, the government’s official statistics show that the asylum backlog stood at around 6,000 at the end of 2010, not 450,000. The backlog increased consistently until the end of 2022 when it reached a peak of 132,000 applications – 22 times higher than at the end of 2010.
The UK’s asylum backlog increased 22-fold from 2010 to 2022 – but is now falling:
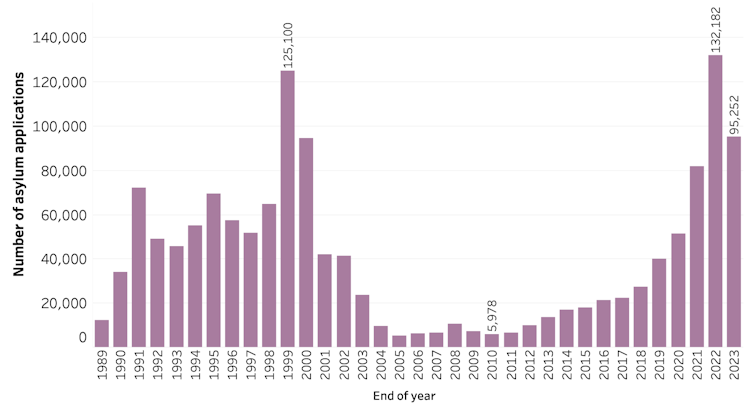
In response to this debate, the UK’s official statistics watchdog criticised the government’s use of asylum backlog data.
In December 2022, Sunak pledged to clear the asylum backlog by the end of the following year. This was later clarified to refer not to the entire backlog but just the “legacy” backlog – roughly 92,000 applications lodged before the Nationality and Borders Act, a new immigration law, came into effect in June 2022.
At the beginning of 2024, the government announced that the commitment to clear the backlog had been delivered. However, official statistics showed there were around 3,900 unresolved cases left in the “legacy” backlog. Again, the watchdog intervened to say the government’s claims were misleading.
Enforced removals and voluntary departures from 2004 to 2023:
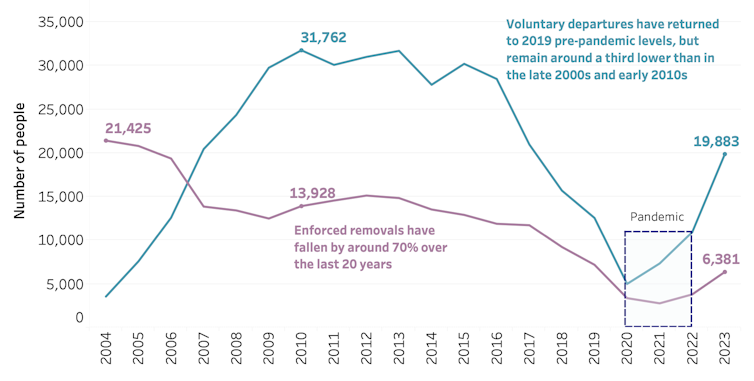
Despite implementing a “hostile environment” policy toward people with no right to be in the UK, the government has struggled to make them leave the country, either voluntarily or forcibly. Significantly fewer people were returned to other countries in the last decade compared to when Labour were last in power.
Read more: Hostile environment, Brexit and missed targets: 14 years of Tory immigration policy
Between 2010 and 2020, the overall number of returns collapsed by 82% – a trend accelerated by the pandemic but long predating it. While numbers have somewhat recovered since, they remain well below those seen in the late 2000s and early 2010s. Enforced removals were particularly affected by the decline – in 2023, they remained at less than half the level recorded in 2010.
The reasons for the decline are not fully understood, and do not necessarily result exclusively from policy or the resources available for enforcement. Other factors, such as changes in the composition of the irregular migrant population and the ease with which they can be removed, may have played a role.
Rob McNeil does not work for, consult, own shares in or receive funding from any company or organisation that would benefit from this article, and has disclosed no relevant affiliations beyond their academic appointment.
This article was originally published on The Conversation. Read the original article.


