eBay, Inc (NASDAQ:EBAY), Meta Platforms, Inc (NASDAQ:META) and Lululemon Athletica, Inc (NASDAQ; LULU) have created double bottom and triple bottom patterns on the daily chart.
A double bottom pattern is a reversal indicator that shows a stock has dropped to a key support level, rebounded, back tested the level as support and is likely to rebound again. It is possible the stock may retest the level as support again, creating a triple bottom or even quadruple bottom pattern.
The formation is always identified after a security has dropped in price and is at the bottom of a downtrend, whereas a bearish double top pattern is always found in an uptrend. A spike in volume confirms the double bottom pattern was recognized, and subsequent increasing volume may indicate the stock will reverse into an uptrend.
- Aggressive bullish traders may choose to take a position when the stock’s volume spikes after the second retest of the support level. Conservative bullish traders may wait to take a position when the stock’s share price has surpassed the level of the initial rebound (the high before the second bounce from the support level).
- Bearish traders may decide to open a short position if the stock rejects at the level of the first rebound, or if the stock falls beneath the key support level where created the double bottom pattern.
See Also: Lululemon Launches Footwear Collection: What Investors Should Know
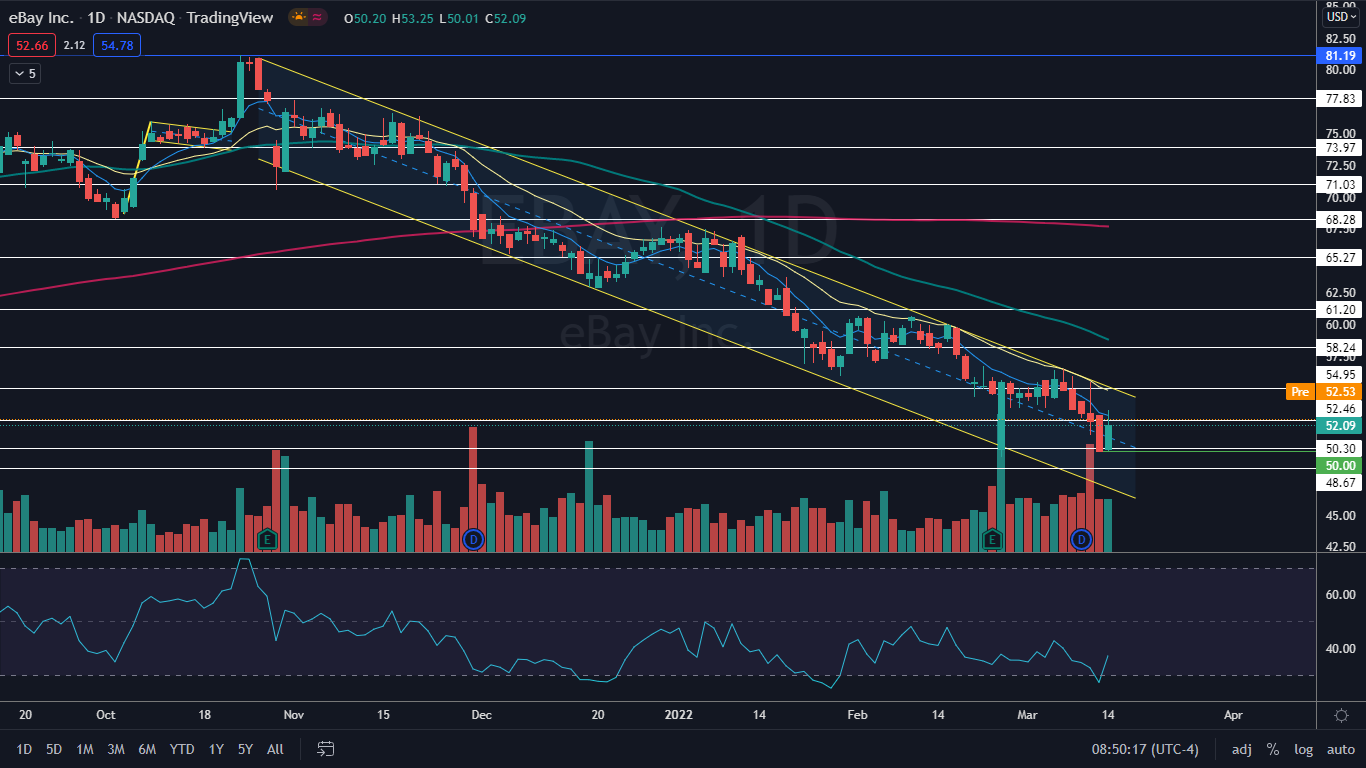
The eBay Chart: eBay entered into a long-term downtrend on Oct. 26, after forming a bearish triple top pattern on that day and the two previous trading days near the Oct. 22 all-time high of $81.19. The stock has been making a consistent series of lower highs and lower lows between two parallel descending lines that have formed a falling channel pattern. The pattern is considered bearish until a stock breaches the top trendline of the channel on higher-than-average volume.
On March 11, eBay tested the $50 level of support and held above it and on Monday the stock opened slightly above the level and bounced up over 4% off the area, which created a bullish double bottom pattern. If the pattern is recognized and big bullish volume comes in to the stock, eBay may gain the power to break bullishly from the falling channel.
The stock has resistance above at $52.46 and $54.95 and support below at $50.30 and $48.67.
Want direct analysis? Find me in the BZ Pro lounge! Click here for a free trial.

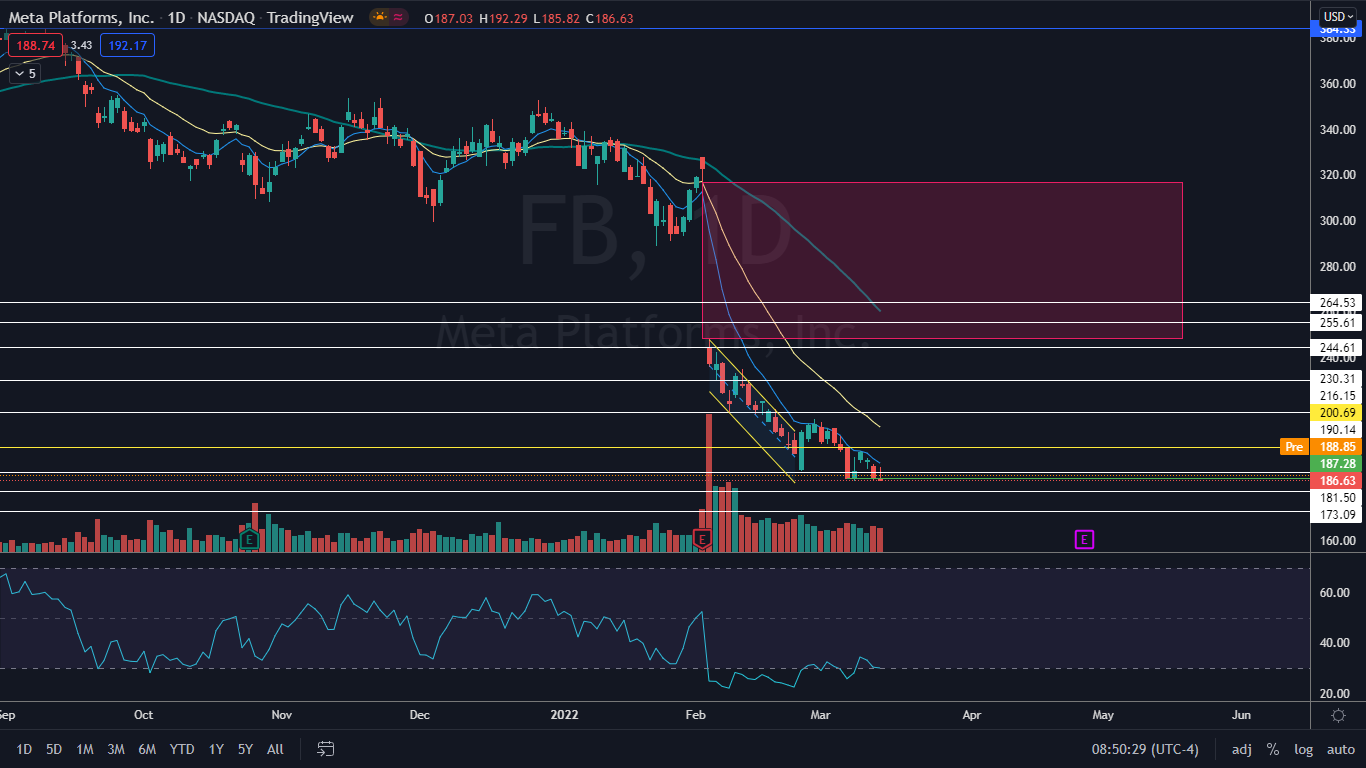
The Meta Chart: Meta entered into a downtrend on Dec. 28, which was accelerated by a bearish reaction to the company’s fourth-quarter earnings print on Feb. 2, that caused the stock to gap down 21% the following day. On March 7, Meta fell toward the $187 level and on March 8, March 11 and Monday, Meta tested the level as support and held, which may have created a quadruple bottom pattern on the daily chart.
If the pattern is recognized, traders can watch for Meta to bounce up over the March 9 high-of-day at the $200 level, which will negate the downtrend.
Meta has resistance above at $190.14 and $200.69 and support below at $181.50 and $173.09.

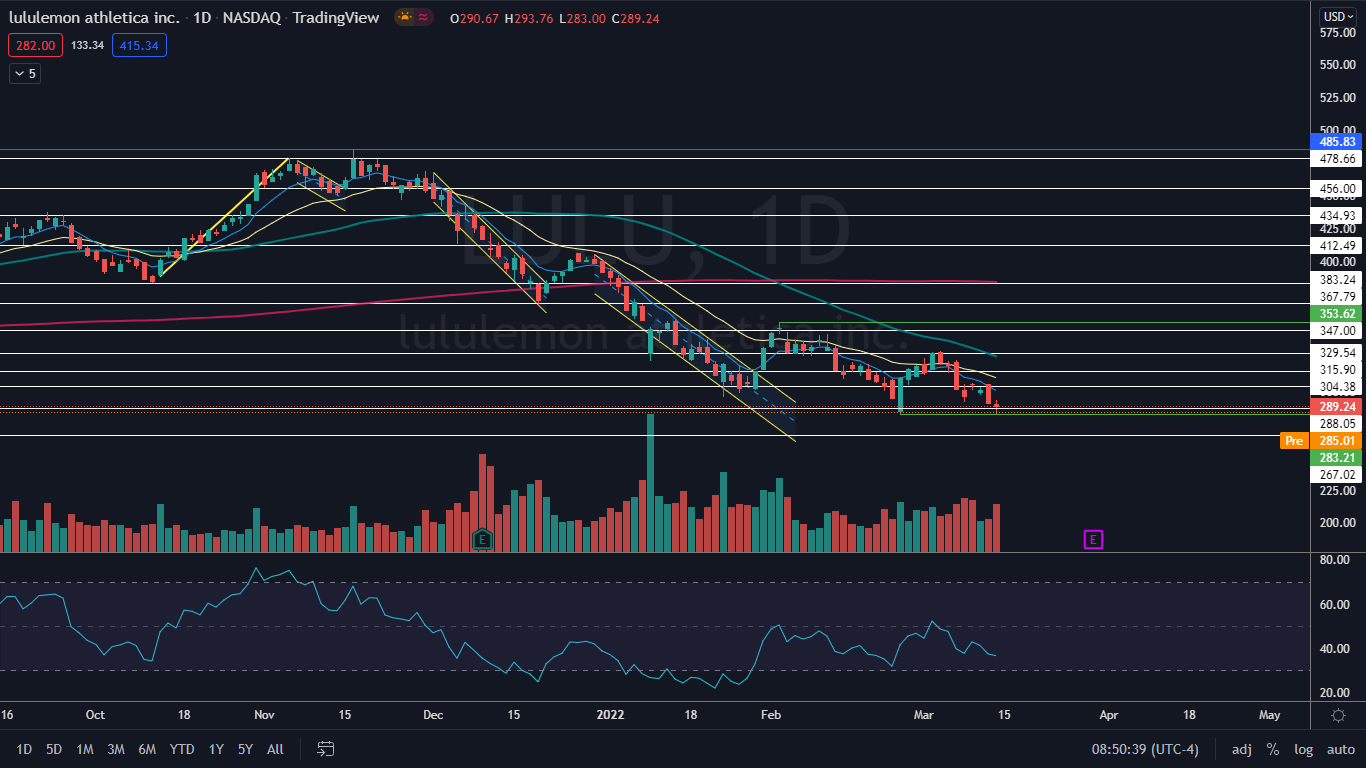
The Lululemon Chart: Lululemon has been trading in a sideways pattern since Jan. 13, between the $283 and $353 range. On Feb. 24 and Monday, Lululemon fell to the $283.21 level, where bulls came and bought the dip, which created a bullish double bottom pattern.
If the pattern is recognized, big bullish volume may come in and push Lululemon up above the March 9 high-of-day near the $308 level, which would negate the stock’s current downtrend.


