Dogecoin (CRYPTO: DOGE) was trading flat early Wednesday afternoon in line with Bitcoin (CRYPTO: BTC) and Ethereum (CRYPTO: ETH), which were muted after an initial morning boost where all three cryptos popped up between 3% and 4% higher.
The crypto sector was holding up comparatively well to the general markets, which were reacting bearishly to the increased likelihood Russia is on the verge of a full-scale invasion of Ukraine. The majority of cryptocurrencies have become so beaten down their muted reaction to news headlines could simply be that there are few sellers left and those who remain in positions are looking to hold for longer time periods.
If a war breaks out between Russia and Ukraine, traders and investors can watch to see if increasingly volume comes into the apex cryptos such as Bitcoin and Ethereum, which could indicate investors are beginning to hold the cryptos as safe haven assets. Such a phenomenon could sympathetically boost the price of Dogecoin.
See Also: Hot Doge! Order Doge-Themed Food at New Dubai Restaurant, Pay In Various Cryptos
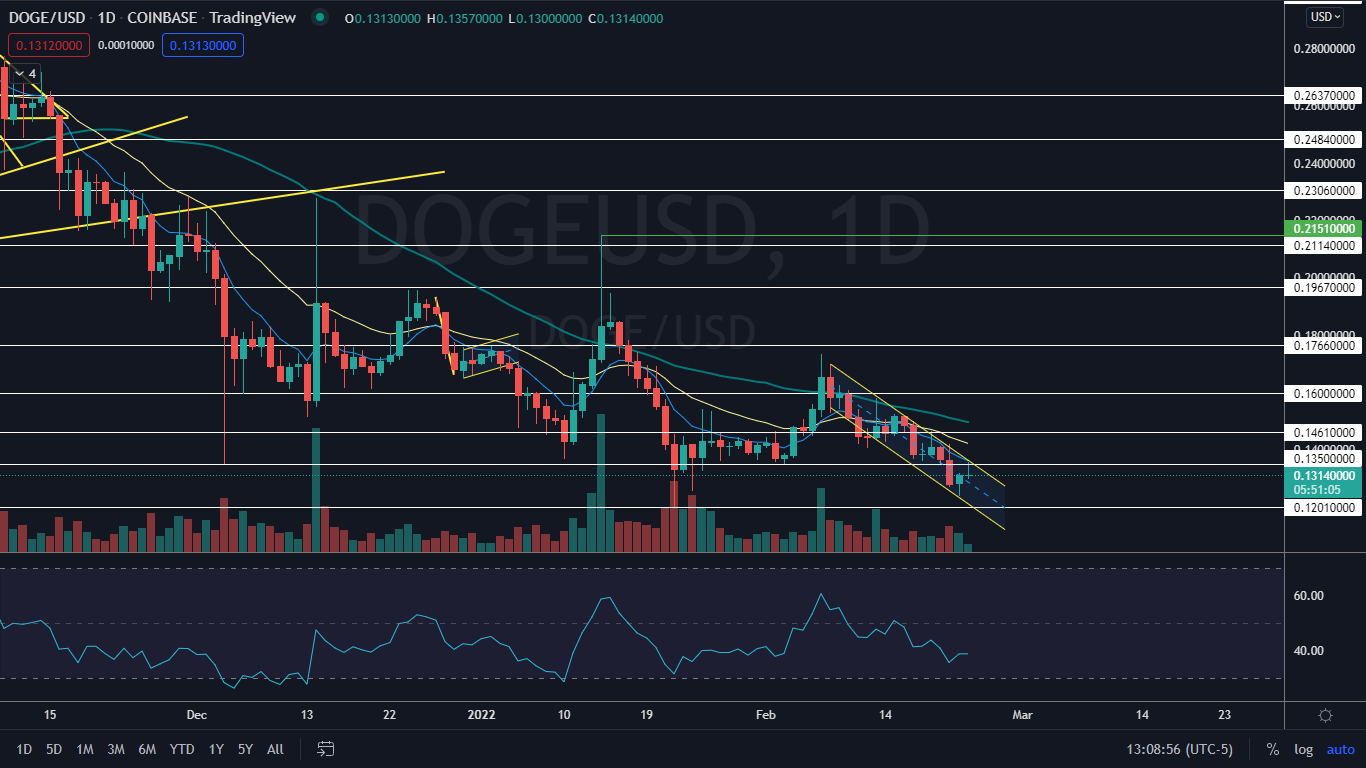
The Dogecoin Chart: Dogecoin has settled into a falling channel pattern on the daily chart as it moves lower in a downtrend between two parallel lines. On Wednesday, Dogecoin attempted to break up bullishly from the upper descending trendline of the pattern but rejected and wicked from the area.
A falling channel is considered to be bearish until a stock or crypto breaks up from the pattern. If Dogecoin does, traders and investors can watch for the break to come on higher-than-average volume on lower timeframes to gauge whether the pattern was recognized.
Dogecoin is trading on lower-than-average volume, which indicates a period of consolidation is taking place and leans toward confirming the crypto has run out of sellers. By midafternoon, Dogecoin’s volume stood at just above the 87 million compared to the 10-day average of 188.73 million.
The crypto’s relative strength index (RSI) is in a downtrend and currently measuring in at about 38%. When a stock or crypto’s RSI reaches or nears the 30% level it becomes oversold, which can be a buy signal for technical traders. When Dogecoin’s RSI hit the 32% level on Jan. 22, the crypto shot up about 44% over the 16 days that followed.
Dogecoin is trading below the eight-day and 21-day exponential moving averages (EMAs), with the eight-day EMA trending below the 21-day, both of which are bearish indicators. The crypto is also trading below the 50-day simple moving average, which indicates longer-term sentiment is bearish.
Want direct analysis? Find me in the BZ Pro lounge! Click here for a free trial.
- Bulls want to see big bullish volume come in and push Dogecoin up through the falling channel pattern, which will cause the crypto to regain support at the eight-day and possibly the 21-day EMA. Dogecoin has resistance above at $0.135 and $0.146.
- Bears want to see big bearish volume come in and break Dogecoin down through a key support level at the 12-cent mark. Below the level, there is psychological support at 10 cents and again at the 8-cent mark.


