Walt Disney Co. (NYSE:DIS) shares are pushing higher Thursday after the company announced better-than-expected fiscal first-quarter financial results. Disney declared quarterly revenue increased 24% year-over-year to $21.82 billion, beating the estimate of $18.63 billion. The company reported quarterly adjusted earnings of $1.06 per share, beating the 61 cent estimate.
Disney was up 3.93% at $153.02 Thursday afternoon at publication.
See Related: Why Disney Shares Are Rising Today
Disney Daily Chart Analysis
- Shares have been pushing higher after bouncing off support in what technical traders call a pennant pattern. The stock is nearing resistance in the pattern and if it is able to break above the pattern resistance and hold above, it may see a strong bullish push.
- The stock is trading above the 50-day moving average (green) but below the 200-day moving average (blue), indicating the stock looks to be consolidating. The 50-day moving average may hold as an area of support while the 200-day moving average may act as an area of resistance.
- The Relative Strength Index (RSI) has been pushing higher the past couple of weeks and now sits at 60. The cross above the middle line shows the stock is now seeing more buying pressure than it is selling pressure. One could argue this is a bullish sign for the stock’s future.
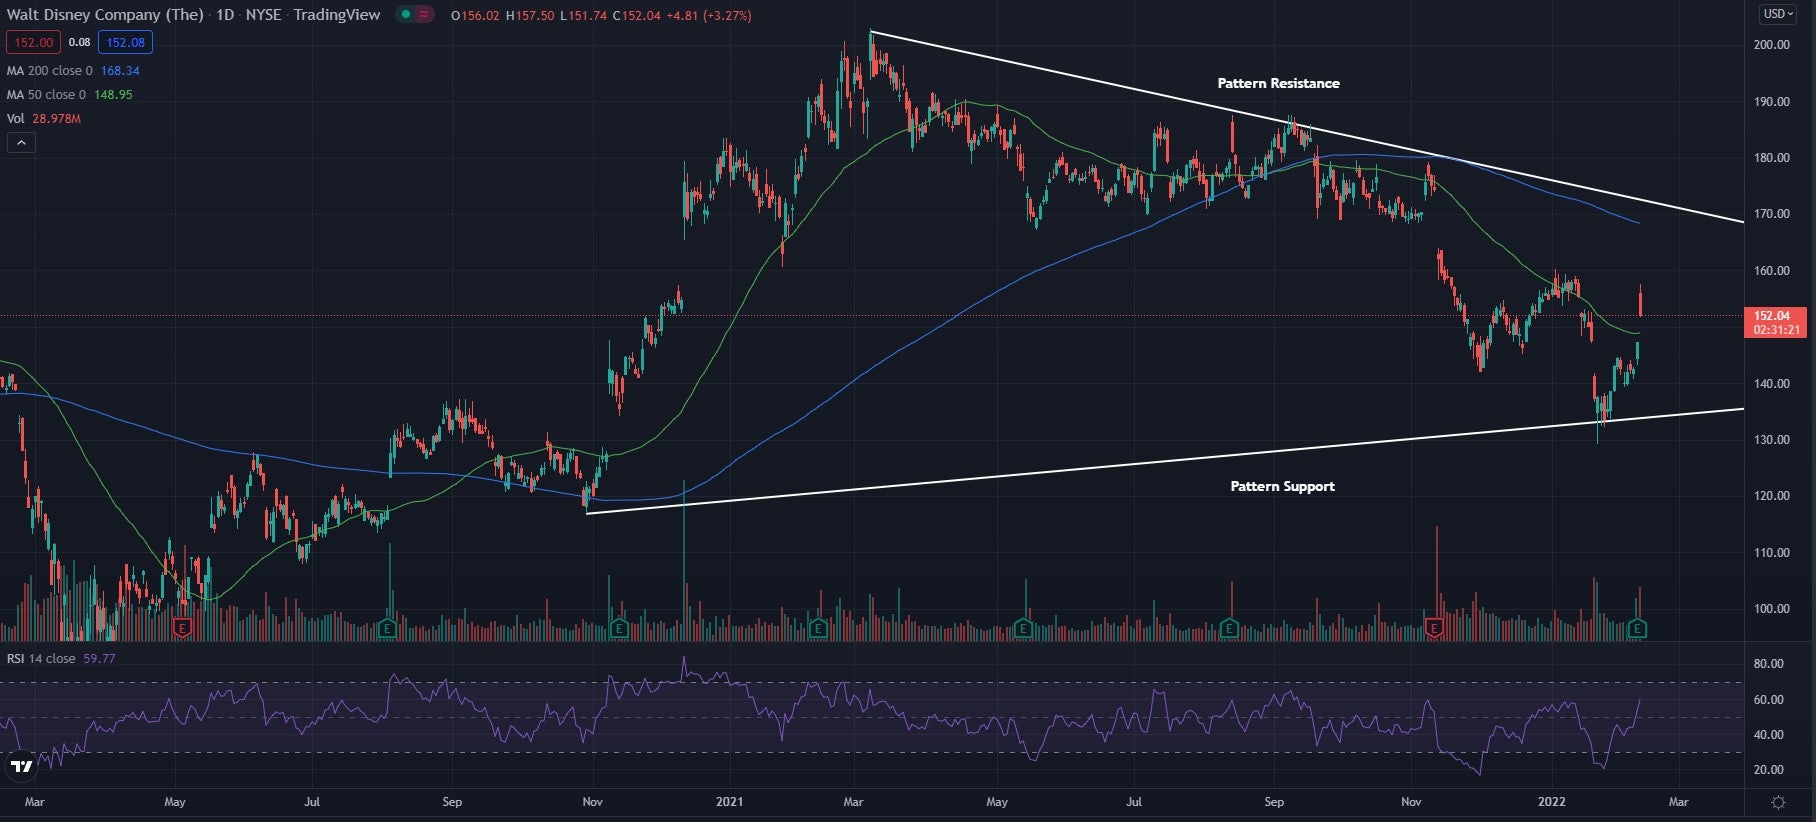
What’s Next For Disney?
Disney has been pushing higher since the announcement and looks to be pushing closer to resistance. If the price can cross this level, the stock could see a breakout and possibly start a strong bullish trend. For this to happen, bulls want the stock to cross above both the pattern resistance and the 200-day moving average. Bullish traders are also looking for the RSI to reach the overbought region as the stock breaks this resistance to show there are lots of buyers in the stock. Bearish traders want the stock fall back below the 50-day moving average and then go on to dip below the pattern support.
Photo by Héctor Vásquez on Unsplash