In this report, we are able for the first time to show the carbon footprint of our digital media operations. Guardian News and Media (GNM) has developed the methodology in partnership with the Sympact Project, researchers at the University of Bristol and Surrey.
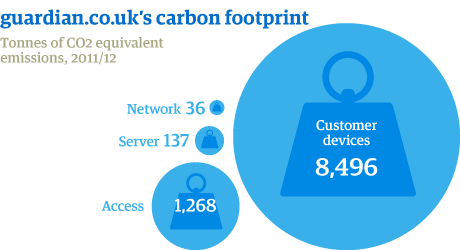
The estimated carbon footprint of providing content for www.guardian.co.uk and www.guardiannews.com, as well as for our audience to consume it, for the year 2011-12 is about 10,000 tonnes CO2e – around a third of our current overall business footprint.
Why
There is a perception that digital products (ie, websites, blogs and mobile apps) are typically viewed as being "carbon light" or low impact, especially compared with paper products.
This is largely because people do not understand the complexity of the internet, given its global and opaque nature, and do not have a direct connection to the effects of their media consumption.
We teamed up with Sympact to focus on developing a deeper understanding of the energy use and carbon dioxide emissions that result from the delivery of our digital products, such as guardian.co.uk. Sympact is joint-funded by the Research Councils UK Digital Economy and Energy Programmes.
We are not doing this as a result of regulatory pressure, but to better understand the situation for ourselves and share our findings and approach with others in the industry to help stimulate debate and encourage the development of more sustainable digital products and services.
How it works
To build our stakeholders' understand it may be valuable to set out what happens when a webpage is accessed.
As you use your laptop, tablet or smart phone, requests are sent from your device to a number of different server computers that build the components of the page, ie the template, text, pictures, video and adverts.
These requests are transferred through your Wi-Fi modem or the 3G network via your internet service provider into the internet infrastructure or network and out to the server computers, which return the data.
As set out in figure below, the path your request takes depends on which device you use, as this determines the access-network route into the internet infrastructure. The path through the internet network is driven by which server computers need to be accessed to provide data, which in turn is controlled by the type of request (ie video or text) and your geographical location.
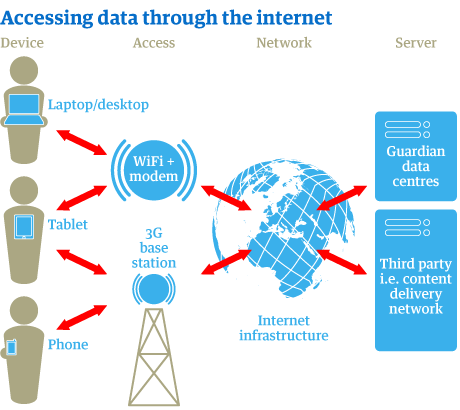
So, in the case of the Guardian webpage, the template and text comes from our own data centre in London. But many of the other elements, such as images, video, audio, and advertising are often stored on third-party servers (such as content delivery networks) that are physically closer to the reader around the world.
The Findings
Based on this analysis, we can provide an estimate of the global energy footprint of reading the Guardian online. The estimated carbon footprint for the year 2011-12 from our web operations is in the magnitude of 10,000 tonnes of CO2e. As an absolute value, this figure should be used with caution as there remain considerable uncertainties due to some of the estimates and assumptions that we have had to make.
But our primary goal for doing this work was not to report for the sake of it but to learn more about where emissions occur in this system – to guide us in knowing where we should concentrate our efforts in the future. As such, the findings have been revealing if not straightforward in the conclusions that we should draw.
More details on the methodology of the model and complexities we faced will be published shortly on our sustainability blog.
Energy consumed using guardian online is heavily dependent on the equipment (customer device) being used because, at about 86%, this is the largest source of emissions of our footprint. This makes controlling our emissions difficult. Indeed, the server computers, where we have most control, represent a much smaller element of the emissions.
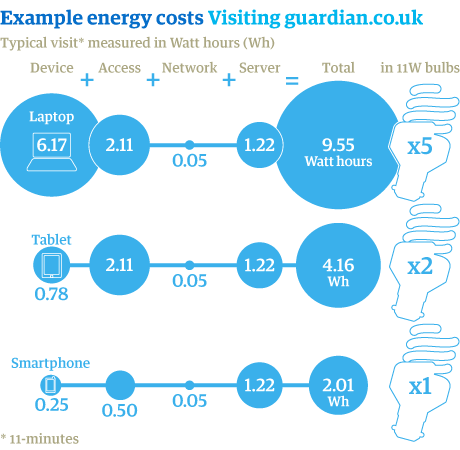
Among the most significant variables are the time that users spend consuming content, the device they use to do so, and the technology they use to connect to the internet.
For example, in the table below we compare three examples of browsing guardian online for 11 minutes (a typical visit). The first, using a laptop connected to the internet over Wi-Fi; the second via a smartphone connected over a 3G mobile network; and the third a tablet via Wi-Fi. As might be expected, the smartphone system uses less energy overall. Although the tablet still uses only half the energy of the laptop.
But each of these scenarios would suggest that we should be prioritising very different activities if we wish to reduce the overall impact of our websites on the environment. In the laptop scenario, where user devices dominate the energy footprint, we might best focus on raising awareness through our editorial coverage.
In a world where mobile access dominates, the networks and servers become more significant, suggesting we should be striving first to reduce the energy used by these components. Reducing the volume of data required to meet users' needs for news access would be one way of perhaps addressing this issue. This was discussed in more detail in previous blog post.
Actions
Of course, analysing data is one thing, but far more important is what we then do with it. The key recommendations for making progress on reducing our digital emissions are:
- Influencing behavioural change To lead the way on behaviour change through transparency and education
- Operational efficiency To reduce carbon footprint and costs by rationalising data centres through virtualisation and optimisation, and meet industry best practice
- Product development Design for sustainability to optimise delivery of content and user experience